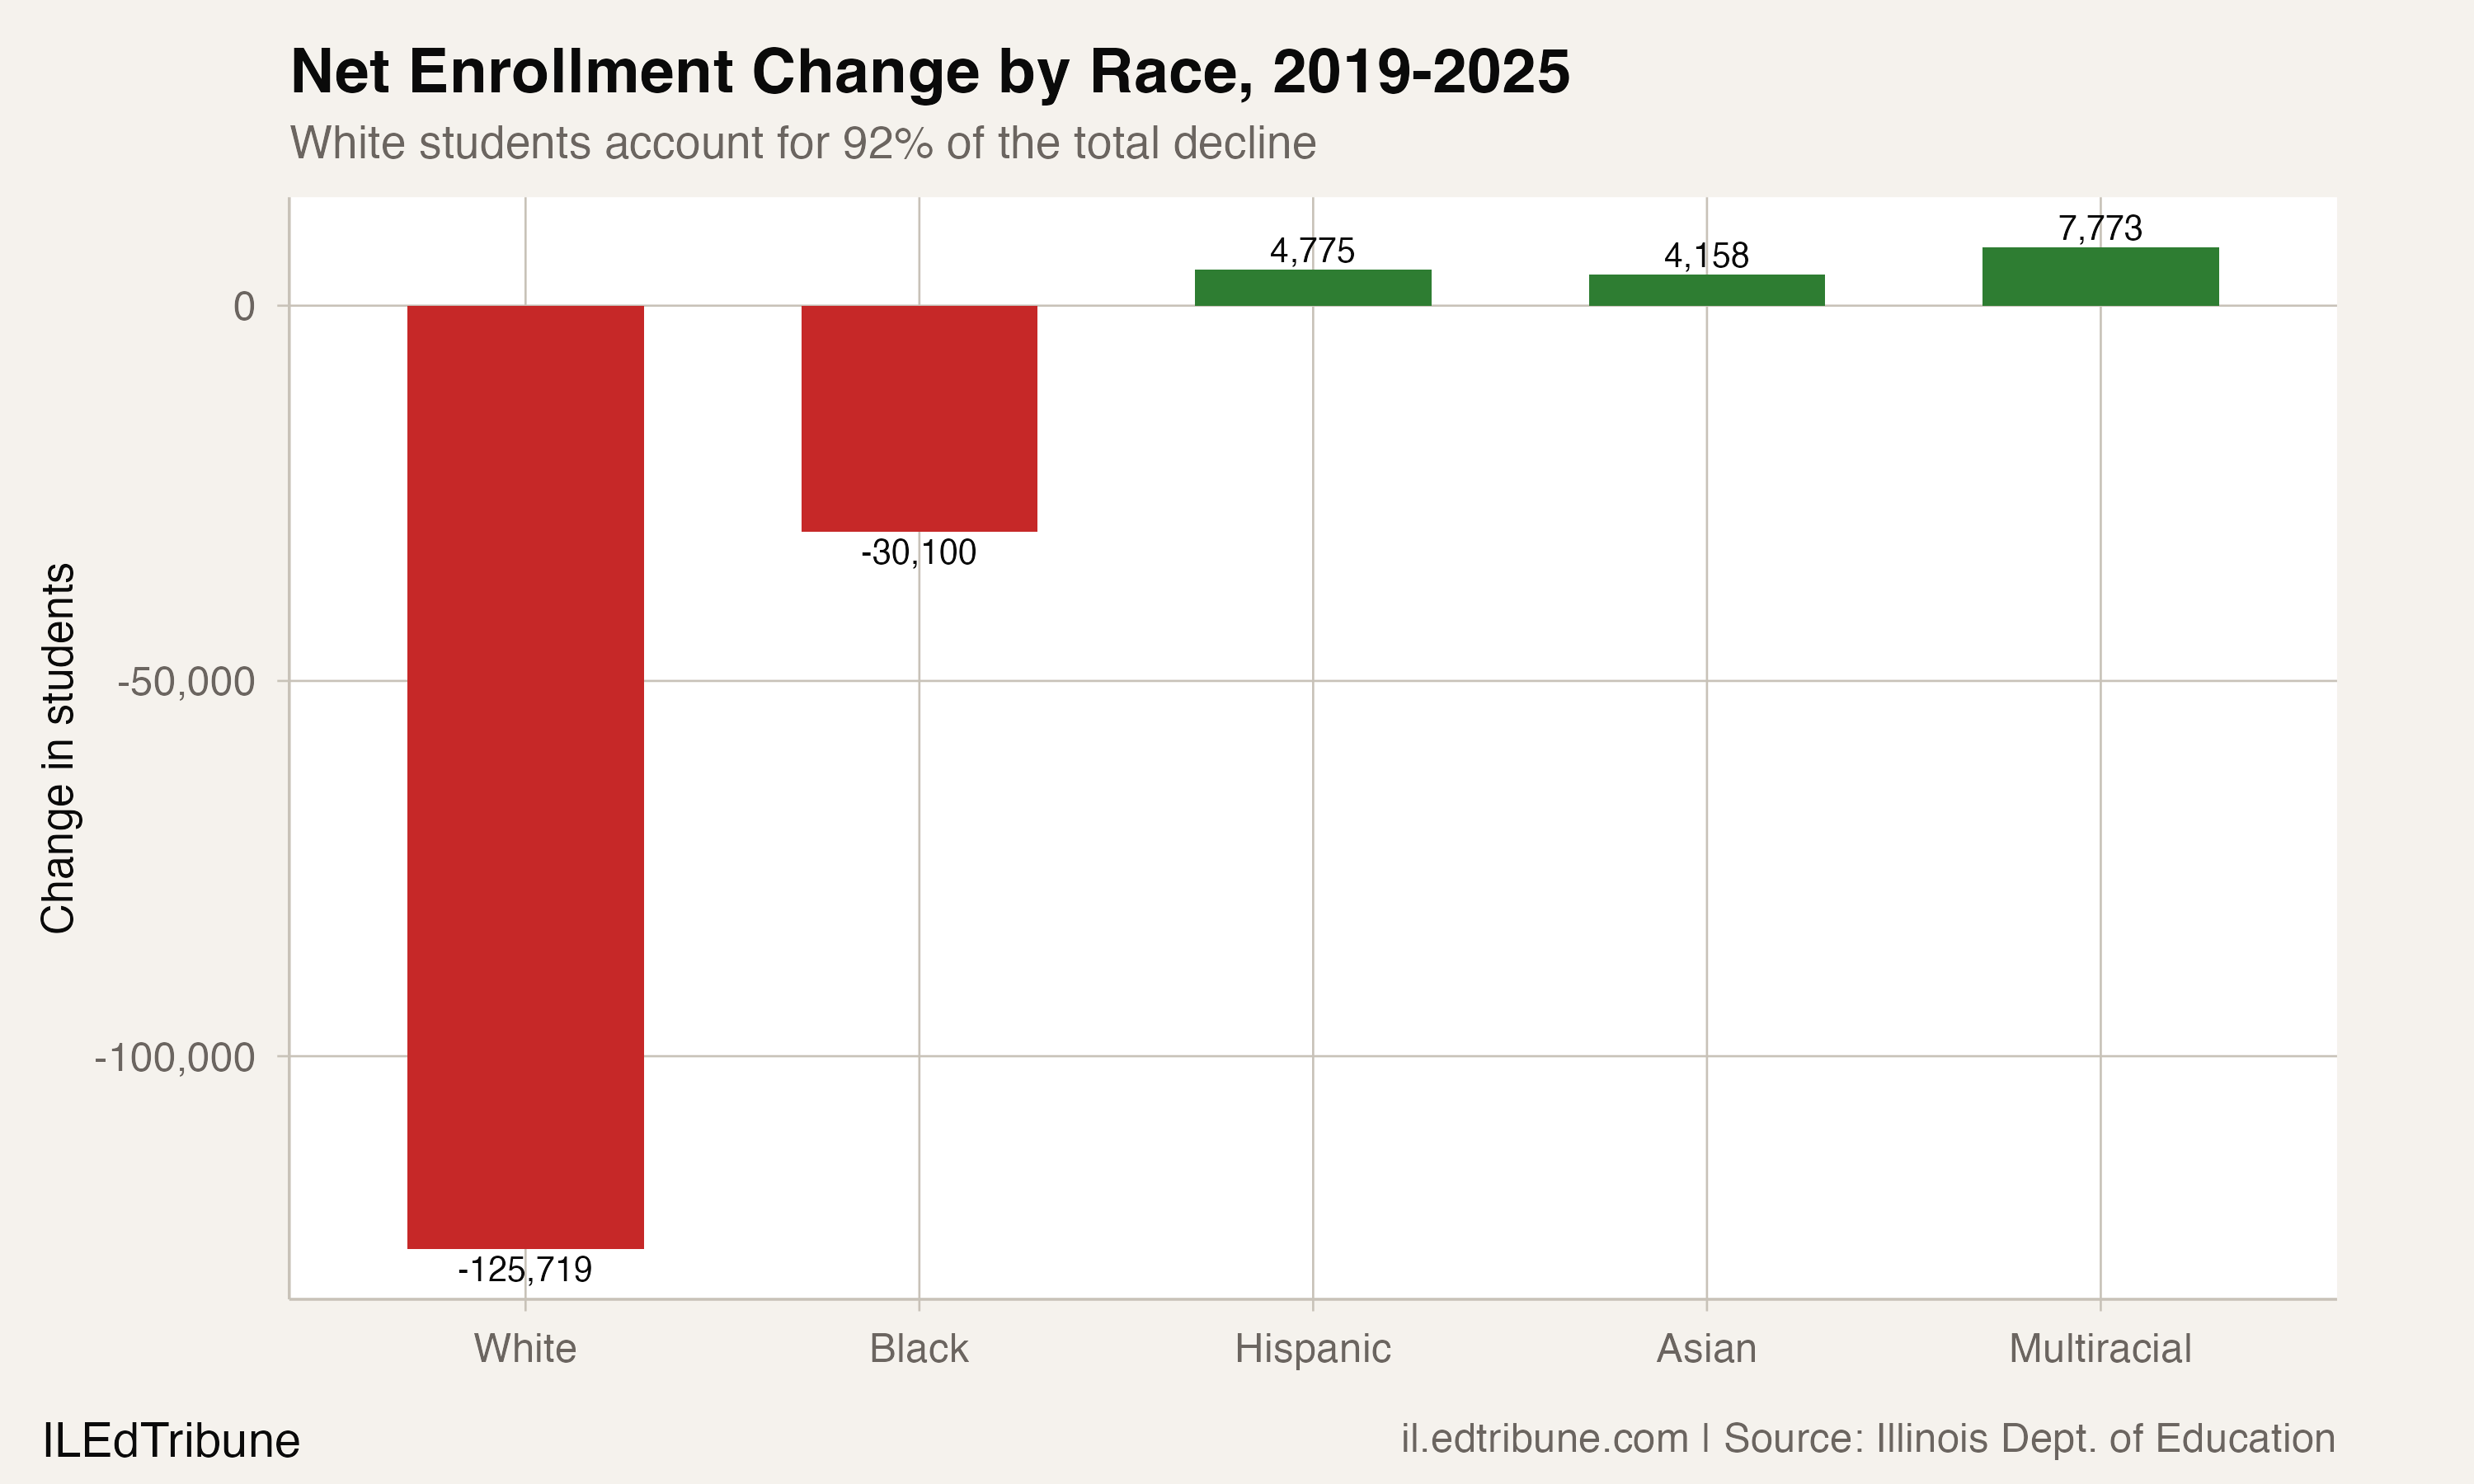
Illinois lost 135,959 students between 2018-19 and 2024-25. White students account for 125,719 of those losses — 92.5% of the total decline — even though they made up less than half of enrollment when the period began. Black enrollment fell by 30,100. Hispanic enrollment grew by 4,775, Asian by 4,158, and multiracial by 7,773. The decline is not a story about families leaving the state's schools across the board. It is overwhelmingly a story about white families leaving.
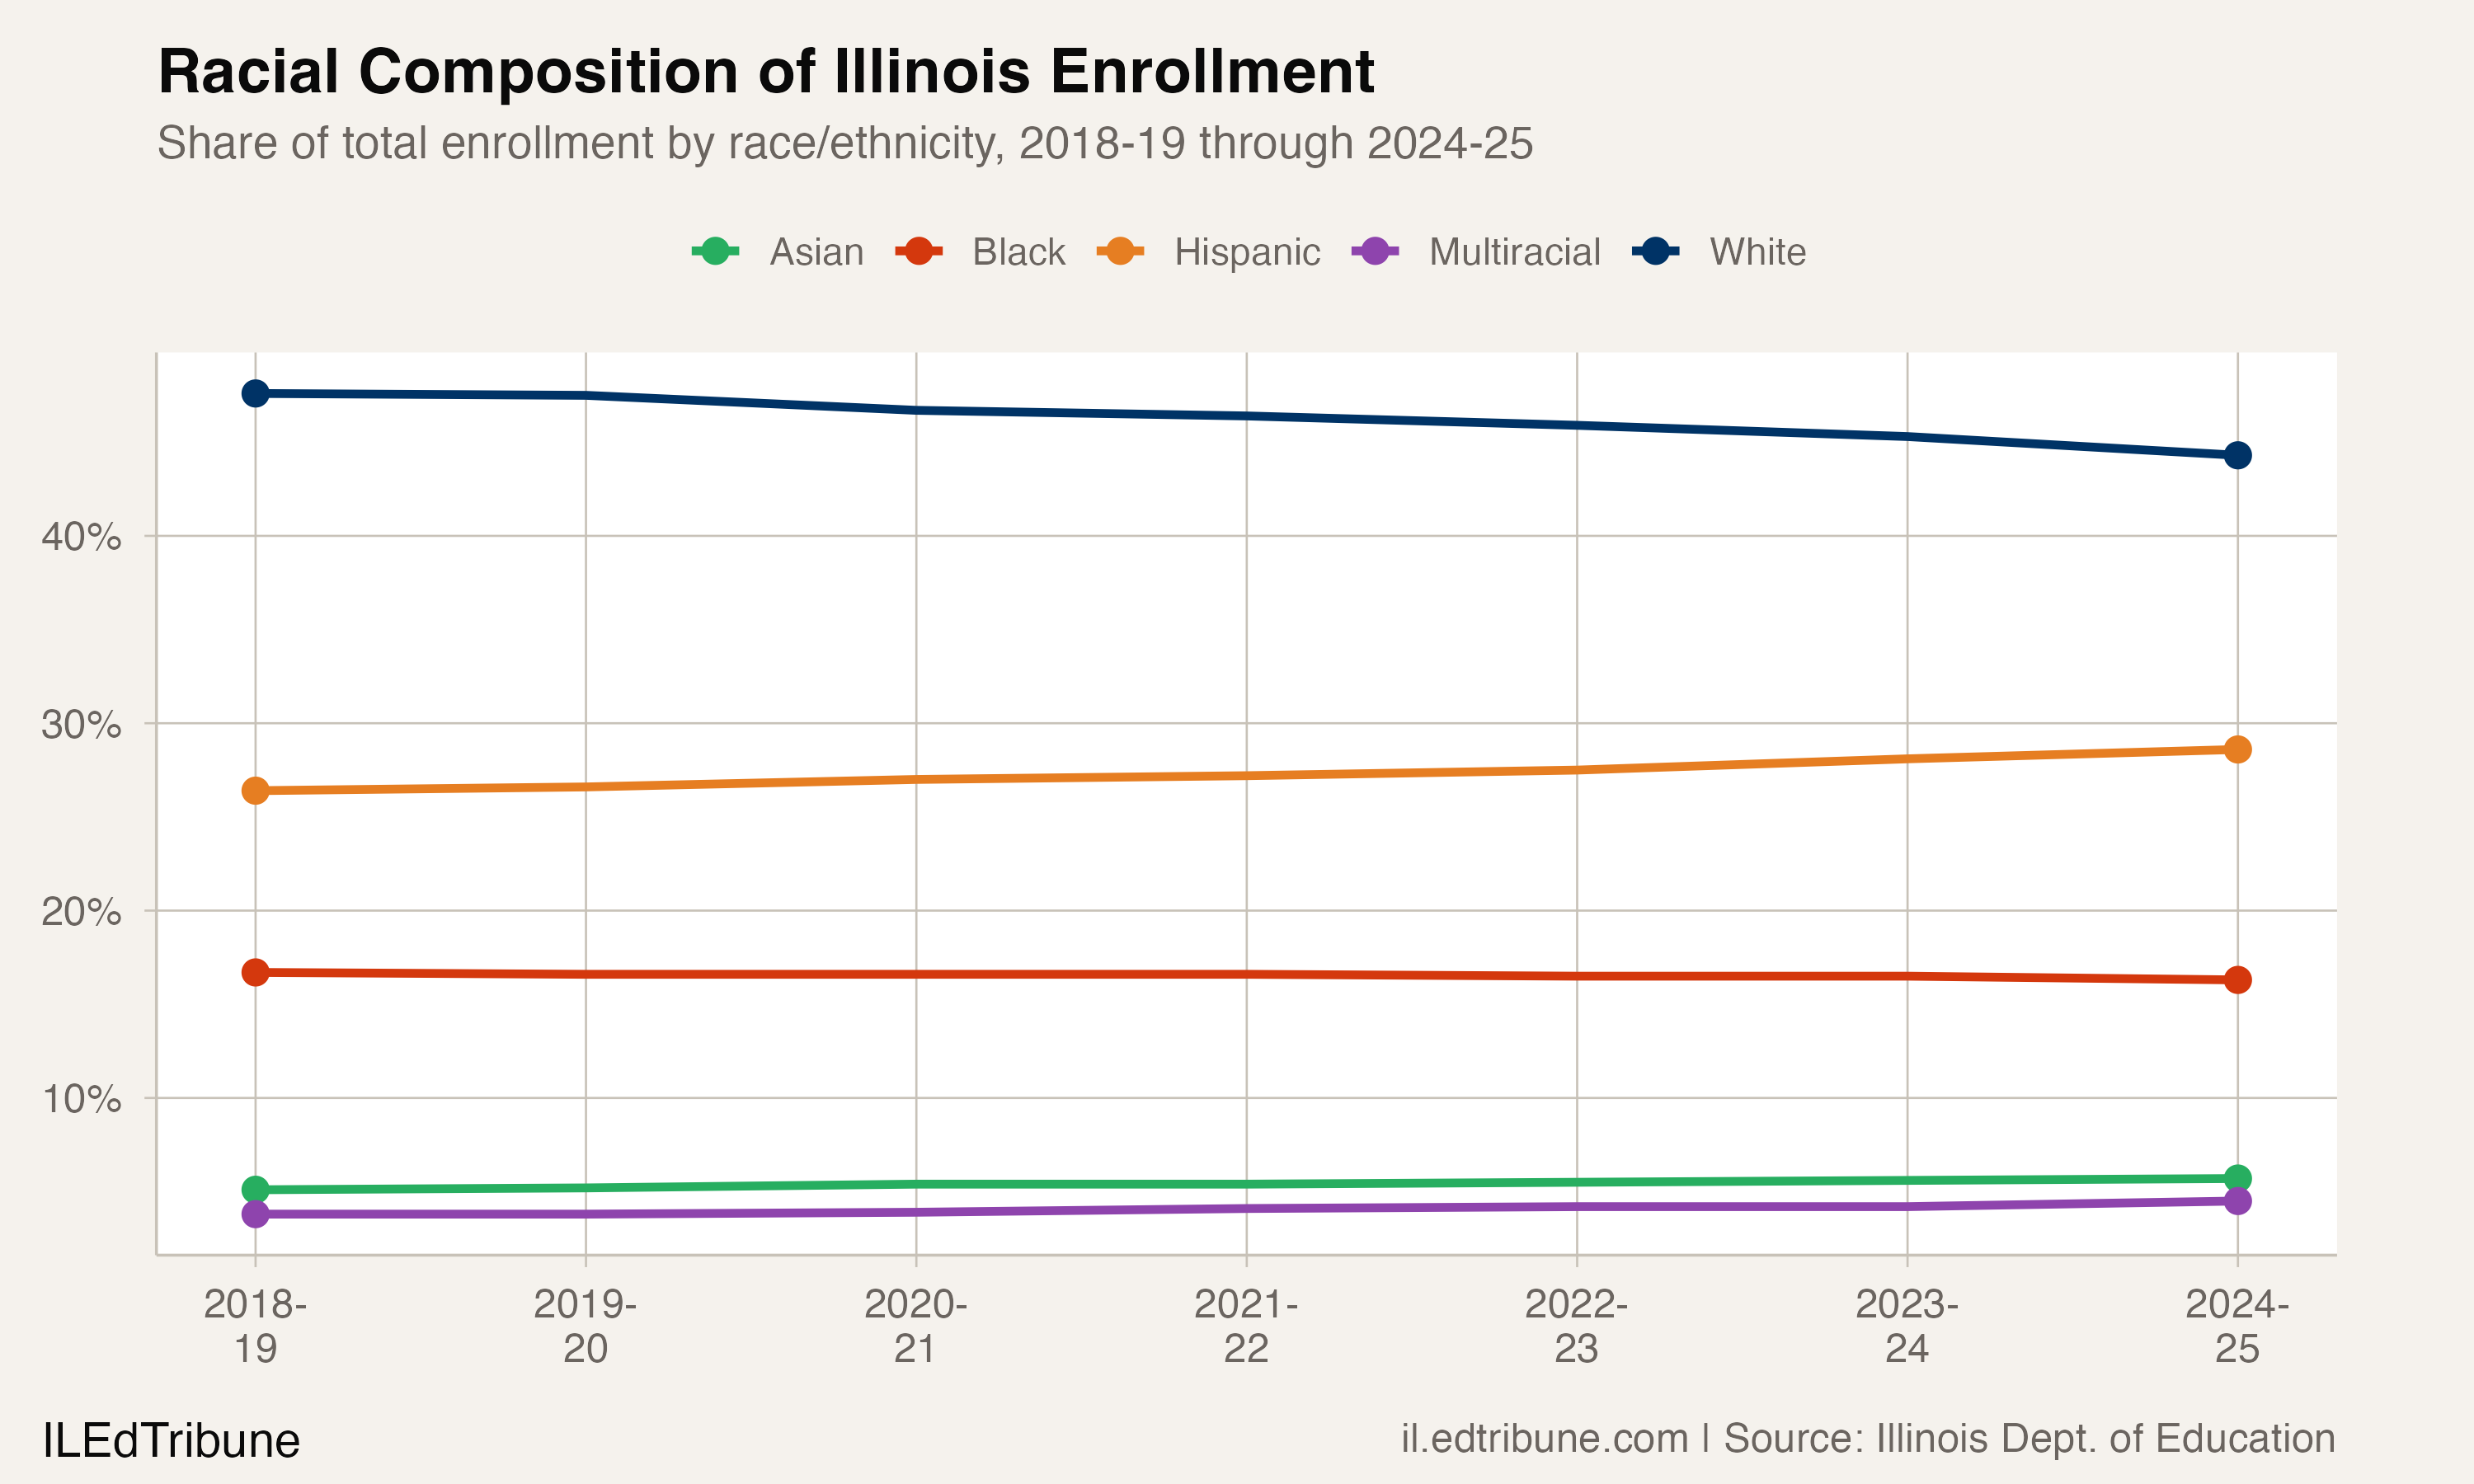
The demographic math is reshaping the system at every level. White students fell from 47.6% of enrollment to 44.3%. Hispanic students rose from 26.4% to 28.6%. The share of students identifying as multiracial grew from 3.8% to 4.5%. Illinois public schools are more diverse in 2024-25 than at any point in the available data — but the diversity is arriving through subtraction of one group rather than addition across all of them.
The south suburbs are transforming fastest
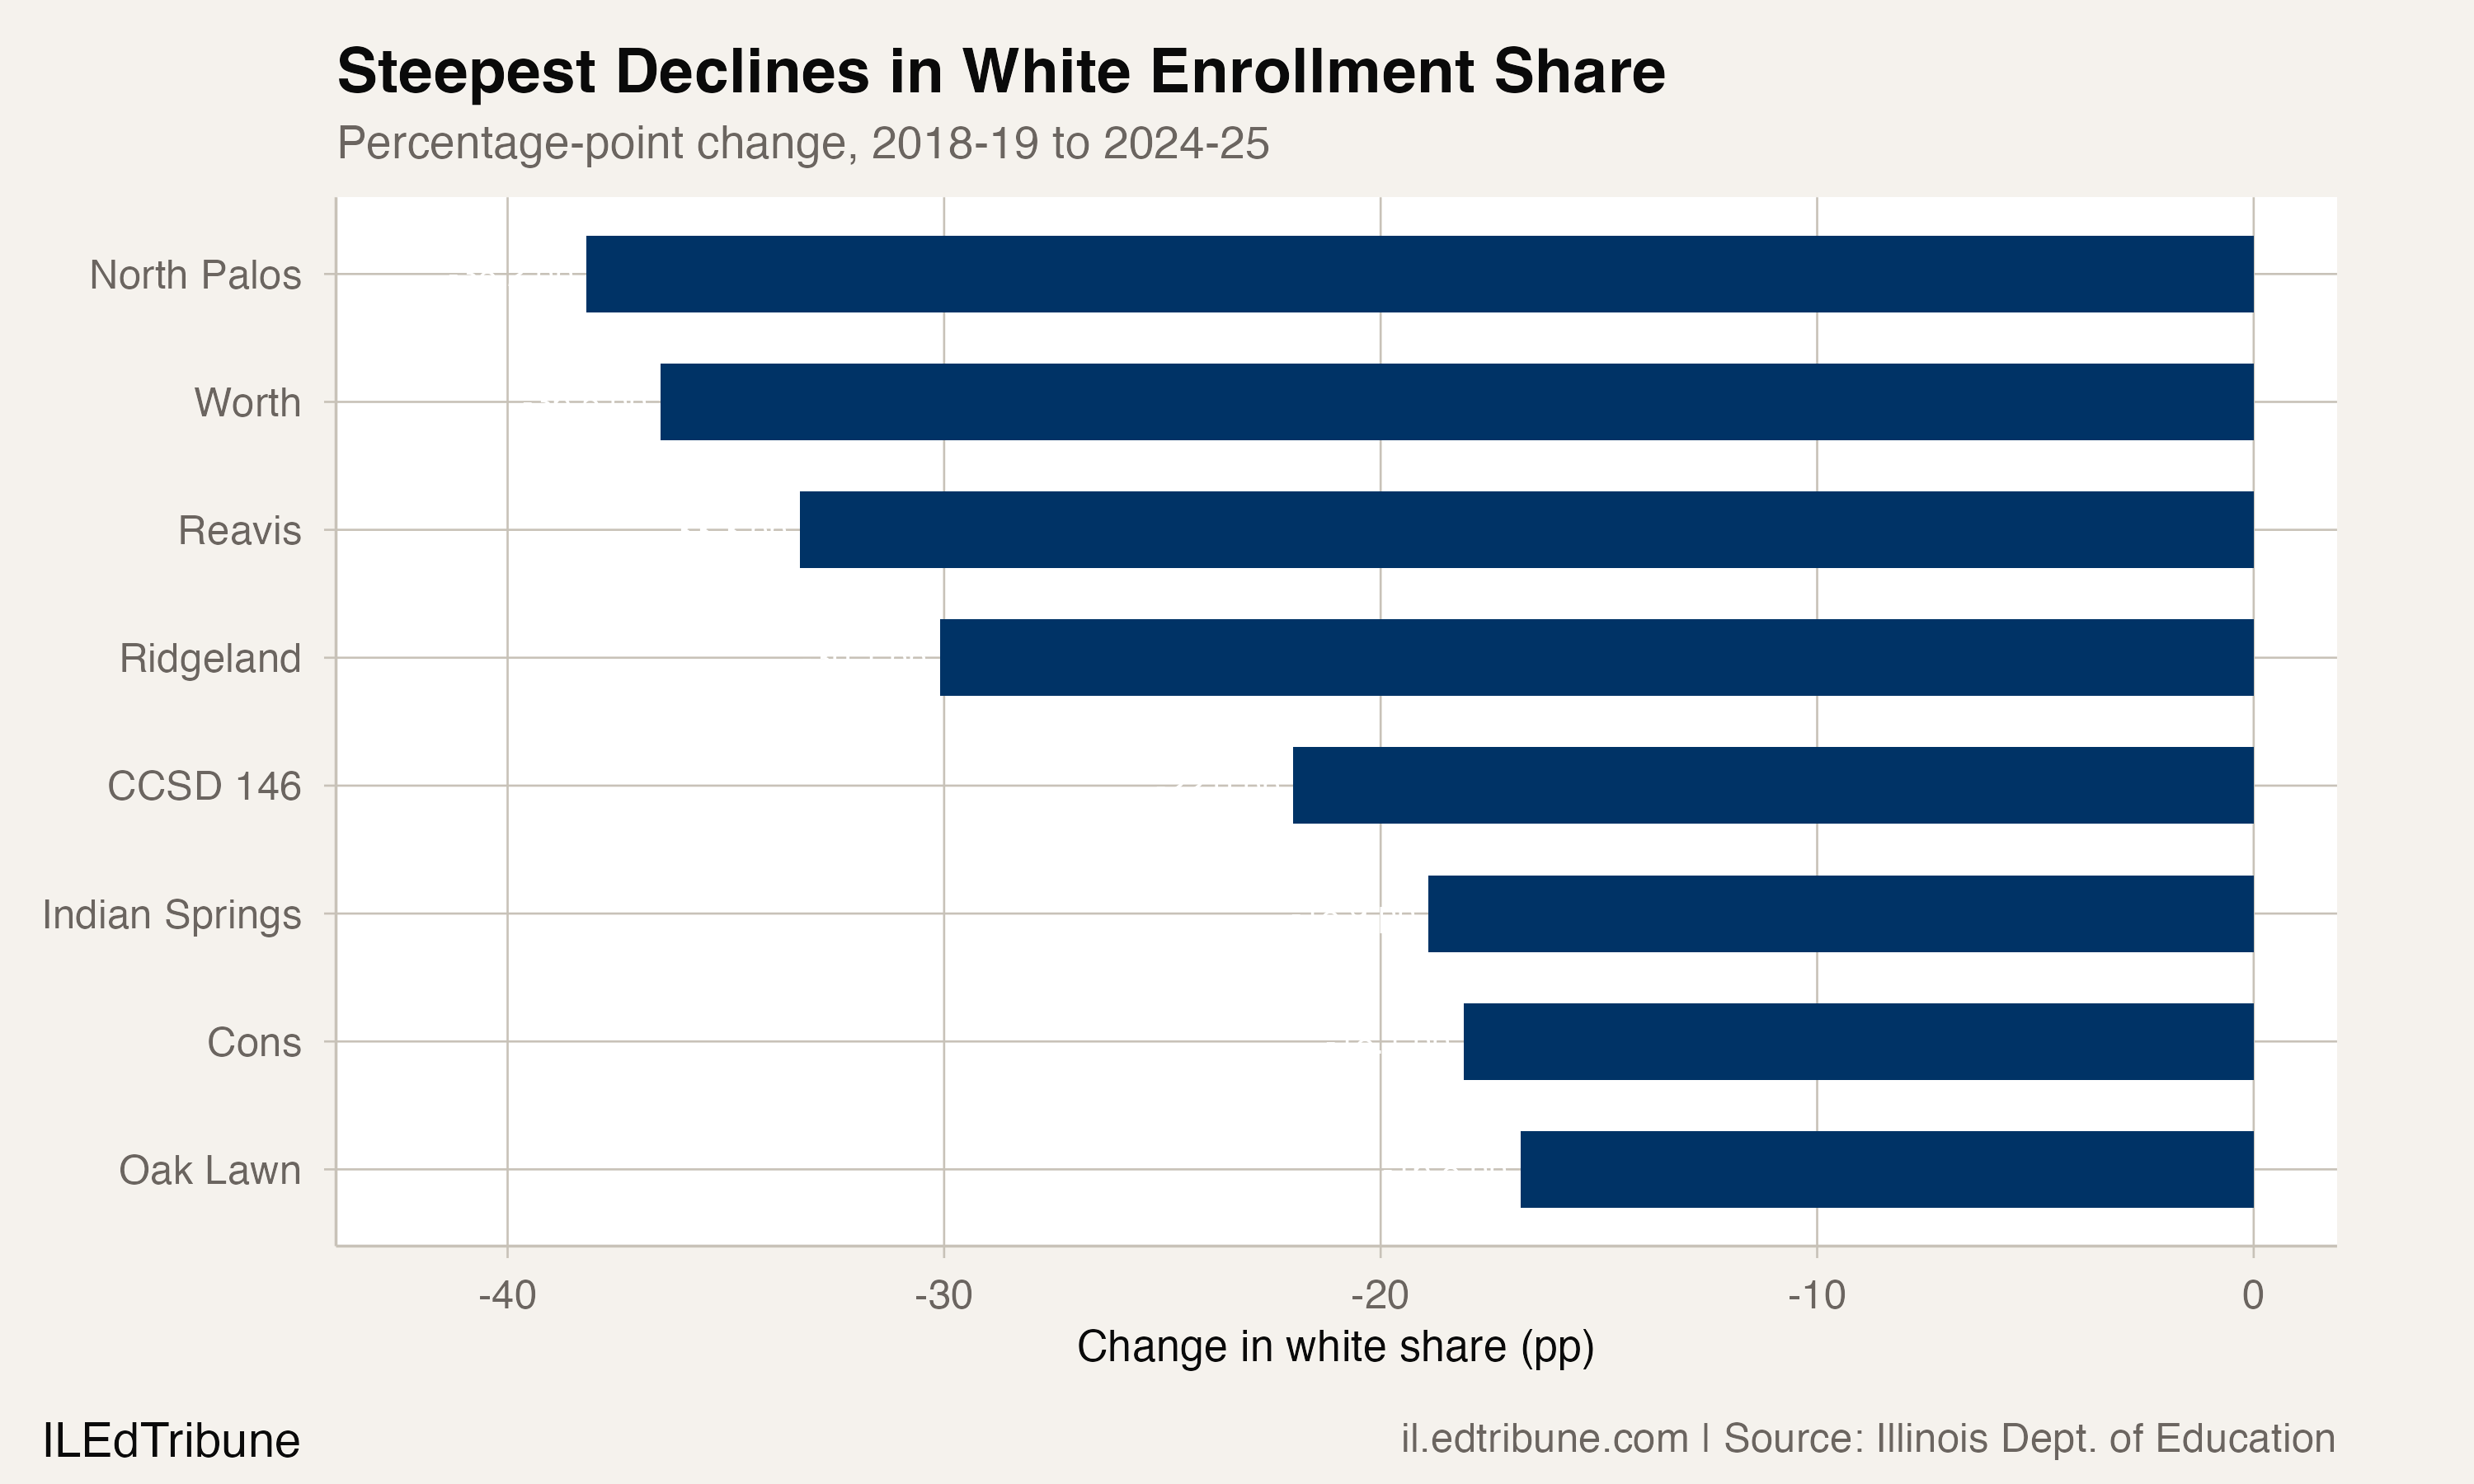
The districts where the white share of enrollment has declined most sharply are concentrated in a band of communities south and southwest of Chicago. North Palos SD 117 went from 73.3% white to 35.1% — a 38.2 percentage-point drop in six years. Worth SD 127 fell from 69.0% to 32.5%. Reavis Township HSD 220, which serves Burbank and surrounding communities, dropped from 57.1% to 23.8%.
| District | White Share 2019 | White Share 2025 | Change |
|---|---|---|---|
| North Palos SD 117 | 73.3% | 35.1% | -38.2 pp |
| Worth SD 127 | 69.0% | 32.5% | -36.5 pp |
| Reavis Twp HSD 220 | 57.1% | 23.8% | -33.3 pp |
| Ridgeland SD 122 | 63.9% | 33.8% | -30.1 pp |
| CCSD 146 | 68.1% | 46.1% | -22.0 pp |
| Indian Springs SD 109 | 58.5% | 39.6% | -18.9 pp |
| Cons HSD 230 | 74.7% | 56.6% | -18.1 pp |
| Oak Lawn CHSD 229 | 59.6% | 42.8% | -16.8 pp |
These are not small percentage-point shifts. A district that was three-quarters white six years ago is now one-third white. These communities were predominantly white working-class suburbs for decades. The speed of the transition has no local precedent.
The demographic change follows a pattern that population researchers have documented across Illinois: white and Black communities are driving population decline, while Hispanic and Asian communities are growing. In the south and southwest suburbs, the school enrollment data reflects this population shift in compressed form — families moving out are predominantly white, and families moving in are predominantly Hispanic.
345 districts losing, 52 gaining
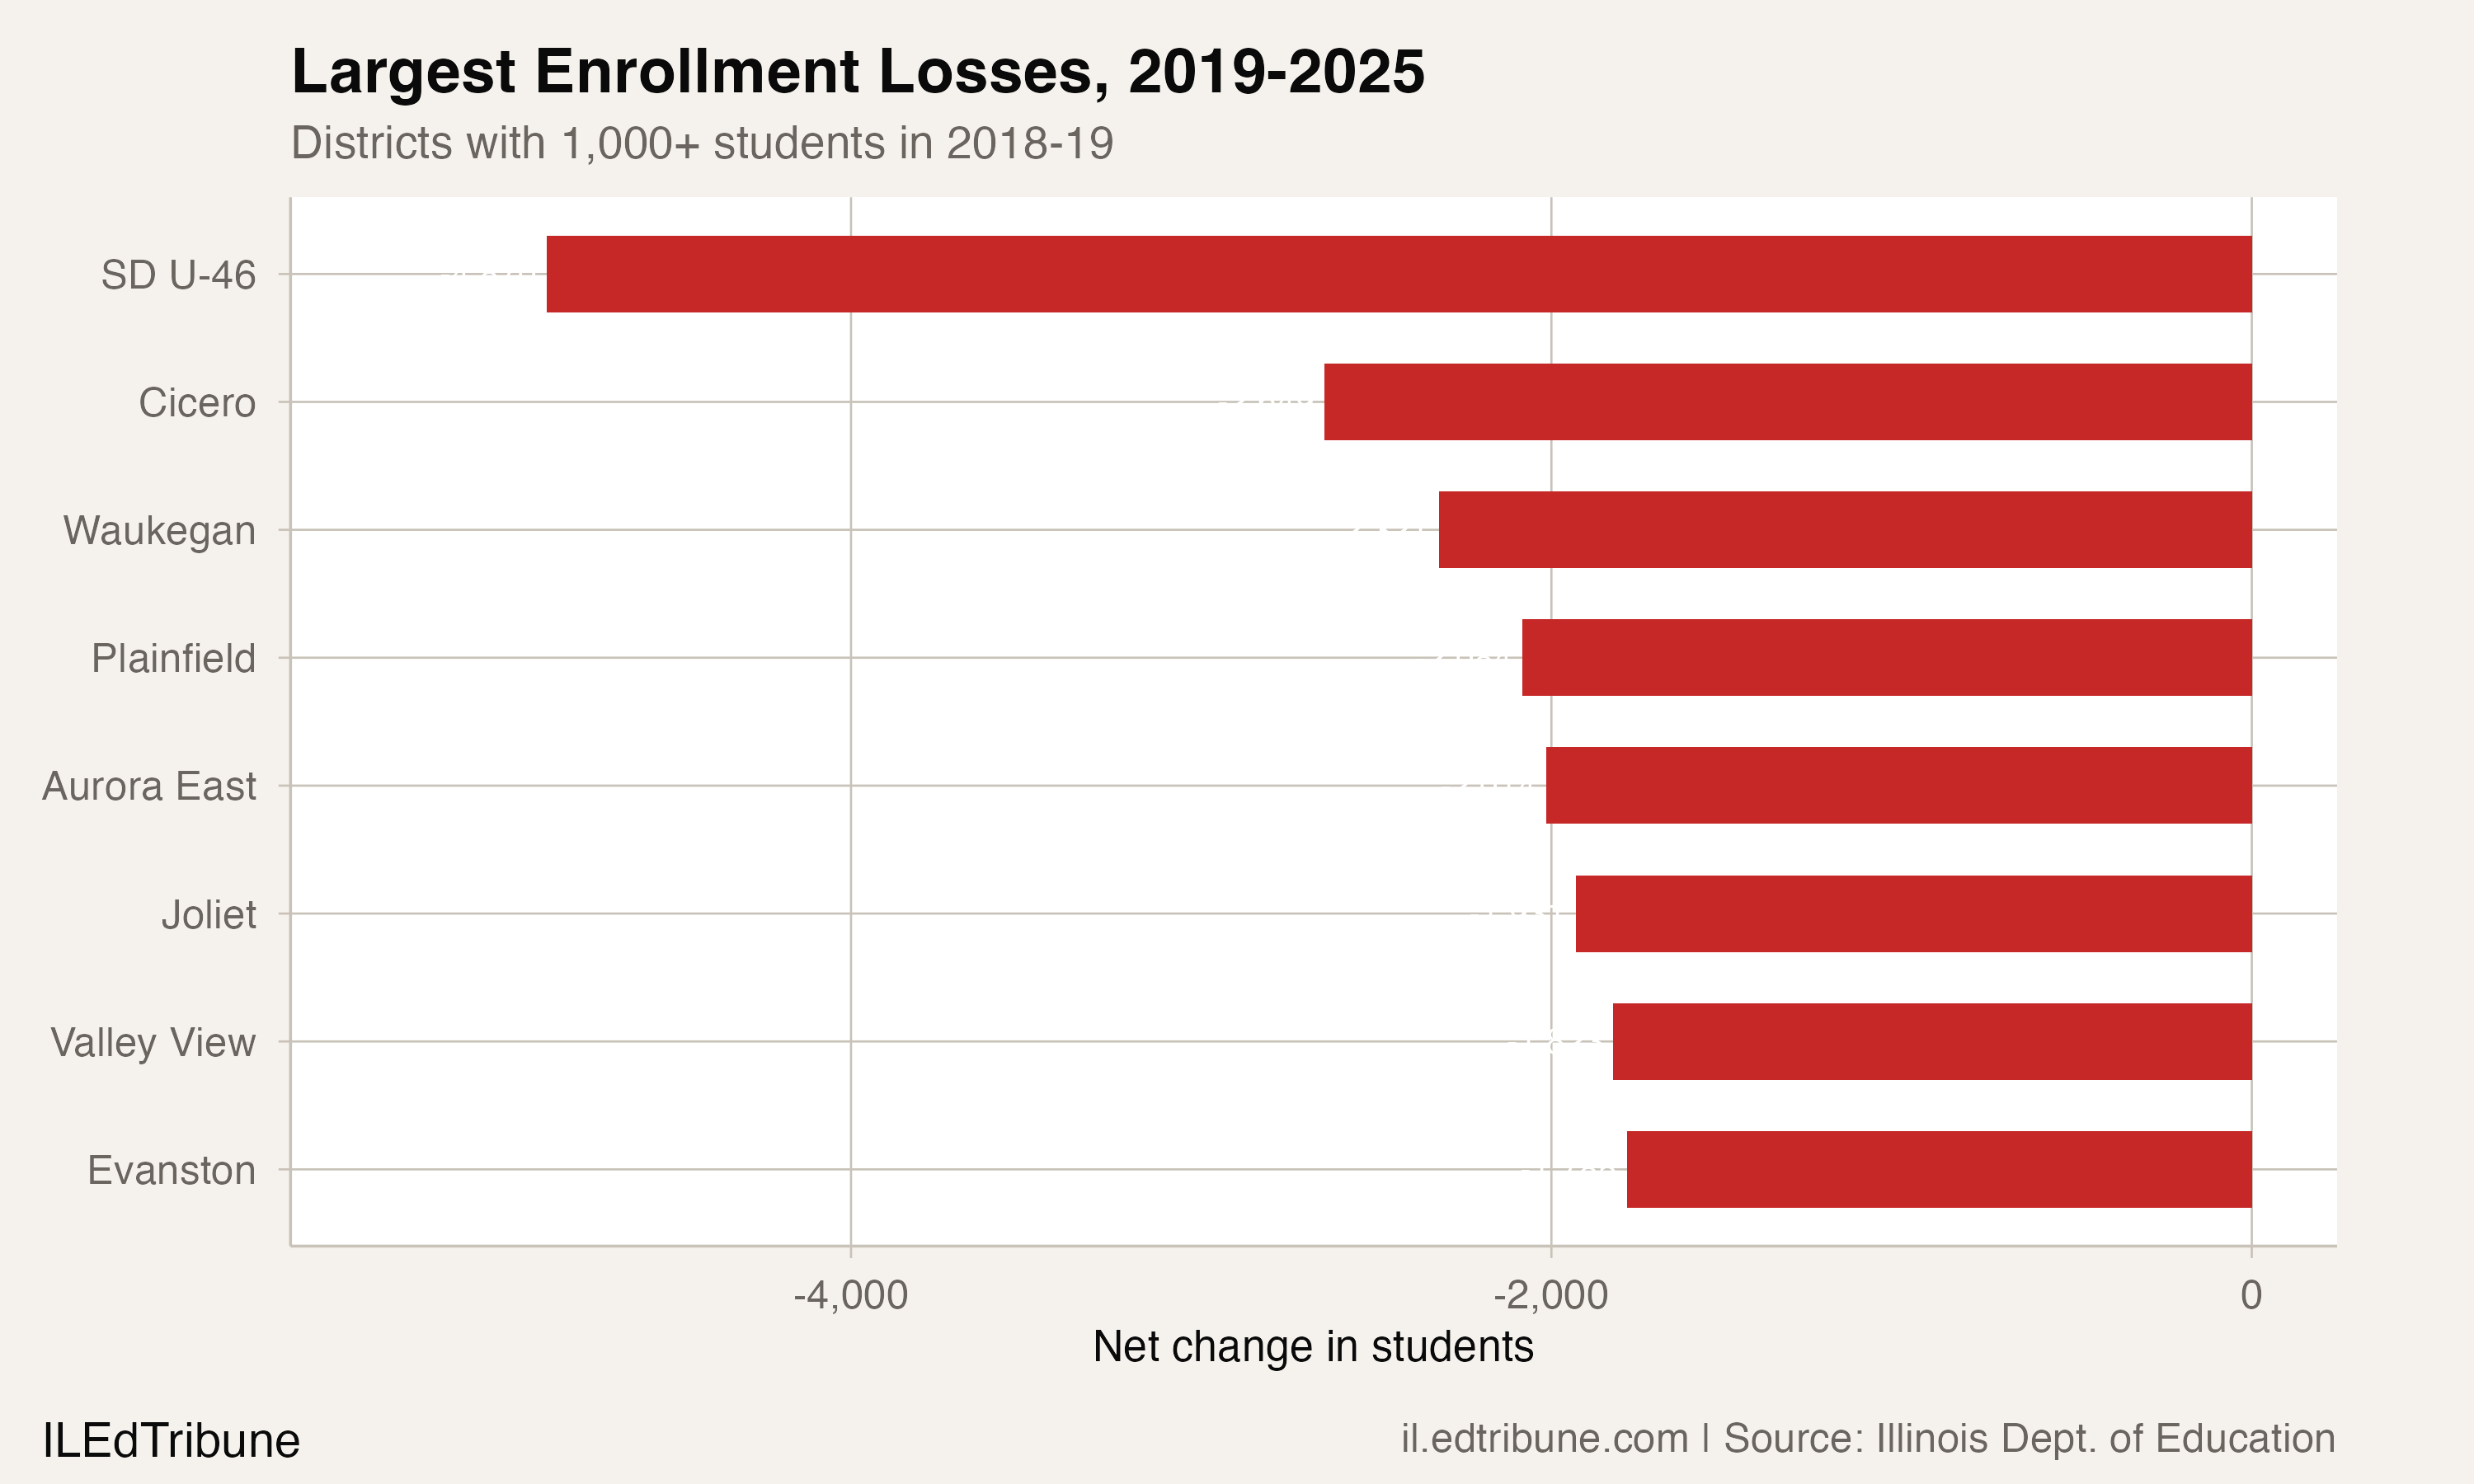
Among 397 districts with at least 1,000 students in 2018-19, 345 had fewer students in 2024-25. Only 52 posted gains. The losses are not evenly distributed geographically. The largest absolute declines are in inner-ring suburban districts:
| District | 2018-19 | 2024-25 | Change |
|---|---|---|---|
| SD U-46 (Elgin) | 38,395 | 33,525 | -4,870 |
| Cicero SD 99 | 11,270 | 8,621 | -2,649 |
| Waukegan CUSD 60 | 15,872 | 13,551 | -2,321 |
| Plainfield SD 202 | 26,495 | 24,411 | -2,084 |
| Aurora East USD 131 | 14,057 | 12,043 | -2,014 |
| Joliet PSD 86 | 11,226 | 9,295 | -1,931 |
| Evanston CCSD 65 | 7,832 | 6,047 | -1,785 |
SD U-46, the state's second-largest district, lost 4,870 students. Cicero SD 99 lost nearly a quarter of its enrollment. Evanston CCSD 65, serving one of the state's most affluent north suburban communities, lost 1,785 students — a 22.8% decline. The losses are not just demographic shifts in who attends. They are fiscal contractions that reduce state funding and force decisions about which buildings to close and which programs to cut.
The 52 gaining districts are overwhelmingly in the exurban ring: Yorkville (+778), Central CUSD 301 (+666), Manhattan (+411). They are communities where new subdivisions are being built, absorbing families from the shrinking inner suburbs. Their gains are real but modest — the 52 gaining districts combined added roughly 7,000 students, exceeding what SD U-46 alone lost but still a fraction of the statewide decline.
The racial composition keeps shifting
The statewide racial composition has changed steadily across the six-year period:
| Group | 2018-19 | 2024-25 | Change | Share Shift |
|---|---|---|---|---|
| White | 944,631 | 818,912 | -125,719 | -3.3 pp |
| Black | 331,415 | 301,315 | -30,100 | -0.4 pp |
| Hispanic | 523,913 | 528,688 | +4,775 | +2.2 pp |
| Asian | 101,210 | 105,368 | +4,158 | +0.6 pp |
| Multiracial | 75,412 | 83,185 | +7,773 | +0.7 pp |
White enrollment fell every year. Black enrollment fell every year. Hispanic enrollment was roughly flat in raw numbers but grew as a share because the denominator shrank. Asian and multiracial students are the only groups growing in both absolute terms and share, but their gains are modest — 4,158 and 7,773 students respectively — and cannot offset losses of 155,819 white and Black students combined.
"White, Black communities lead Illinois population decline; Hispanic, Asian communities growing." — Illinois Policy Institute
The school data mirrors Illinois's broader population trends. White and Black communities have led the state's population decline, while Hispanic and Asian communities have grown. International immigration — 112,000 migrants arrived in recent years — has concentrated in Chicago. Domestic outmigration, meanwhile, has pulled families from every corner of the state. The enrollment data is the school-level expression of that divergence.
For the south suburban districts where the white share has dropped 30 to 38 percentage points in six years, the transformation is both demographic and fiscal. The students arriving need different services — bilingual education, McKinney-Vento supports, newcomer programs — than the students who left. Whether the funding formula, the staffing pipeline, and the buildings can adapt as fast as the student body is changing remains unanswered.
RELATED: Illinois enrollment nears a plateau after losing 136,000 studentsET
Detailed code that reproduces the analysis and figures in this article is available exclusively to EdTribune subscribers.
Discussion
Sign in to join the discussion.
Loading comments...