Township High School District 113, which serves Deerfield and Highland Park on Chicago's affluent North Shore, classified 1,008 of its 3,000 students under special education in 2024-25. That is 33.6% of enrollment, up from 15.1% six years ago. The district more than doubled its special education rate in a period when the state's overall rate rose by less than two percentage points.
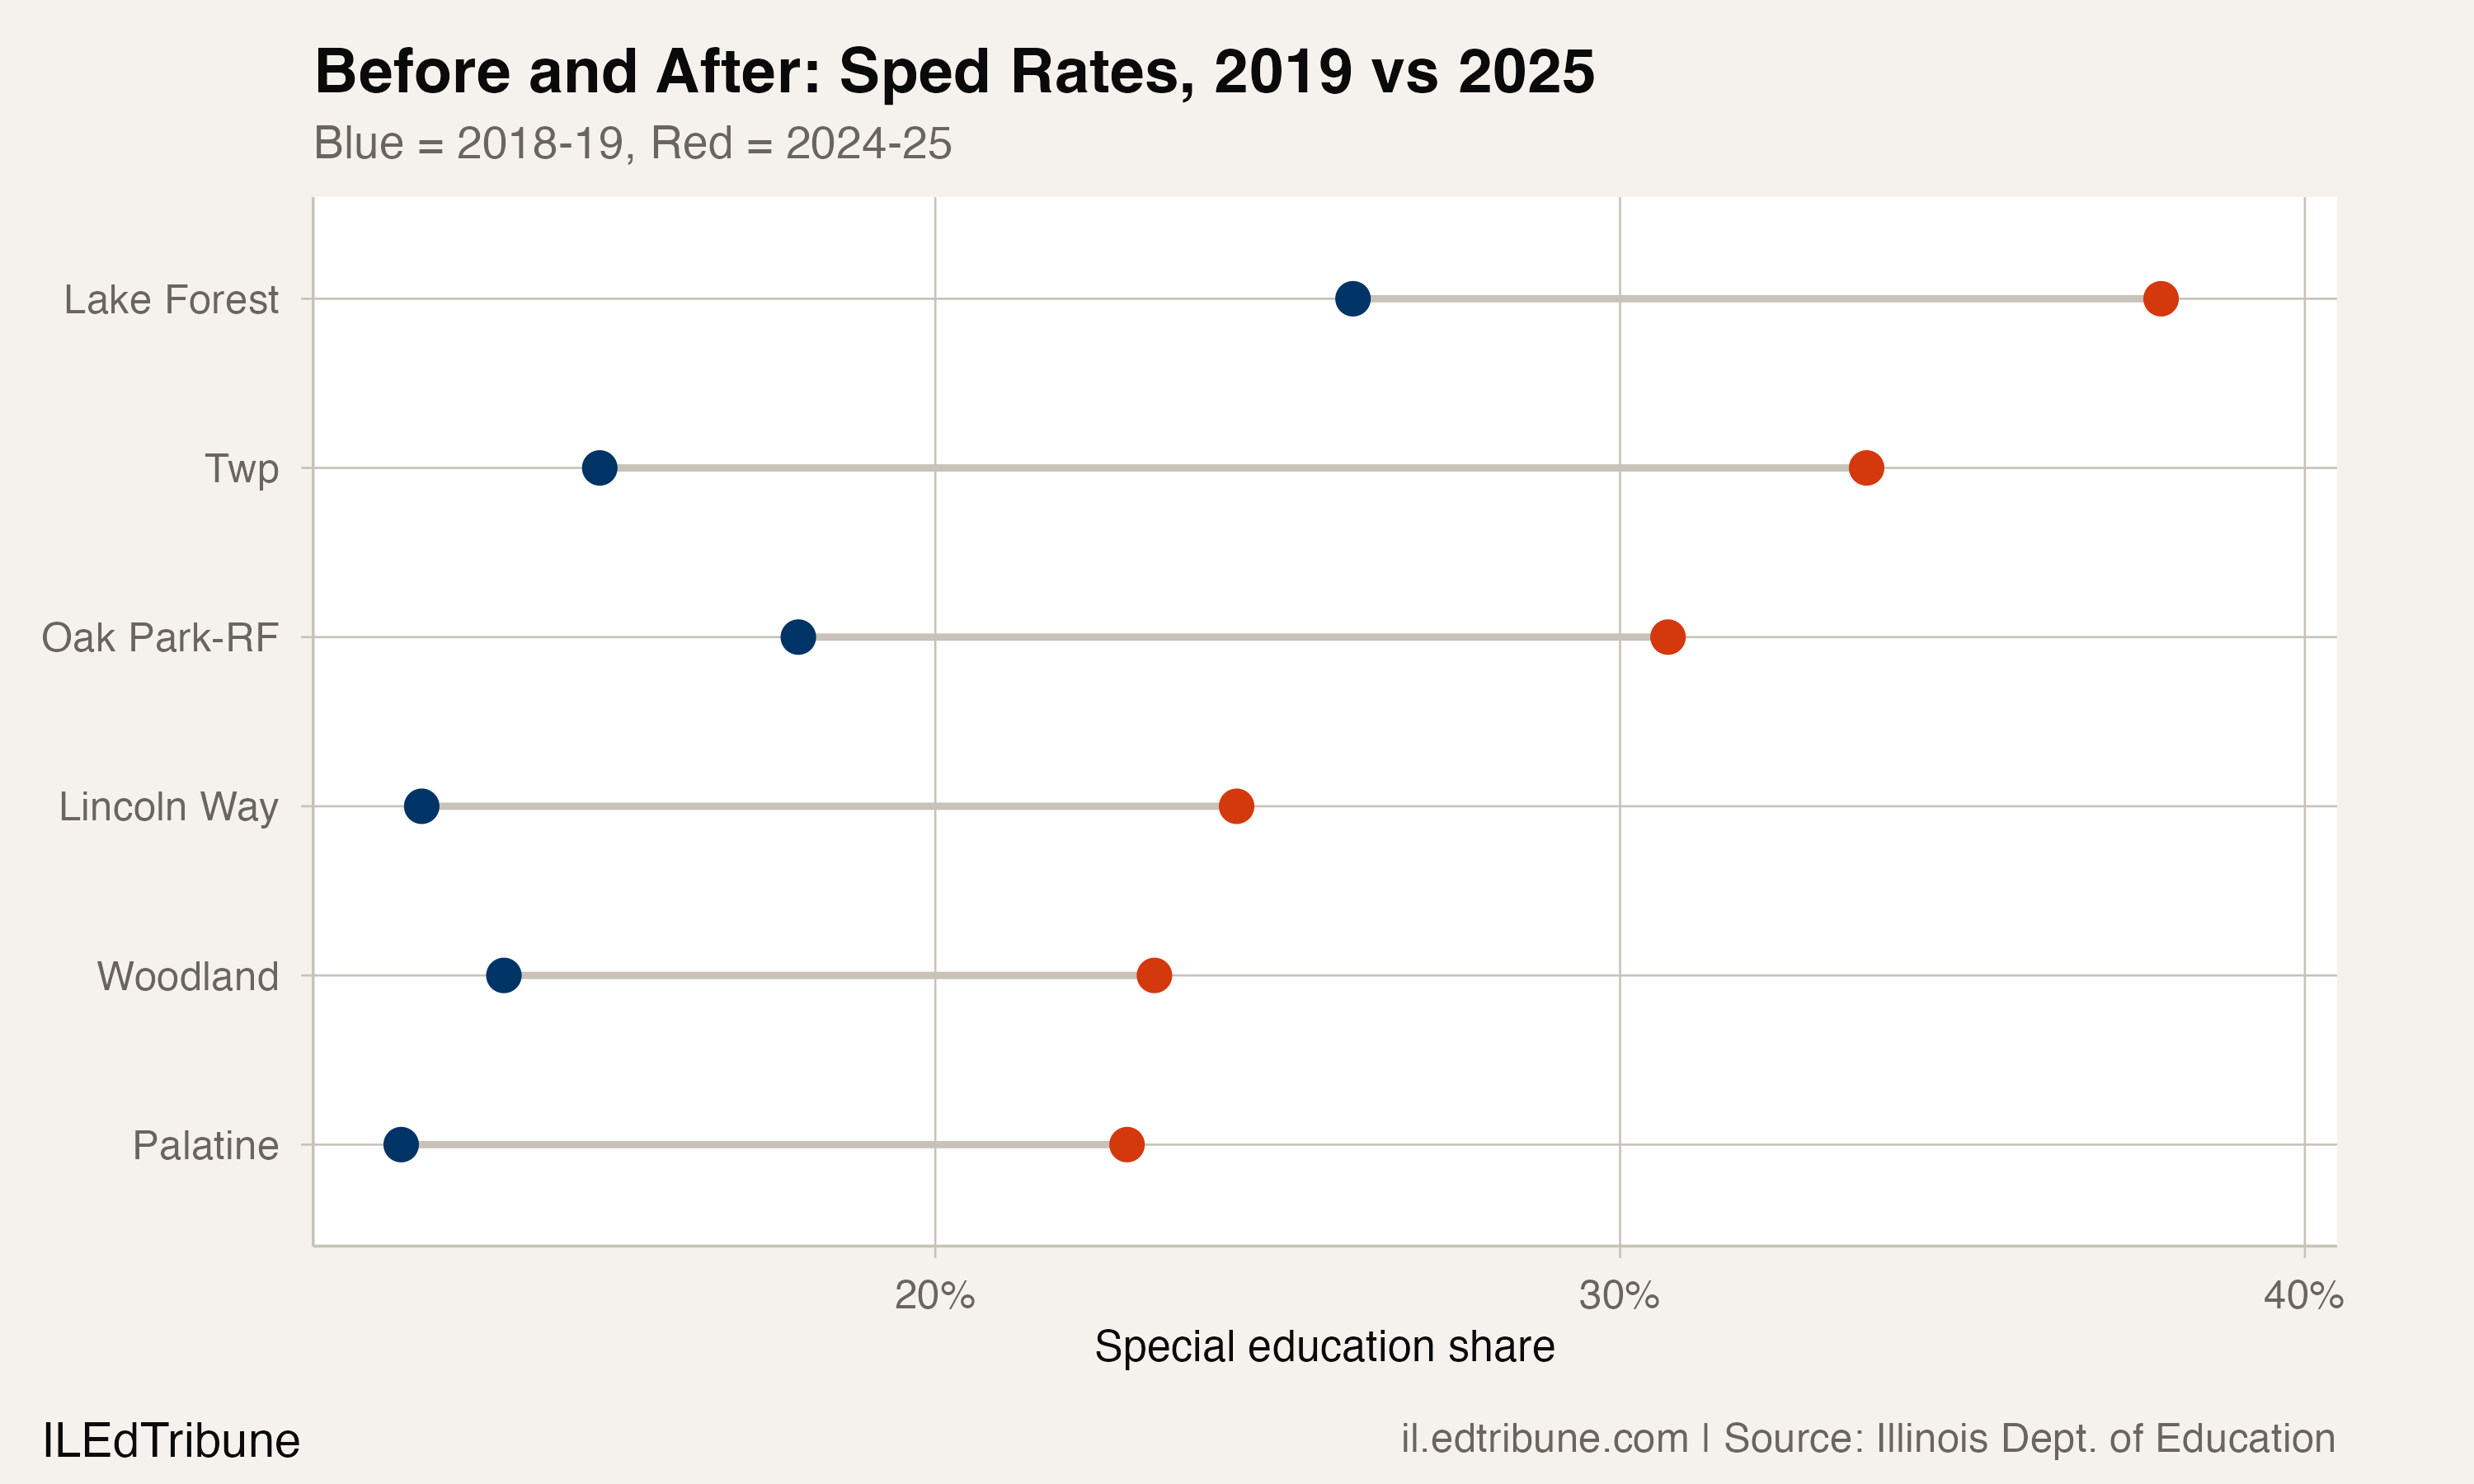
TSD 113 is the most extreme case, but the pattern extends across suburban Chicago. Oak Park-River Forest SD 200 went from 18.0% to 30.7%. Lincoln Way CHSD 210 in Will County climbed from 12.5% to 24.4%. Lake Forest CHSD 115 now classifies 37.9% of its students under special education — more than one in three. These are systems of 1,000 to 6,600 students -- too large for the numbers to be statistical noise. Identification practices appear to have shifted sharply.
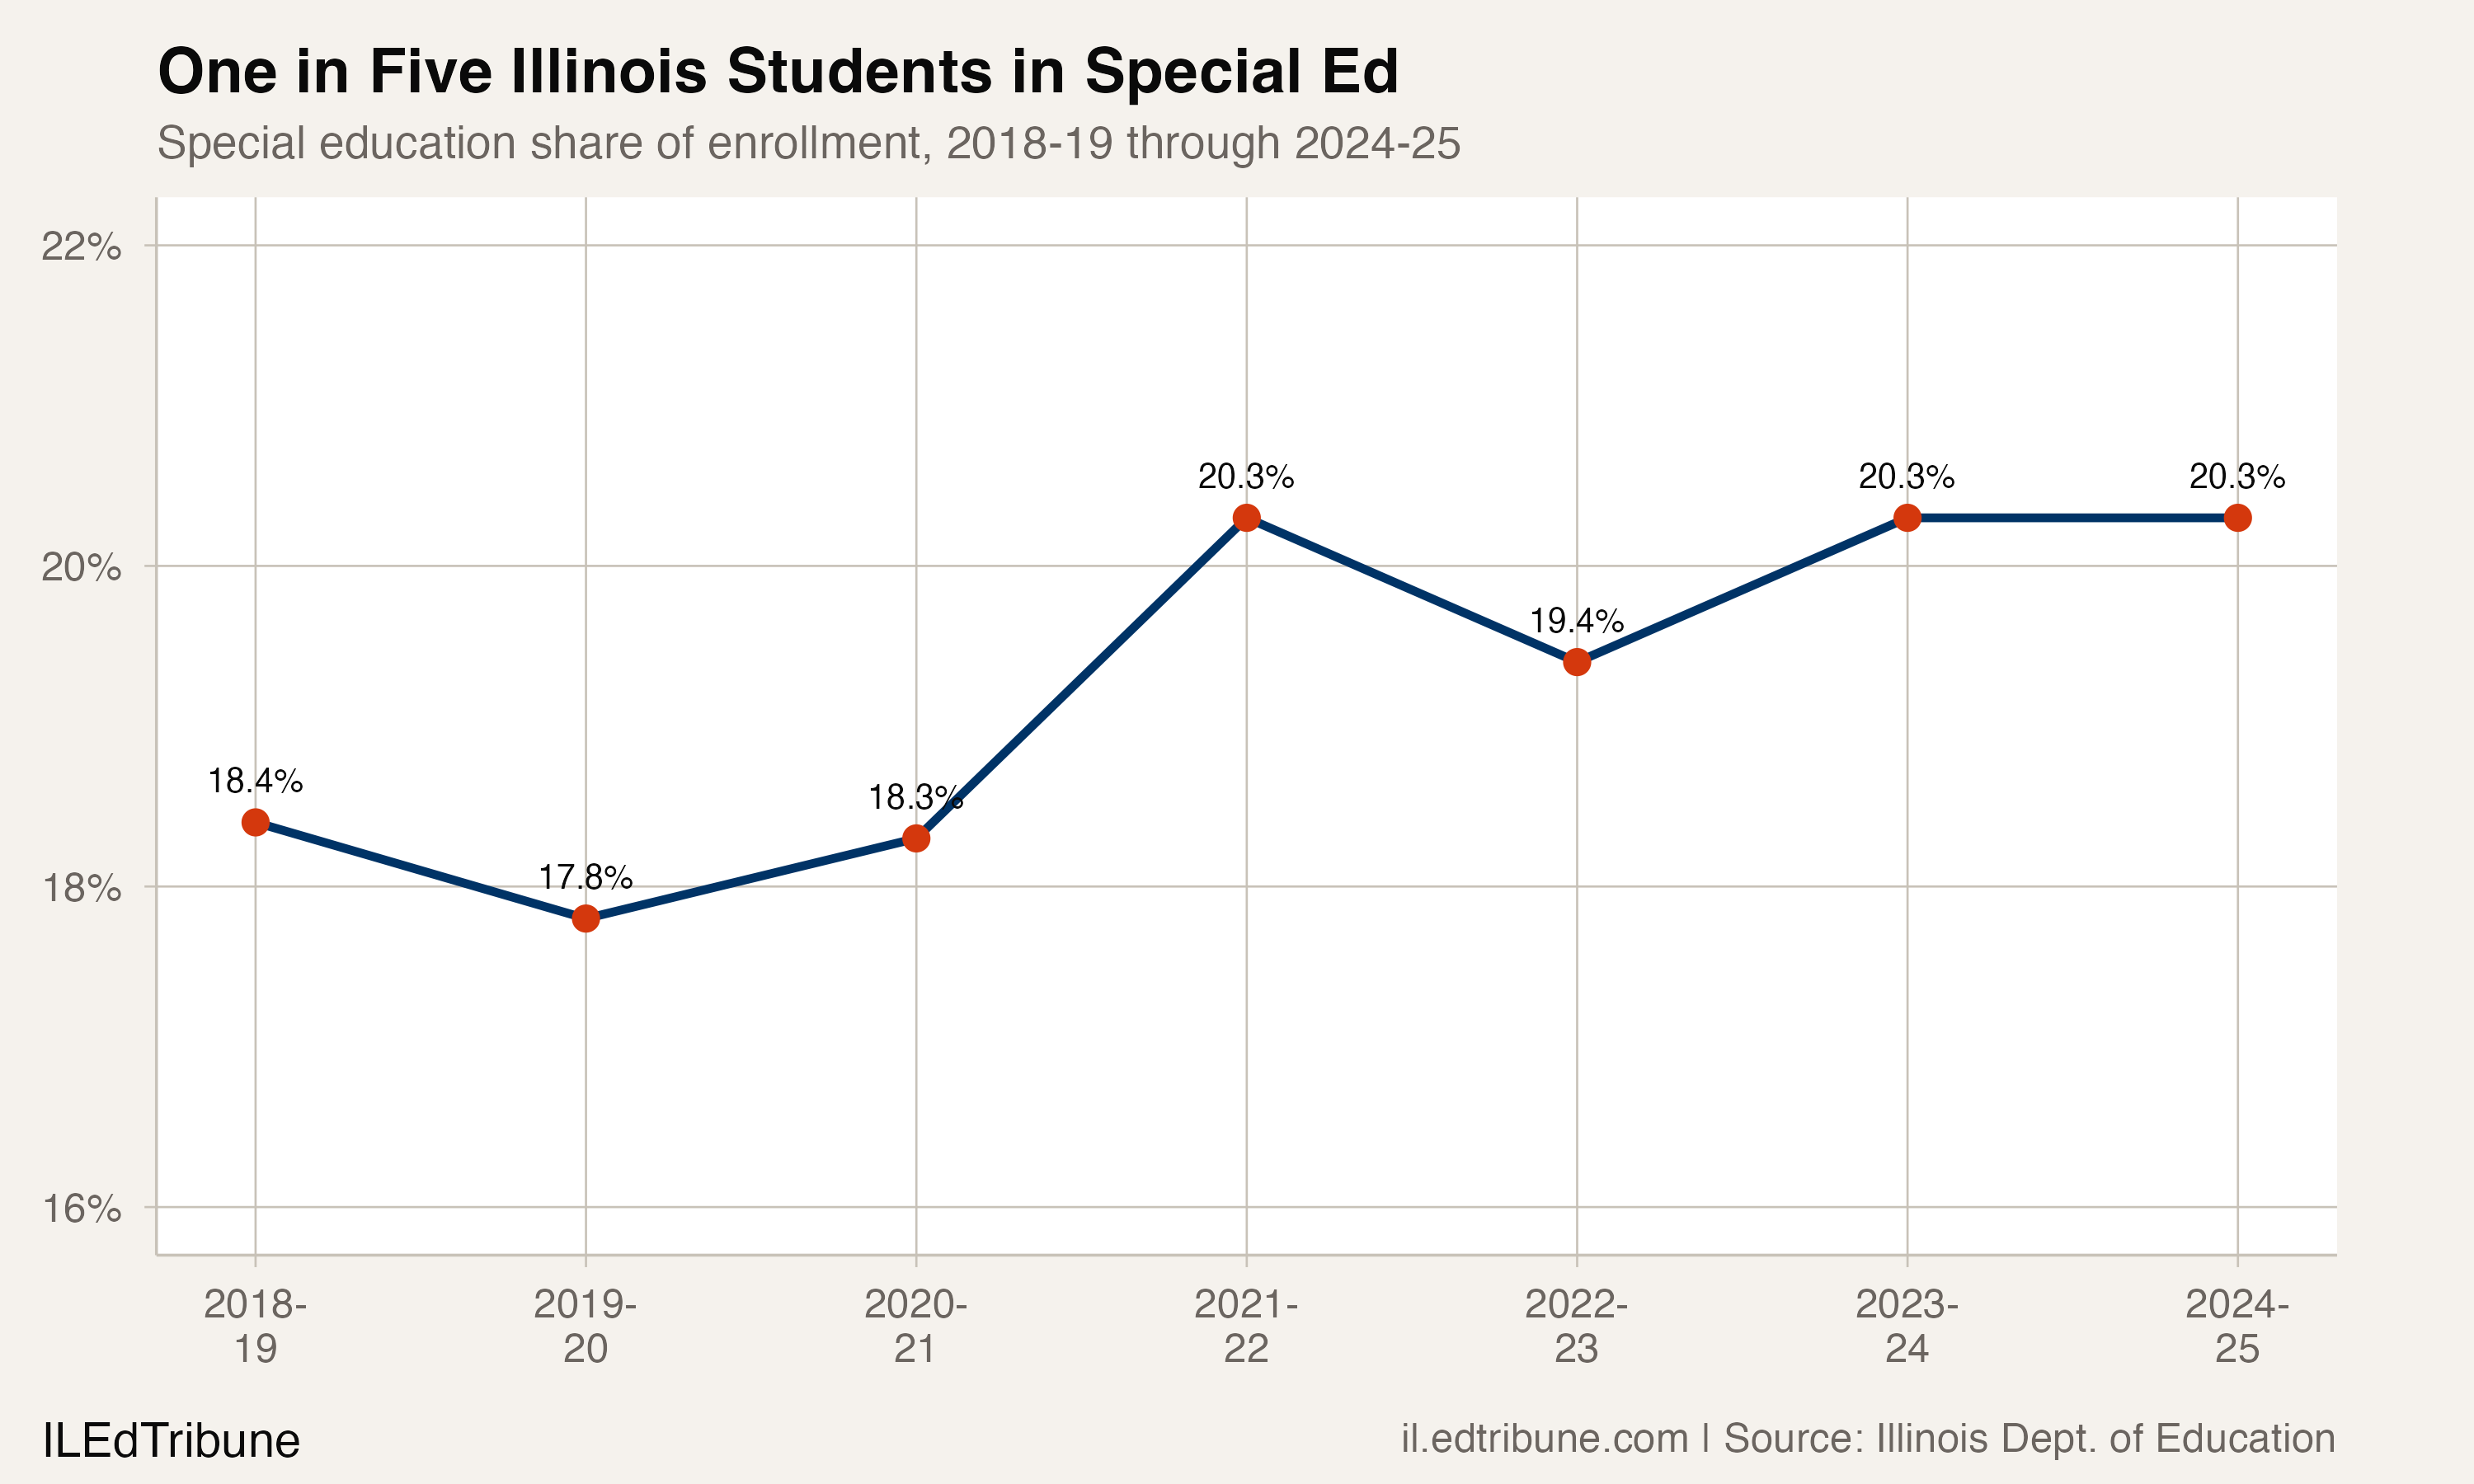
The statewide rate barely moved
Illinois classified 375,258 students as receiving special education services in 2024-25, or 20.3% of total enrollment. That is up from 365,151 students (18.4%) in 2018-19 — a 1.9 percentage-point increase over six years. The path was not smooth. Special education counts dropped during the pandemic as remote learning disrupted evaluations, surged to 379,473 in 2021-22, dropped again to 360,411 in 2022-23, and settled near 375,000 for the past two years.
| Year | Sped Students | Sped Rate | Year-over-Year Change |
|---|---|---|---|
| 2018-19 | 365,151 | 18.4% | — |
| 2019-20 | 348,349 | 17.8% | -16,802 |
| 2020-21 | 345,379 | 18.3% | -2,970 |
| 2021-22 | 379,473 | 20.3% | +34,094 |
| 2022-23 | 360,411 | 19.4% | -19,062 |
| 2023-24 | 375,812 | 20.3% | +15,401 |
| 2024-25 | 375,258 | 20.3% | -554 |
The statewide rate has stabilized at 20.3% for three consecutive years, suggesting Illinois may have reached a new baseline. One in five students statewide now receives special education services. But the districts driving the biggest shifts are concentrated in the suburbs, not spread evenly across the state.
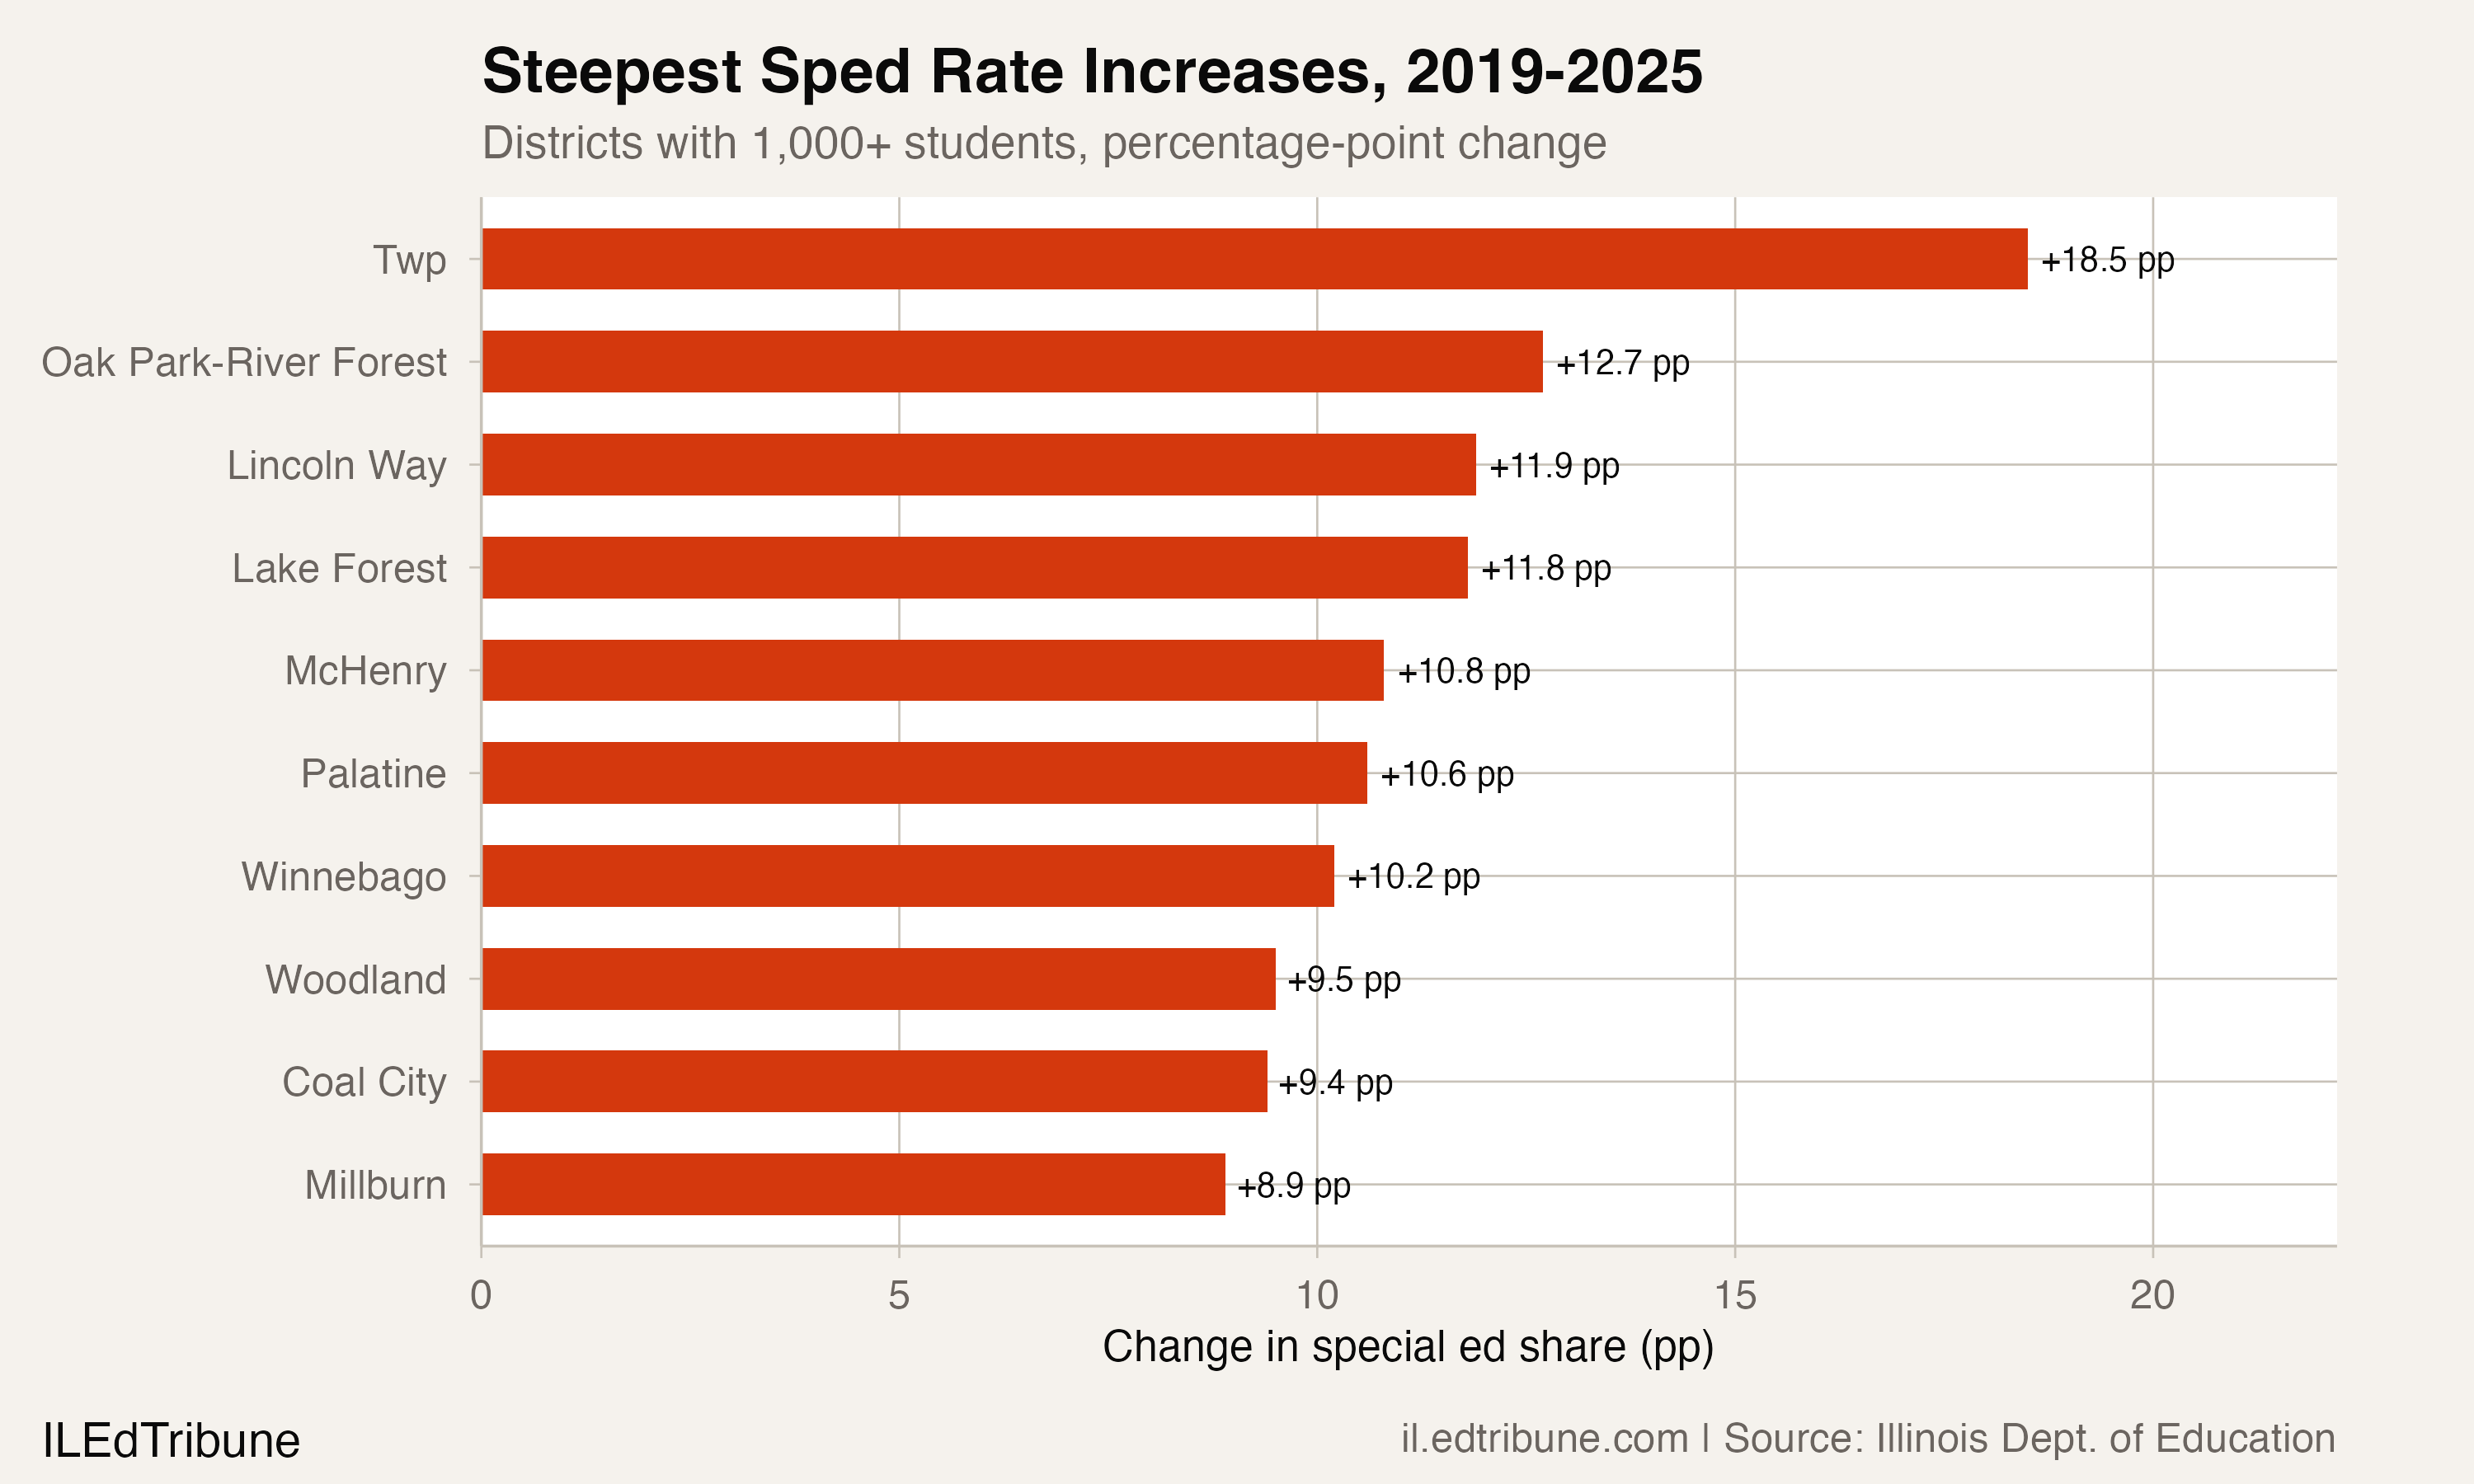
Suburban districts where rates doubled
The ten districts with the steepest rate increases since 2018-19, filtered to those with at least 1,000 students, are all in the collar counties or near-suburban ring:
| District | 2019 Sped | 2025 Sped | Rate 2019 | Rate 2025 | Change |
|---|---|---|---|---|---|
| Twp HSD 113 | 555 | 1,008 | 15.1% | 33.6% | +18.5 pp |
| Oak Park-River Forest SD 200 | 623 | 1,006 | 18.0% | 30.7% | +12.7 pp |
| Lincoln Way CHSD 210 | 865 | 1,620 | 12.5% | 24.4% | +11.9 pp |
| Lake Forest CHSD 115 | 418 | 511 | 26.1% | 37.9% | +11.8 pp |
| McHenry CHSD 156 | 328 | 564 | 15.0% | 25.8% | +10.8 pp |
| Palatine CCSD 15 | 1,510 | 2,565 | 12.2% | 22.8% | +10.6 pp |
| Winnebago CUSD 323 | 230 | 333 | 16.8% | 27.0% | +10.2 pp |
| Woodland CCSD 50 | 740 | 1,050 | 13.7% | 23.2% | +9.5 pp |
| Coal City CUSD 1 | 308 | 498 | 14.1% | 23.5% | +9.4 pp |
| Millburn CCSD 24 | 170 | 262 | 15.0% | 23.9% | +8.9 pp |
Palatine CCSD 15 posted the largest absolute increase, adding 1,055 students to reach 2,565. Lincoln Way CHSD 210 added 755. Numbers that large are not rounding errors. Each additional IEP-classified student requires specialized instruction, related services, and compliance documentation.
Several of the districts with the steepest increases serve affluent communities where parents have the resources to pursue private evaluations and advocate for services. The increases could reflect better identification of students who were always there, greater parent awareness and advocacy, changes in evaluation thresholds, a genuine increase in student need, or some mix of all four. The enrollment data alone cannot untangle those causes. But the scale at TSD 113 and Lake Forest suggests something beyond demographic drift.
TSD 113: a case study in rapid change
TSD 113's trajectory is unlike any other district in the state. In 2018-19, the district identified 555 students (15.1%) for special education. By 2021-22, that number had nearly doubled to 1,059 (32.9%). It dropped to 761 in 2022-23, then climbed back above 1,000 for each of the past two years.
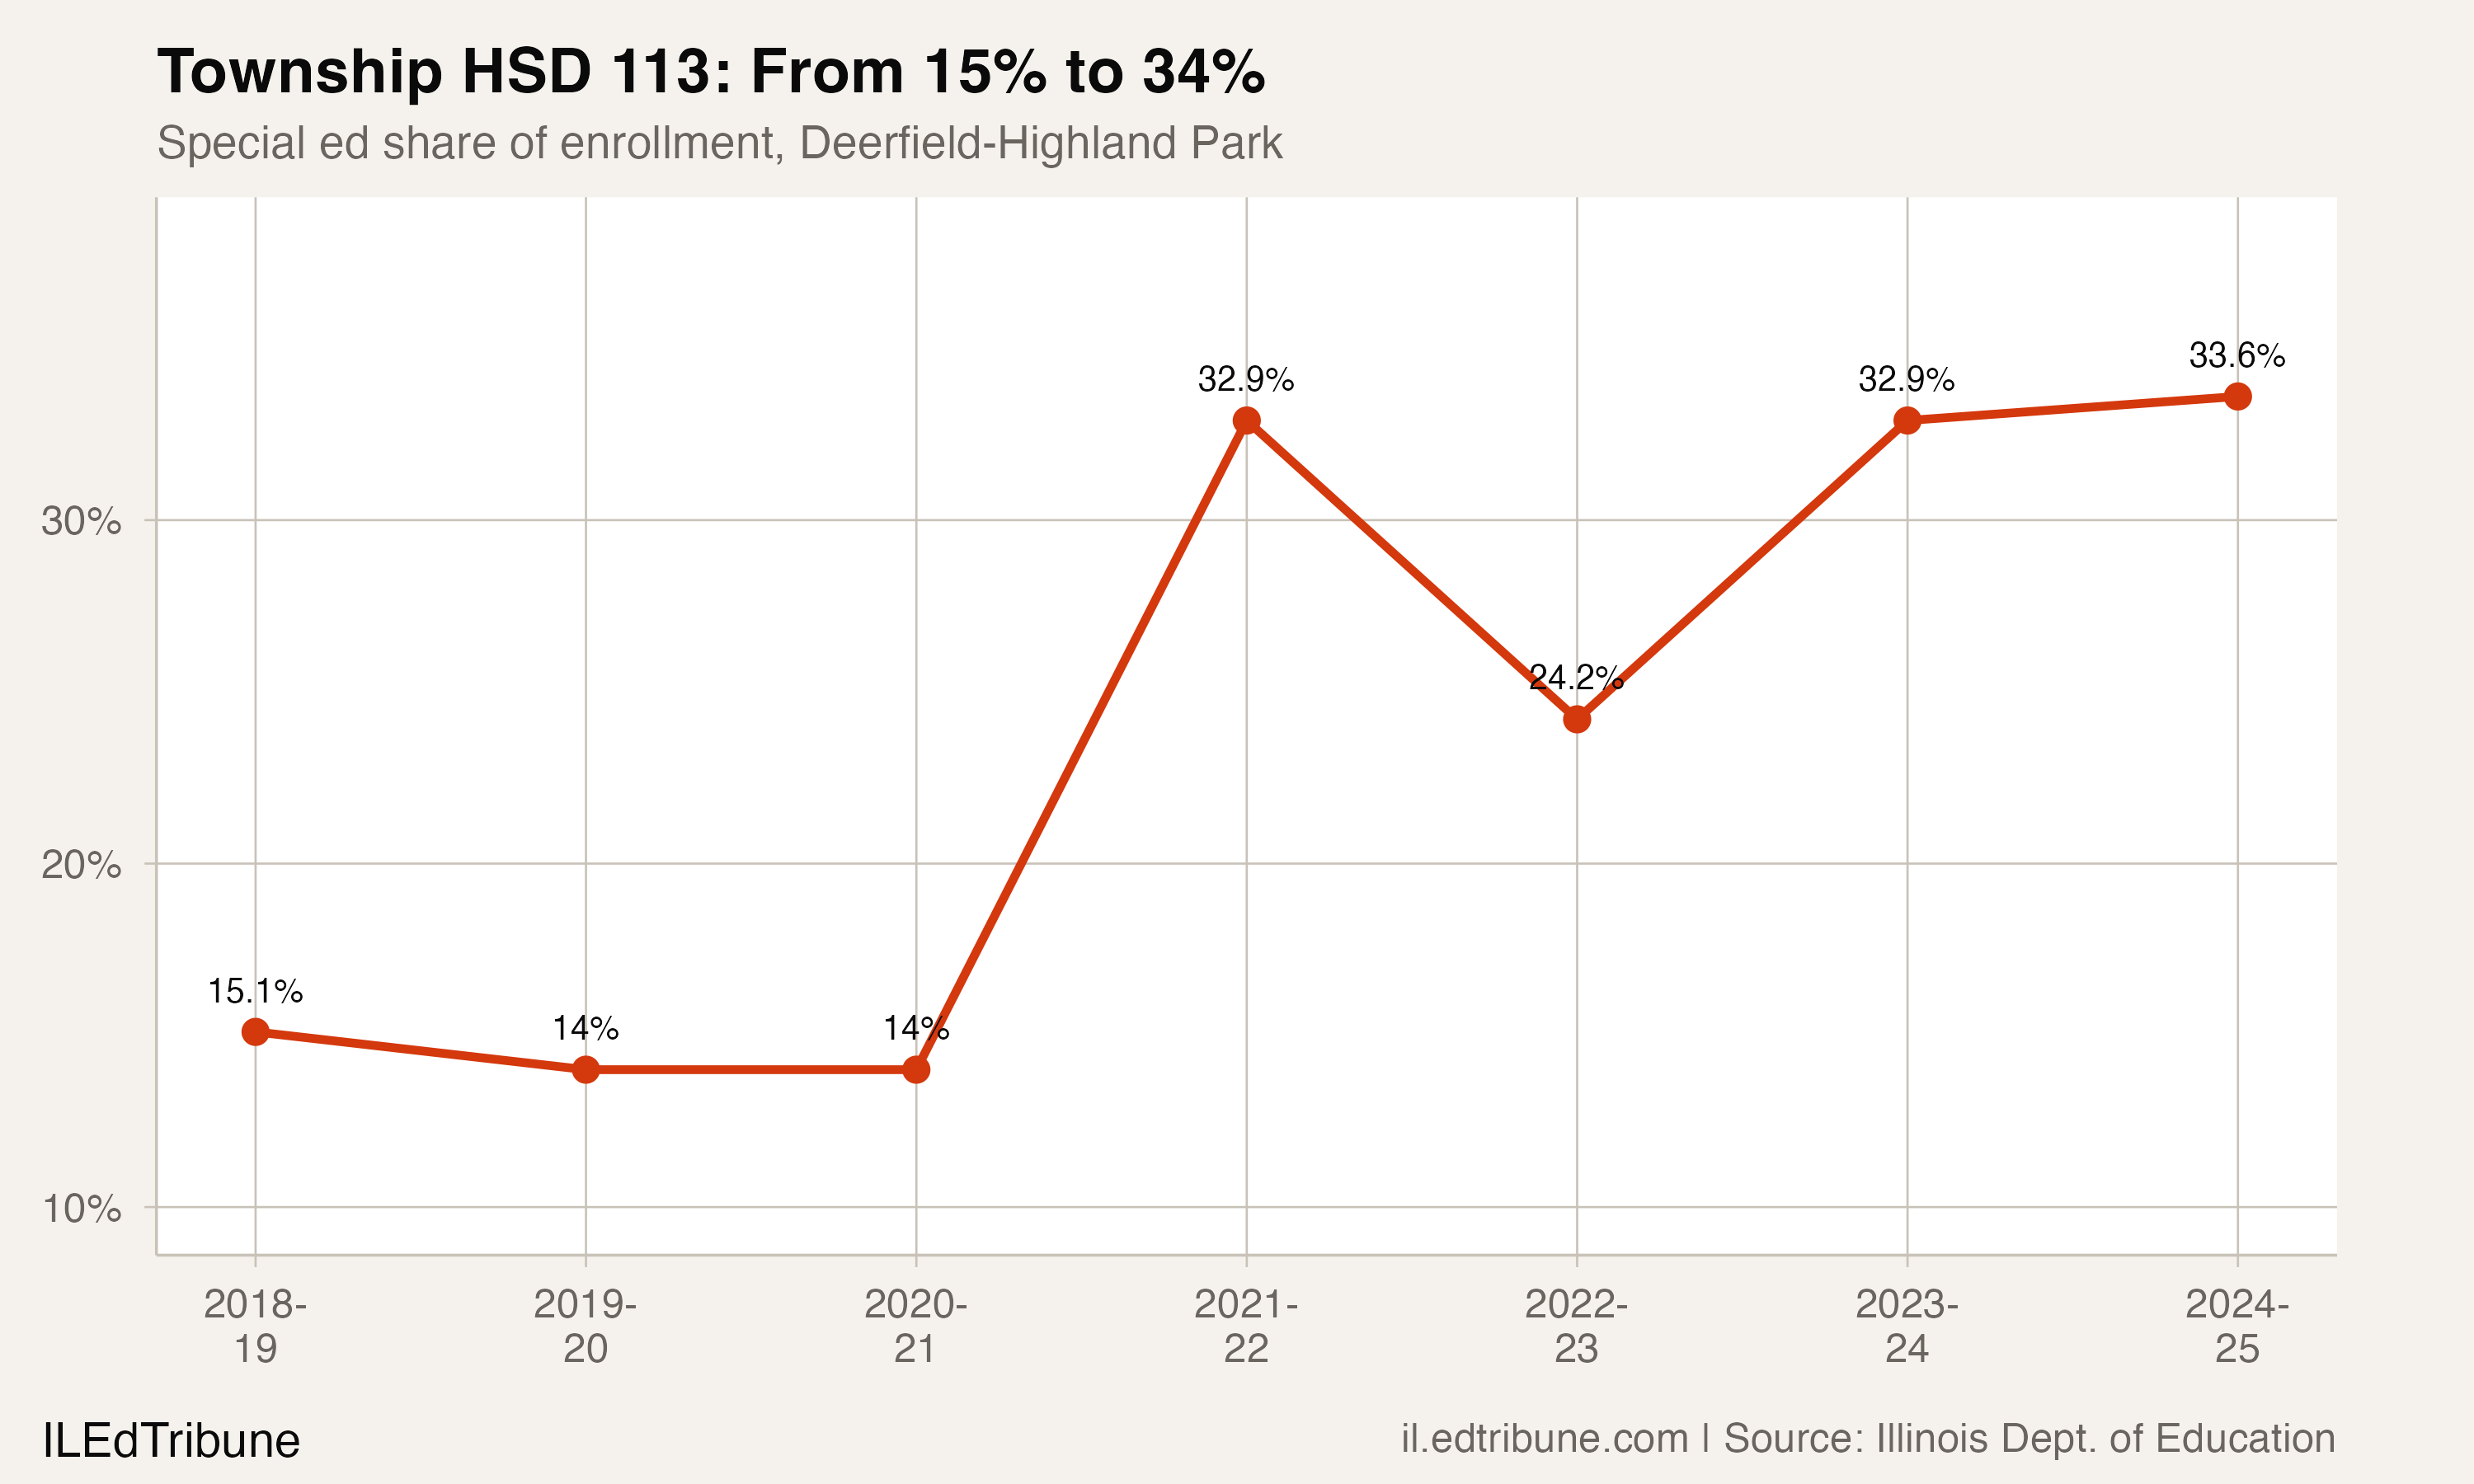
The volatility is striking. A district does not go from identifying 555 students to 1,059 in three years and then drop to 761 the next year because of changes in the student population. These swings are more consistent with changes in identification practices, evaluation capacity, or classification thresholds. The district's total enrollment declined steadily from 3,677 to 3,000 over the period, meaning the rate increase reflects both more students being classified and a shrinking denominator.
TSD 113 serves two communities — Deerfield and Highland Park — with median household incomes well above the state average. The district's experience may illustrate a dynamic that education researchers have documented: affluent communities where families have greater access to private neuropsychological evaluations, attorneys, and advocates tend to have higher identification rates for disabilities like specific learning disabilities, autism spectrum disorder, and other health impairments.
1,360 special education vacancies and counting
Higher identification rates carry direct fiscal and staffing consequences. Under Illinois law, districts receive additional state funding for students with IEPs, but the costs of mandated services — specialized instruction, speech and occupational therapy, aides, and out-of-district placements — typically exceed the supplemental revenue.
The staffing pipeline is not keeping up. Of the roughly 4,000 unfilled teaching positions in Illinois, 1,360 were for special education teachers — more than a third of the total. Over 80% of districts reported receiving few or no qualified applicants for open positions, and of those who did apply, fewer than half were qualified.
"We still have an overwhelming majority of educational leaders in the state that feel like the problem is persistent." — Gary Tipsord, Illinois Association of Regional Superintendents of Schools, Chalkbeat, Mar. 2025
The state created a $45 million Teacher Vacancy Grant program to help 170 districts fill positions, and Governor Pritzker's fiscal year 2026 budget includes another $45 million for the program. The grants have helped hire about 5,400 new educators and retain 11,000 additional teachers statewide. But the mismatch between the pace of identification growth in suburban districts and the supply of certified special education staff shows no sign of closing. Districts that identified one in eight students five years ago now identify one in four. The workforce has not grown to match.
RELATED: Illinois enrollment nears a plateau after losing 136,000 studentsET
Detailed code that reproduces the analysis and figures in this article is available exclusively to EdTribune subscribers.
Discussion
Sign in to join the discussion.
Loading comments...