Of 822 Illinois districts with comparable attendance data before and after the pandemic, exactly 23 have returned to their pre-COVID chronic absenteeism rates. That is 2.8%. Three years after the 2021-22 peak, the recovery that everyone expected has barely registered.
The other 799 districts, 97.2% of the state, remain above where they started. The average district is carrying 11.0 percentage points of excess chronic absenteeism compared to its pre-pandemic rate. For a district that was at 10% before COVID, that means roughly one in five students is now chronically absent. For a district already at 25%, it means more than one in three.
The scatter tells the story
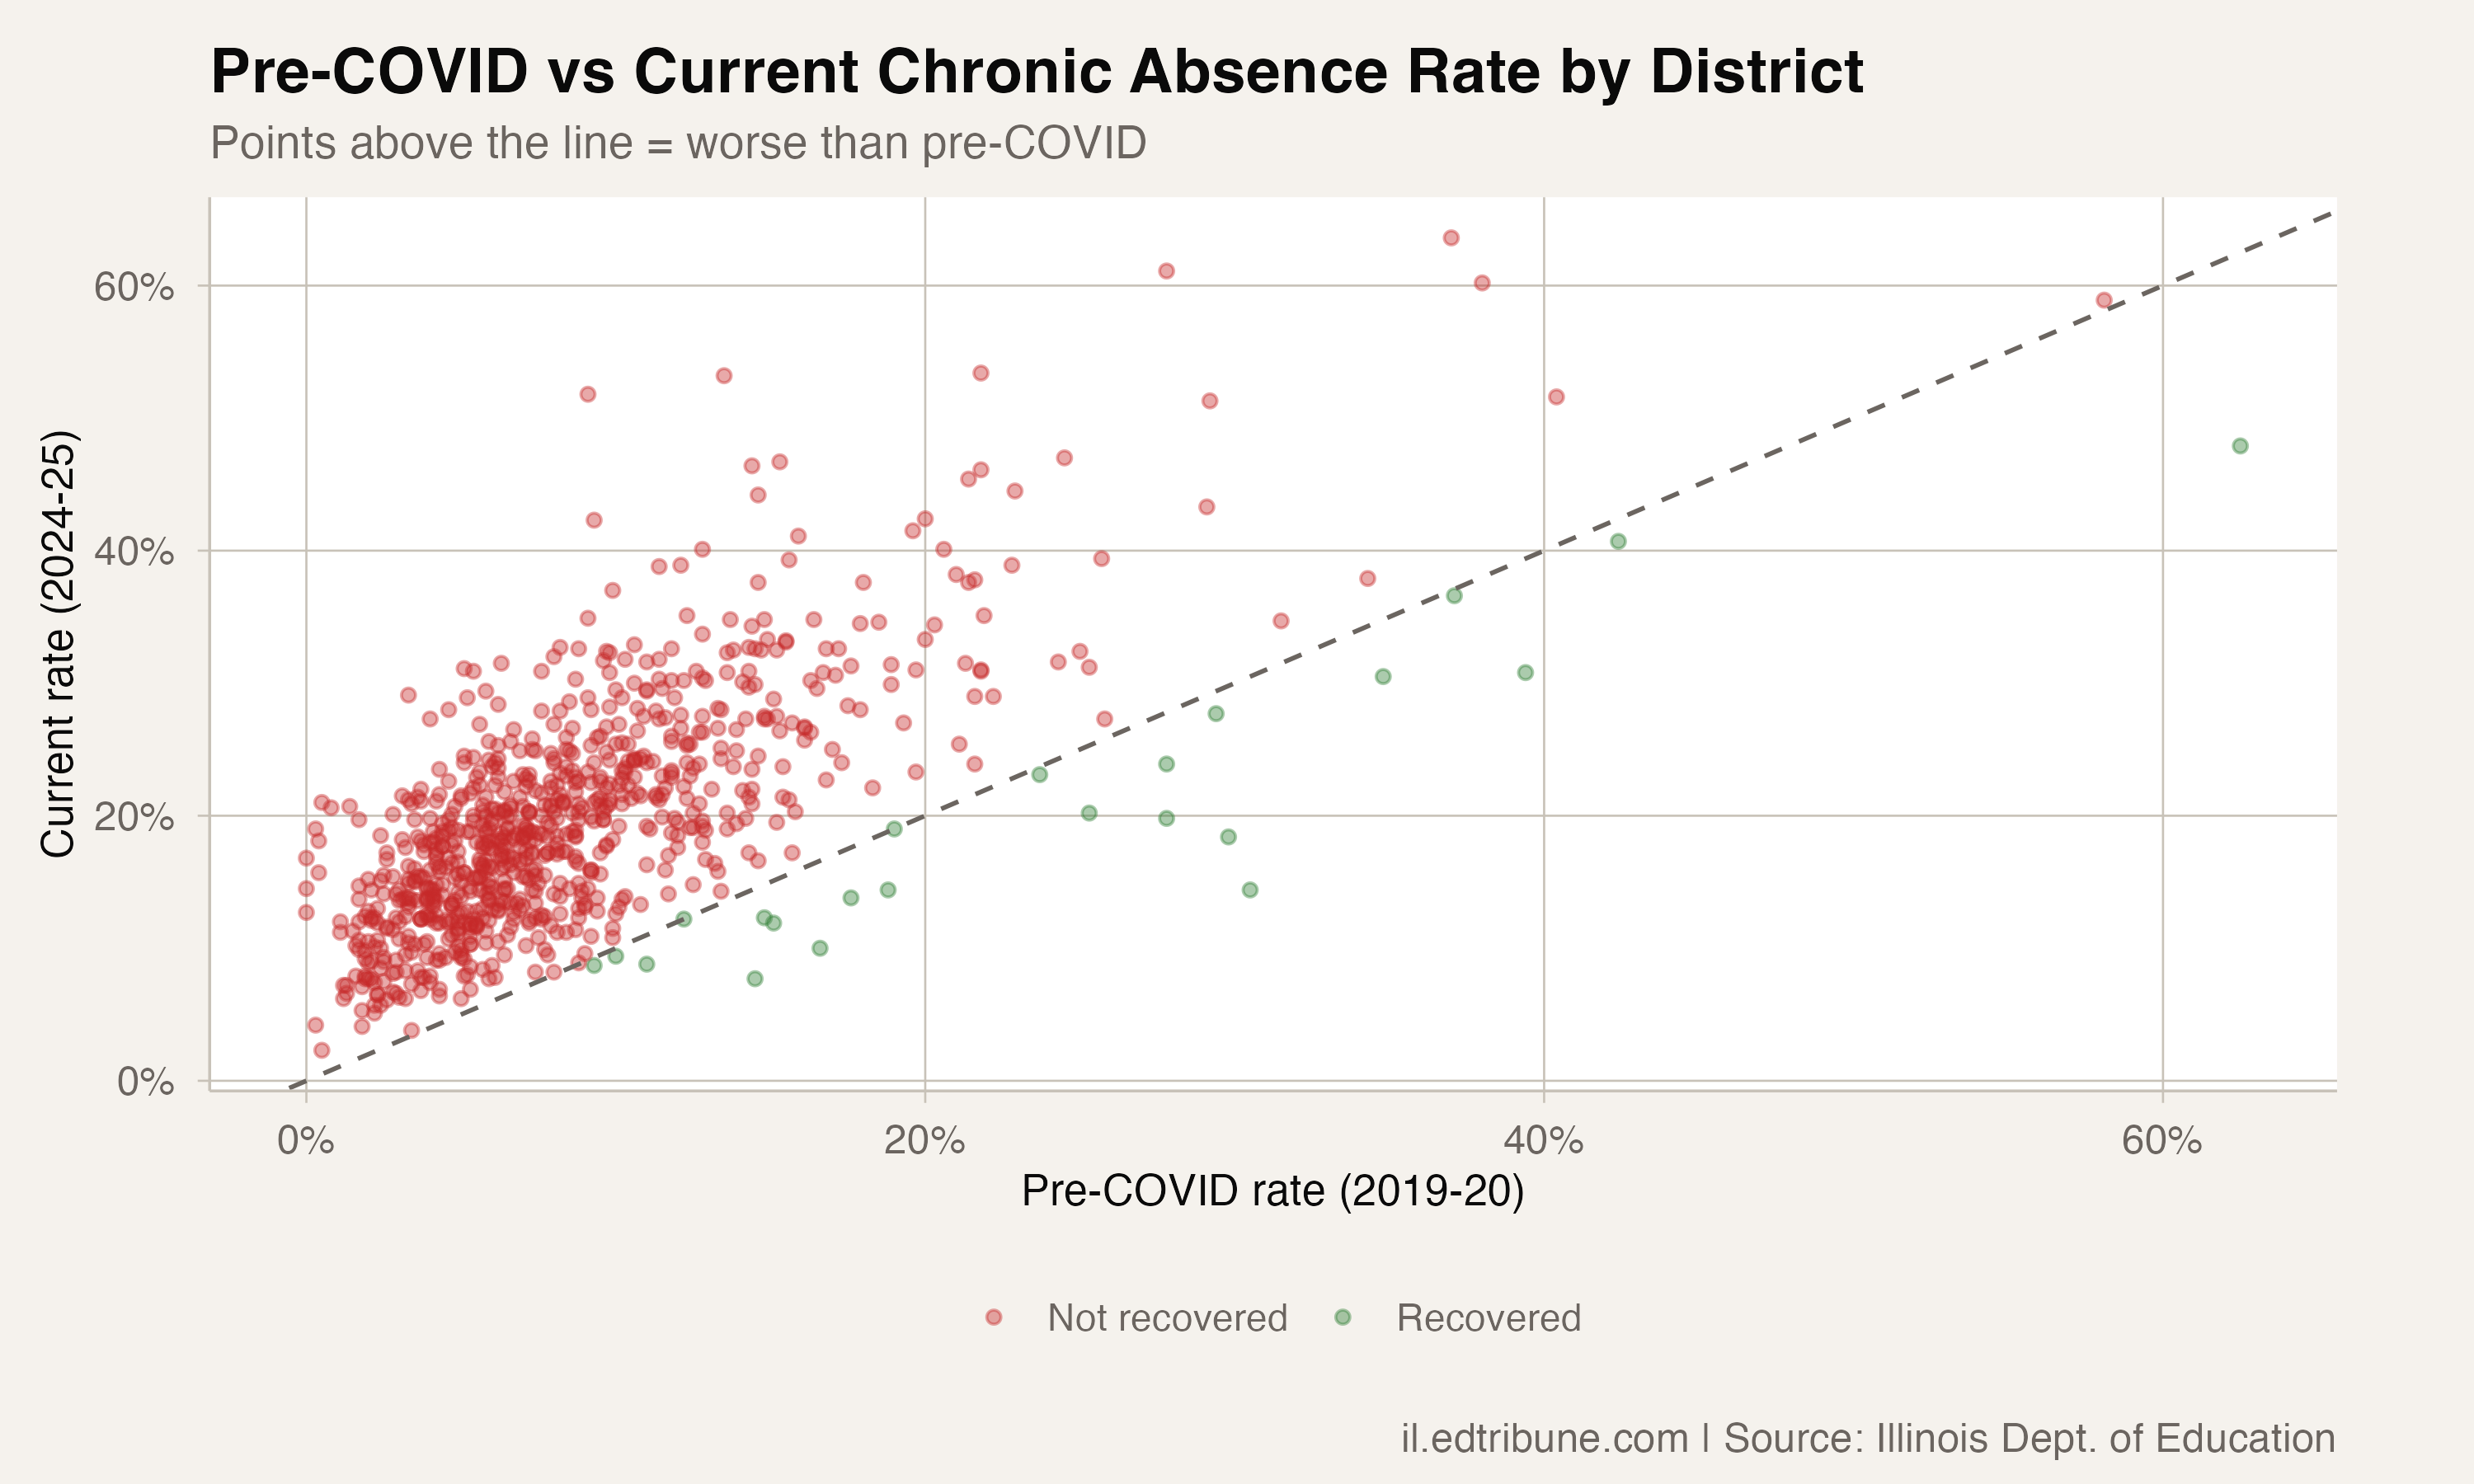
The scatter plot reveals the scale of the problem. The dashed line marks parity: districts on it have fully recovered. Districts above it are worse off than before the pandemic. Nearly every dot in the state sits above that line.
Districts that had low pre-COVID rates (under 10%) now cluster around 15-20%. Districts that were already elevated (15-25%) have settled in the 25-40% range. The pandemic did not flatten the distribution; it shifted the entire curve upward and stretched it wider.
Where the excess is concentrated
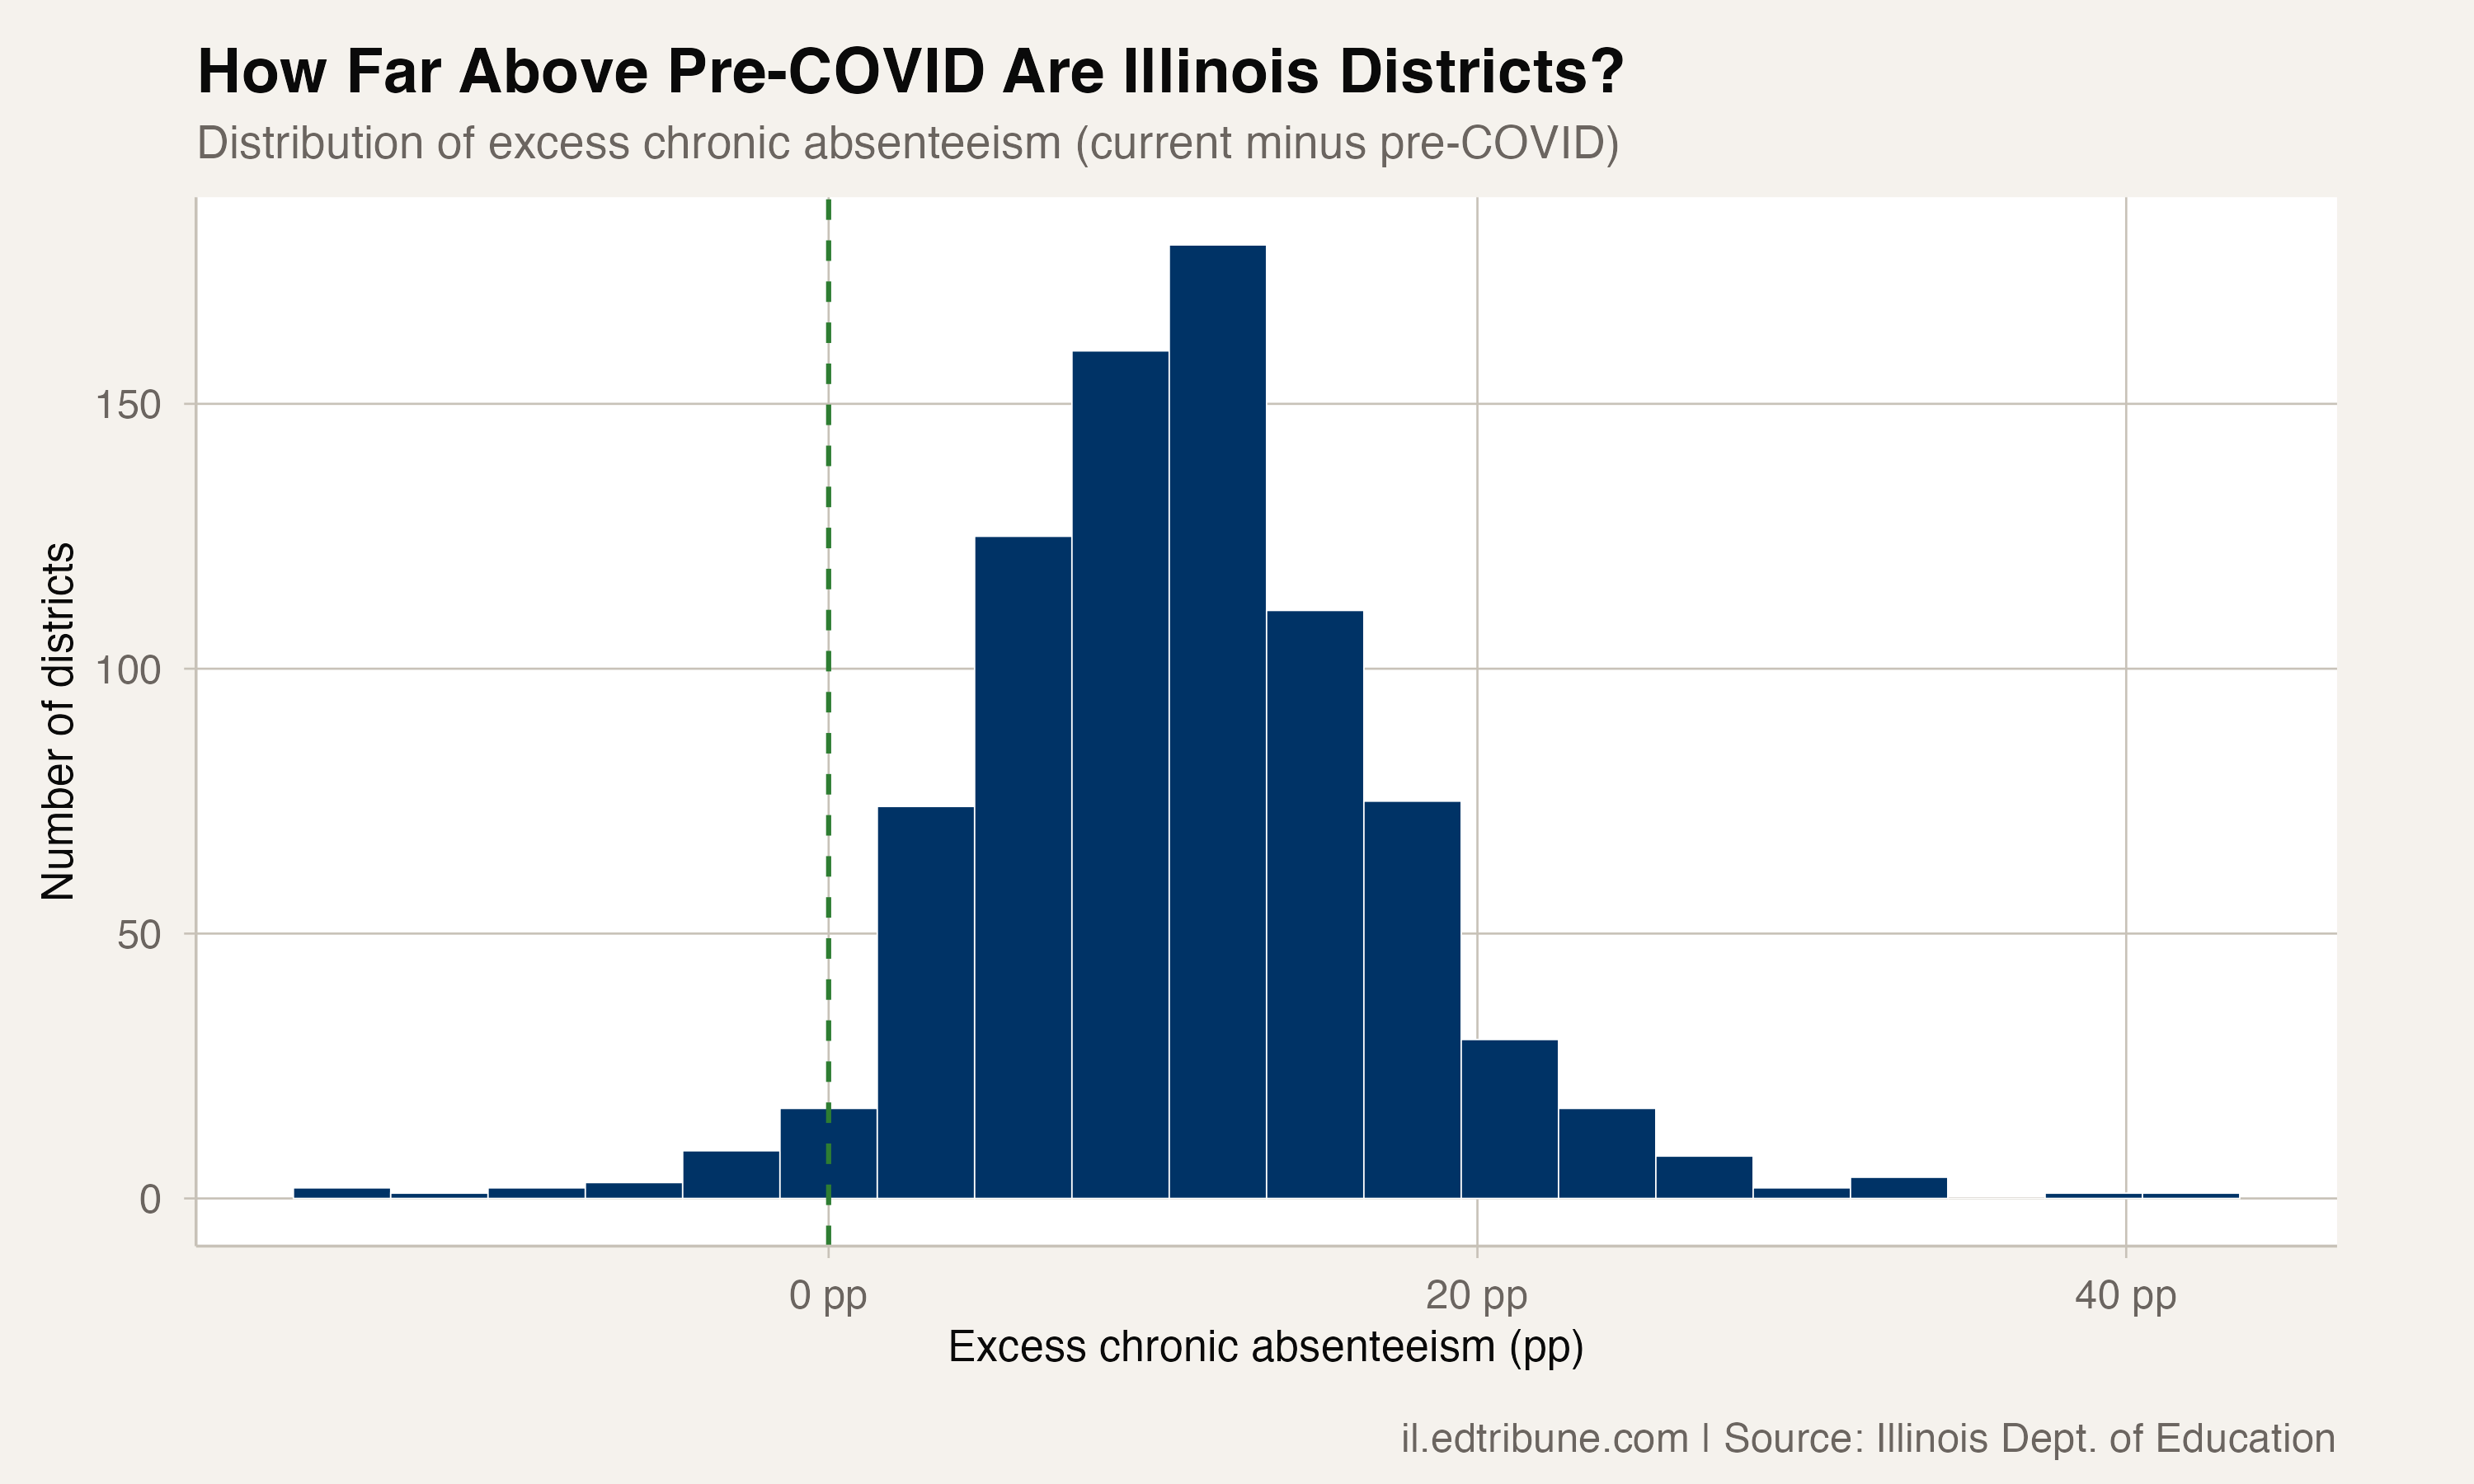
The modal district is roughly 8-12 percentage points above its pre-COVID level. But the tail is long: dozens of districts carry 20 or more points of excess chronic absenteeism, meaning their rates have more than doubled from already-elevated baselines.
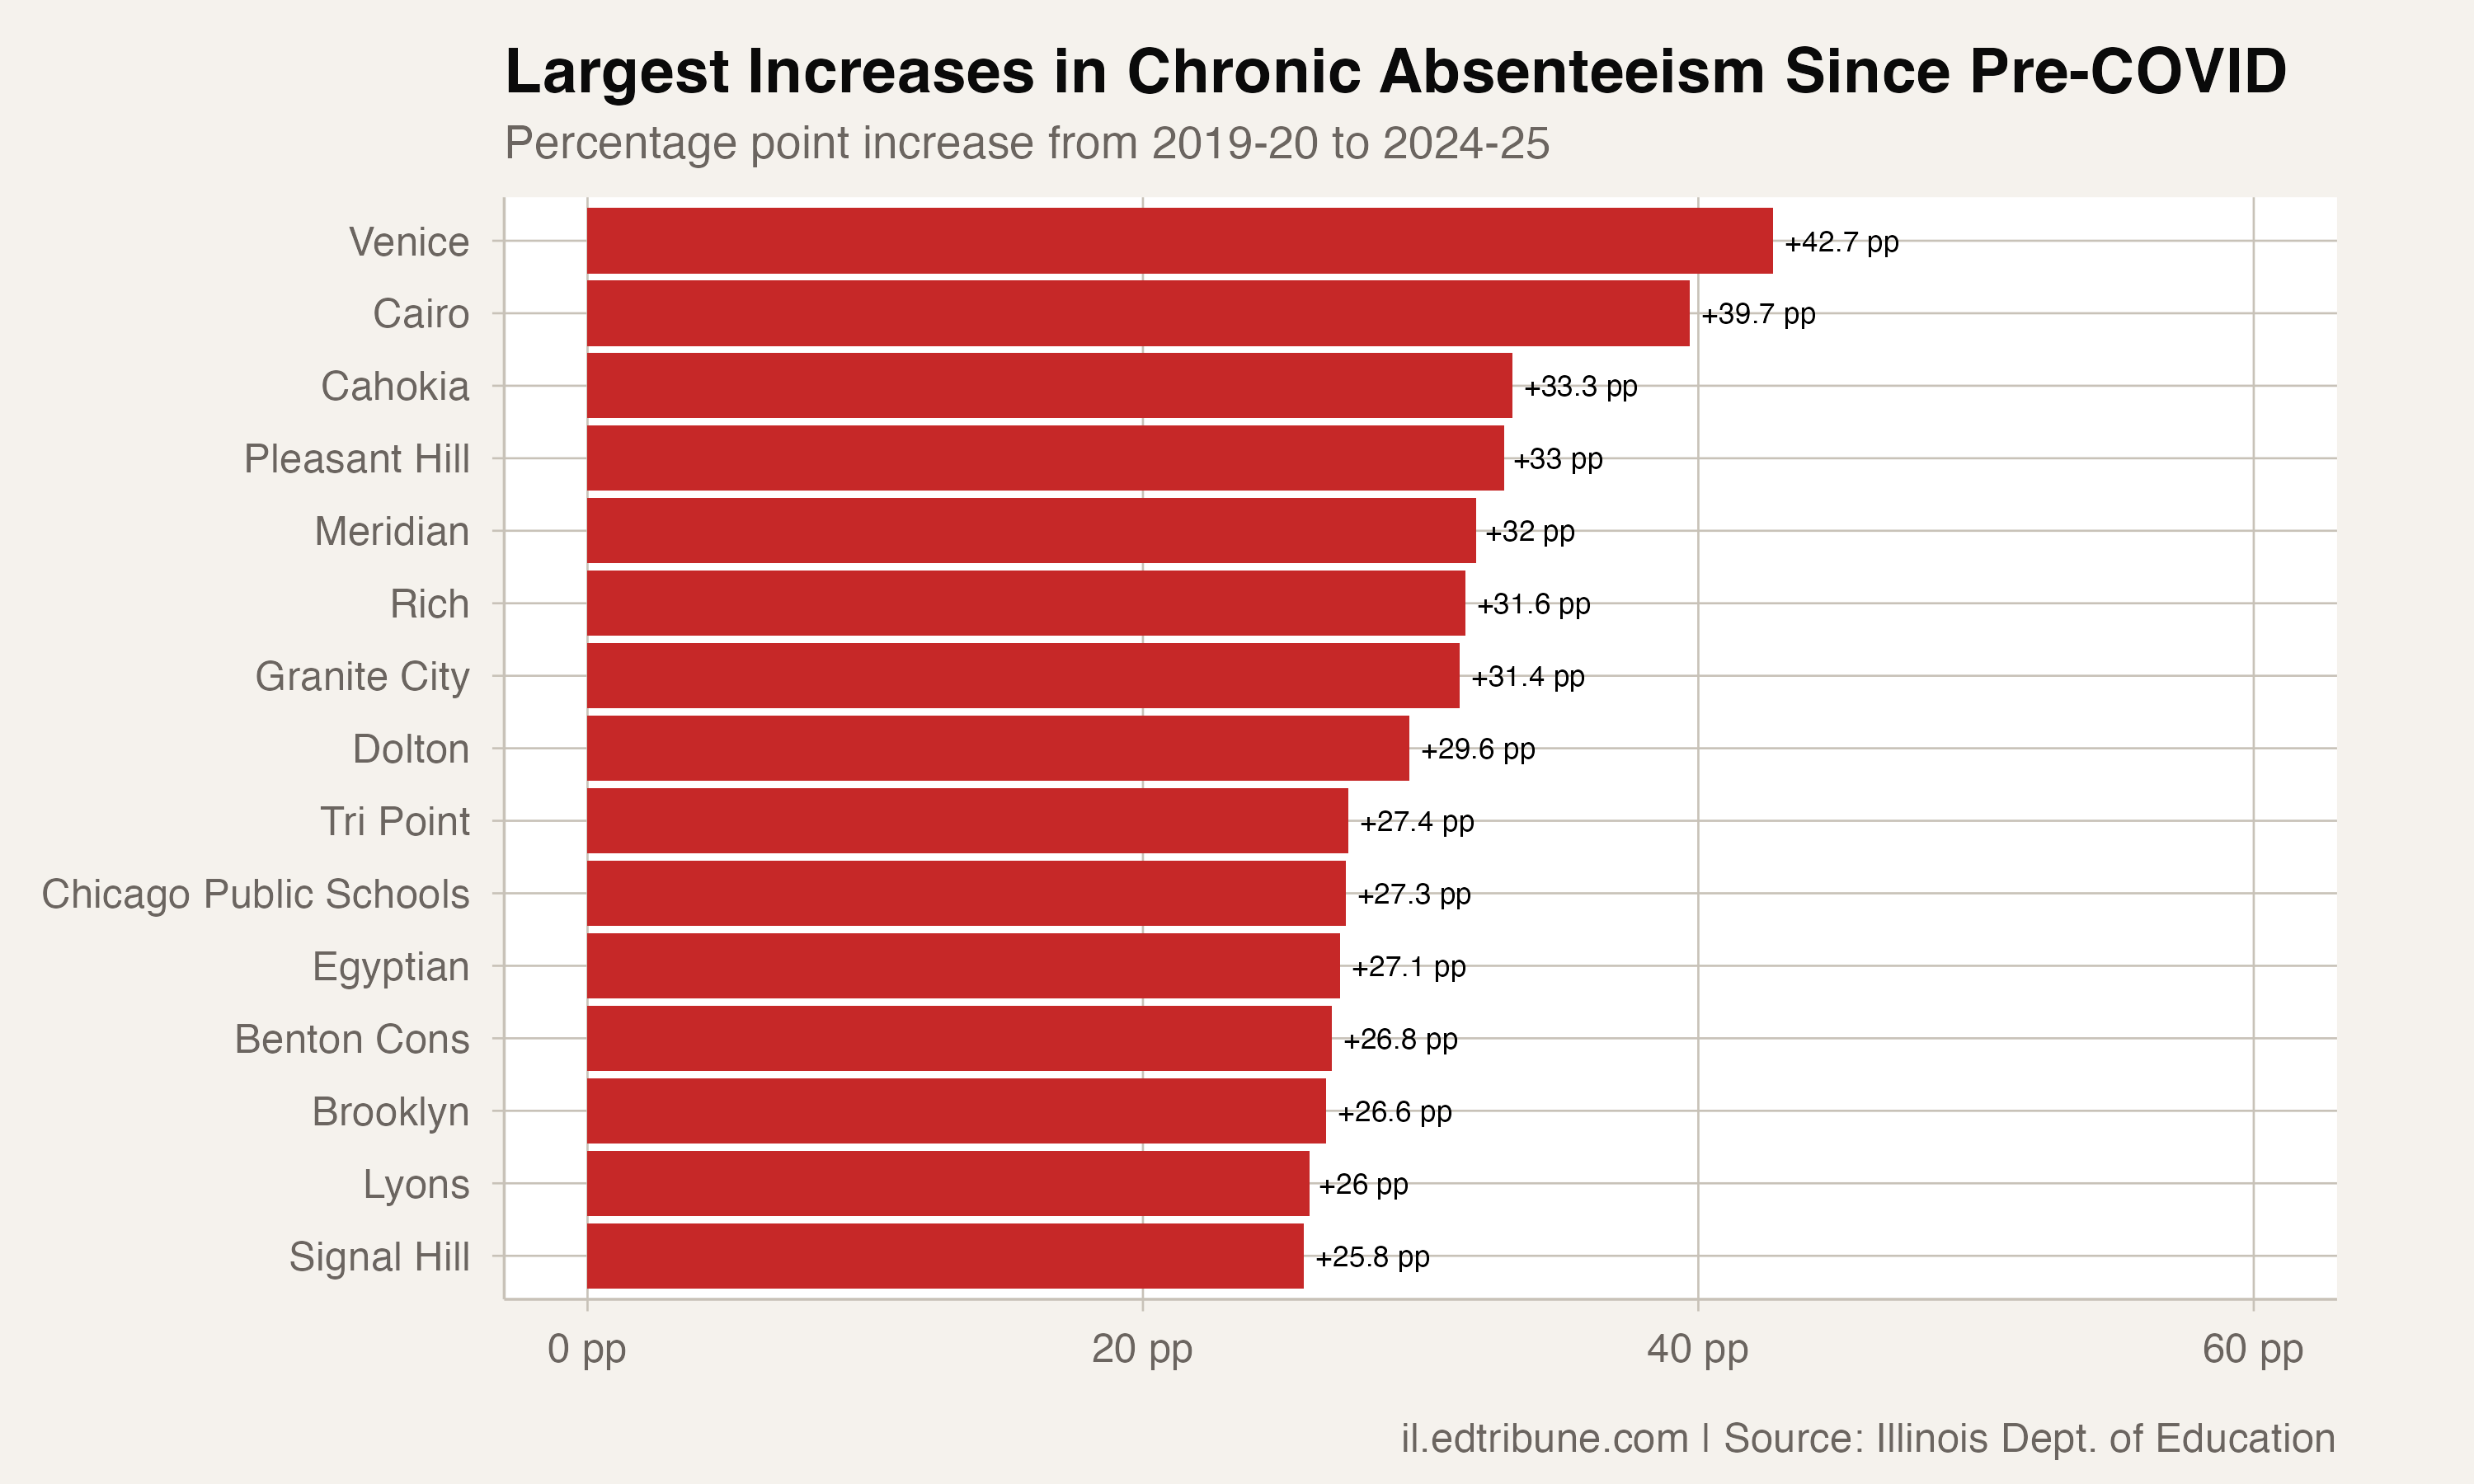
The hardest-hit districts share a common profile: they serve predominantly low-income, majority-minority communities where the structural barriers to attendance were already serious before the pandemic. Bus routes have been cut, school nurse positions remain unfilled, and family housing turnover has accelerated in many of these communities since 2020.
The 23 who made it back
The districts that have recovered offer a mix of hope and caution. Seneca↗ET CCSD 170 dropped from 14.5% to 7.7%, cutting its rate nearly in half. Central↗ET CHSD 71 came back from 11.0% to 8.8%. Roselle↗ET SD 12 went from 9.3% to 8.7%.
But the list also includes districts like Springfield↗ET SD 186, which "recovered" only because its pre-COVID rate was already 42.4%; it sat at 40.7% in 2024-25, a technically lower number that still represents two in five students missing too much school. Proviso Twp↗ET HSD 209 similarly "recovered" from 62.5% to 47.9%, a real improvement but still a rate that would alarm any educator.
Some of the 23 recovered districts simply had such elevated pre-pandemic baselines that even a partial COVID recovery brought them back below their starting point. Genuine recovery, moving from a healthy baseline to a worse one and back, accounts for only a handful.
What 11 points of excess means
An average excess of 11.0 percentage points has real consequences. In a district of 5,000 students, it translates to roughly 550 additional chronically absent students compared to before the pandemic. Those students are missing approximately 18 days of instruction per year, or about a month of school. Across all 822 districts, the cumulative excess likely represents hundreds of thousands of students statewide who would have been attending regularly before COVID but are no longer doing so.
At the state's current pace of improvement, less than one point per year, closing an 11-point gap will take most of the decade. For the 799 districts still above their pre-pandemic rates, the question is no longer when attendance bounces back. It is whether it does.
Detailed code that reproduces the analysis and figures in this article is available exclusively to EdTribune subscribers.
Discussion
Sign in to join the discussion.
Loading comments...