Correction (September 30, 2026): An earlier version gave one-year enrollment losses for three suburban Cook districts in a passage about two-year changes. Over two years, J S Morton HSD 201 lost 435 students, Bremen CHSD 228 lost 394 and Country Club Hills SD 160 lost 283; Township HSD 214's loss was smaller than reported. The suburban Cook totals also counted several Chicago charter schools that the state lists separately from CPS; without them, suburban Cook lost 1,698 students in 2024 and 457 in 2025. The earlier version gave English learner counts for 2018-19 and 2022-23 that were estimated from the state's published percentages. Illinois did not publish those counts, so those passages now use the published percentages, plus the state's published counts from 2023-24 on. A downstate English learner share was removed because hundreds of downstate districts publish no rate. Several outside figures were also corrected to match their cited sources: the count of newly arrived students CPS enrolled in 2023-24, the bilingual teacher figures (the cited analysis found CPS budgeted for fewer bilingual teachers, not more), and the comparison of Illinois's loss of residents under 18 with other states. The county enrollment totals and the article's main finding are unchanged.
Every other part of Illinois lost students last year. Cook County gained them.
The county added 707 students in 2024-25, following a gain of 324 the year before. Those numbers are small against a county that enrolls 673,040 students. But they represent something Cook County has not done since 2014-15: grow in back-to-back years. Between 2015 and 2023, the county lost students every single year, shedding 107,409 in total. Outside Cook County, the rest of the state lost 4,459 students in 2025 alone, with the collar counties and most downstate districts continuing a decline that predates the pandemic.
The divergence marks a geographic split in Illinois education. Immigration is reshaping Cook County classrooms while birth-rate decline and outmigration hollow out the suburbs and small towns.
The three Illinoises
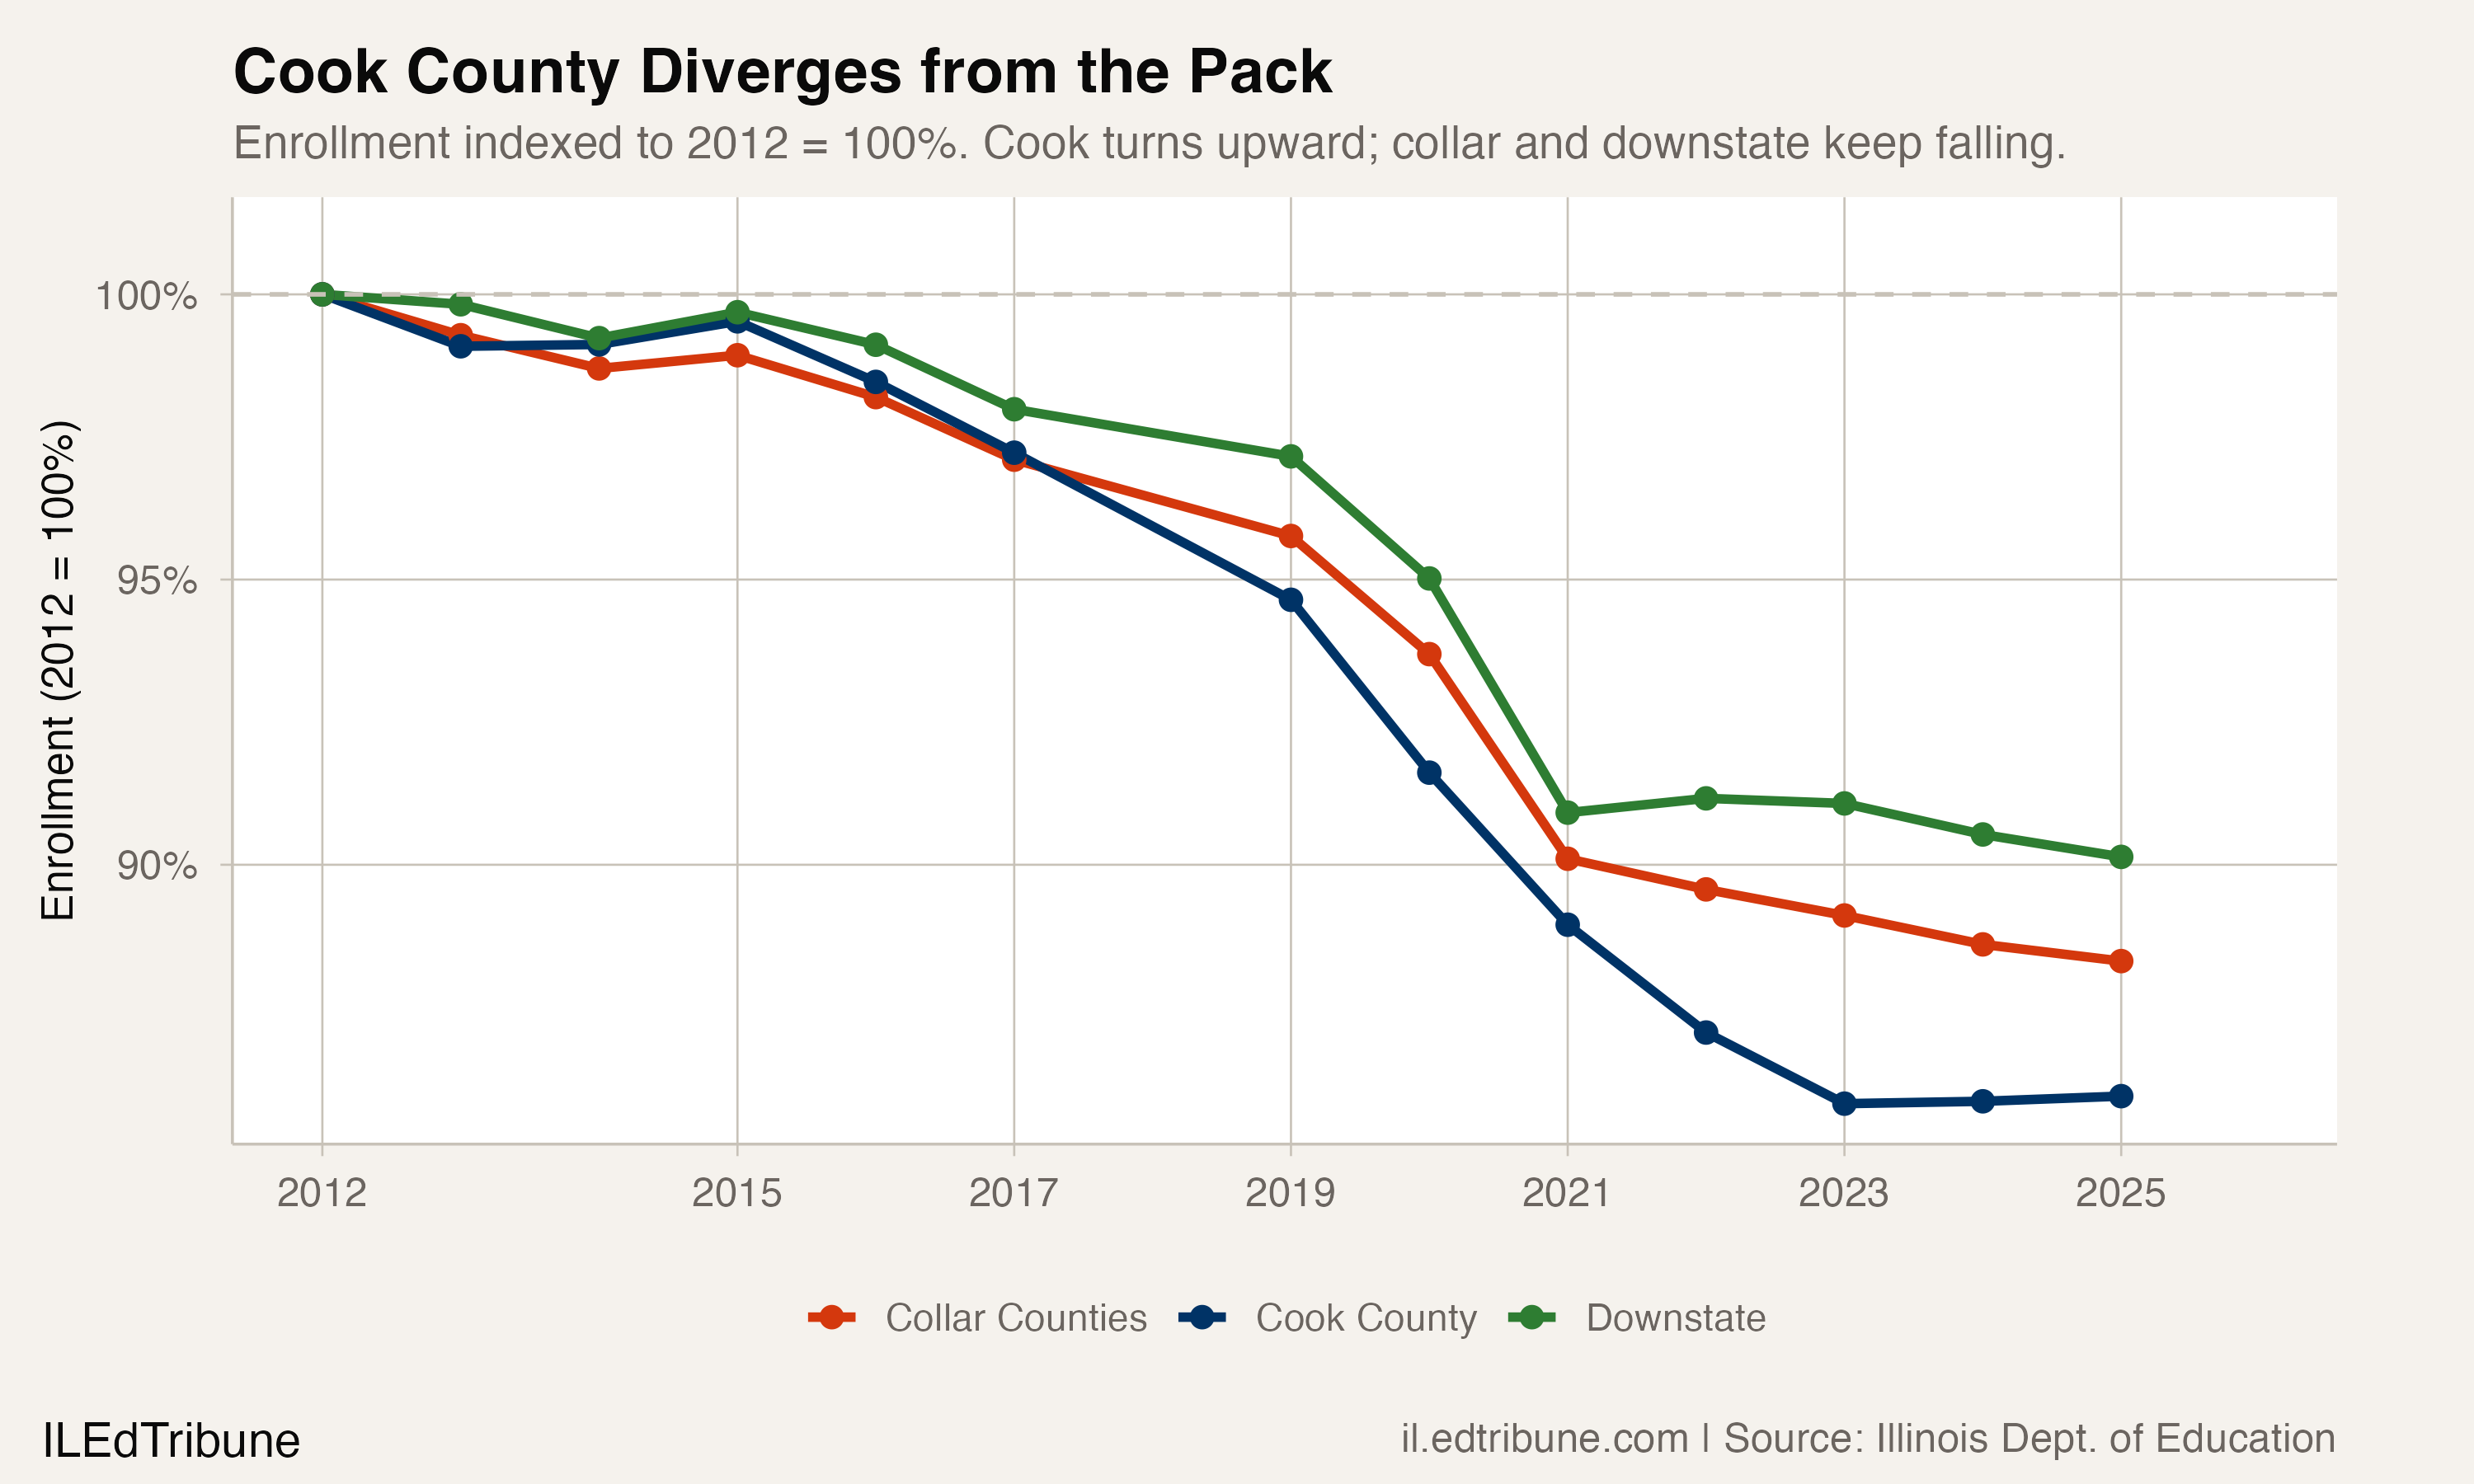
Illinois enrollment has been falling for over a decade, but the geography of the decline has shifted. Between 2012 and 2021, Cook County lost the most ground in both absolute and percentage terms: enrollment fell from 783,122 to 696,578, an 11.1% drop. The collar counties (DuPage, Kane, Lake, McHenry, and Will) declined 9.9% over the same period. Downstate held up slightly better at 9.1%.
Then the trajectories split. Cook County hit its floor in 2023 at 672,009 students and turned upward. The collar counties lost another 10,506 students between 2021 and 2025, falling to 517,092. Downstate lost 5,415 more, landing at 629,193.
Cook County's 673,040 students represent 37.0% of the state's district-level enrollment. That share has been remarkably stable since 2012, when it was 37.9%. The collar counties account for 28.4%, and downstate holds the remaining 34.6%.
Where Cook County's gains come from
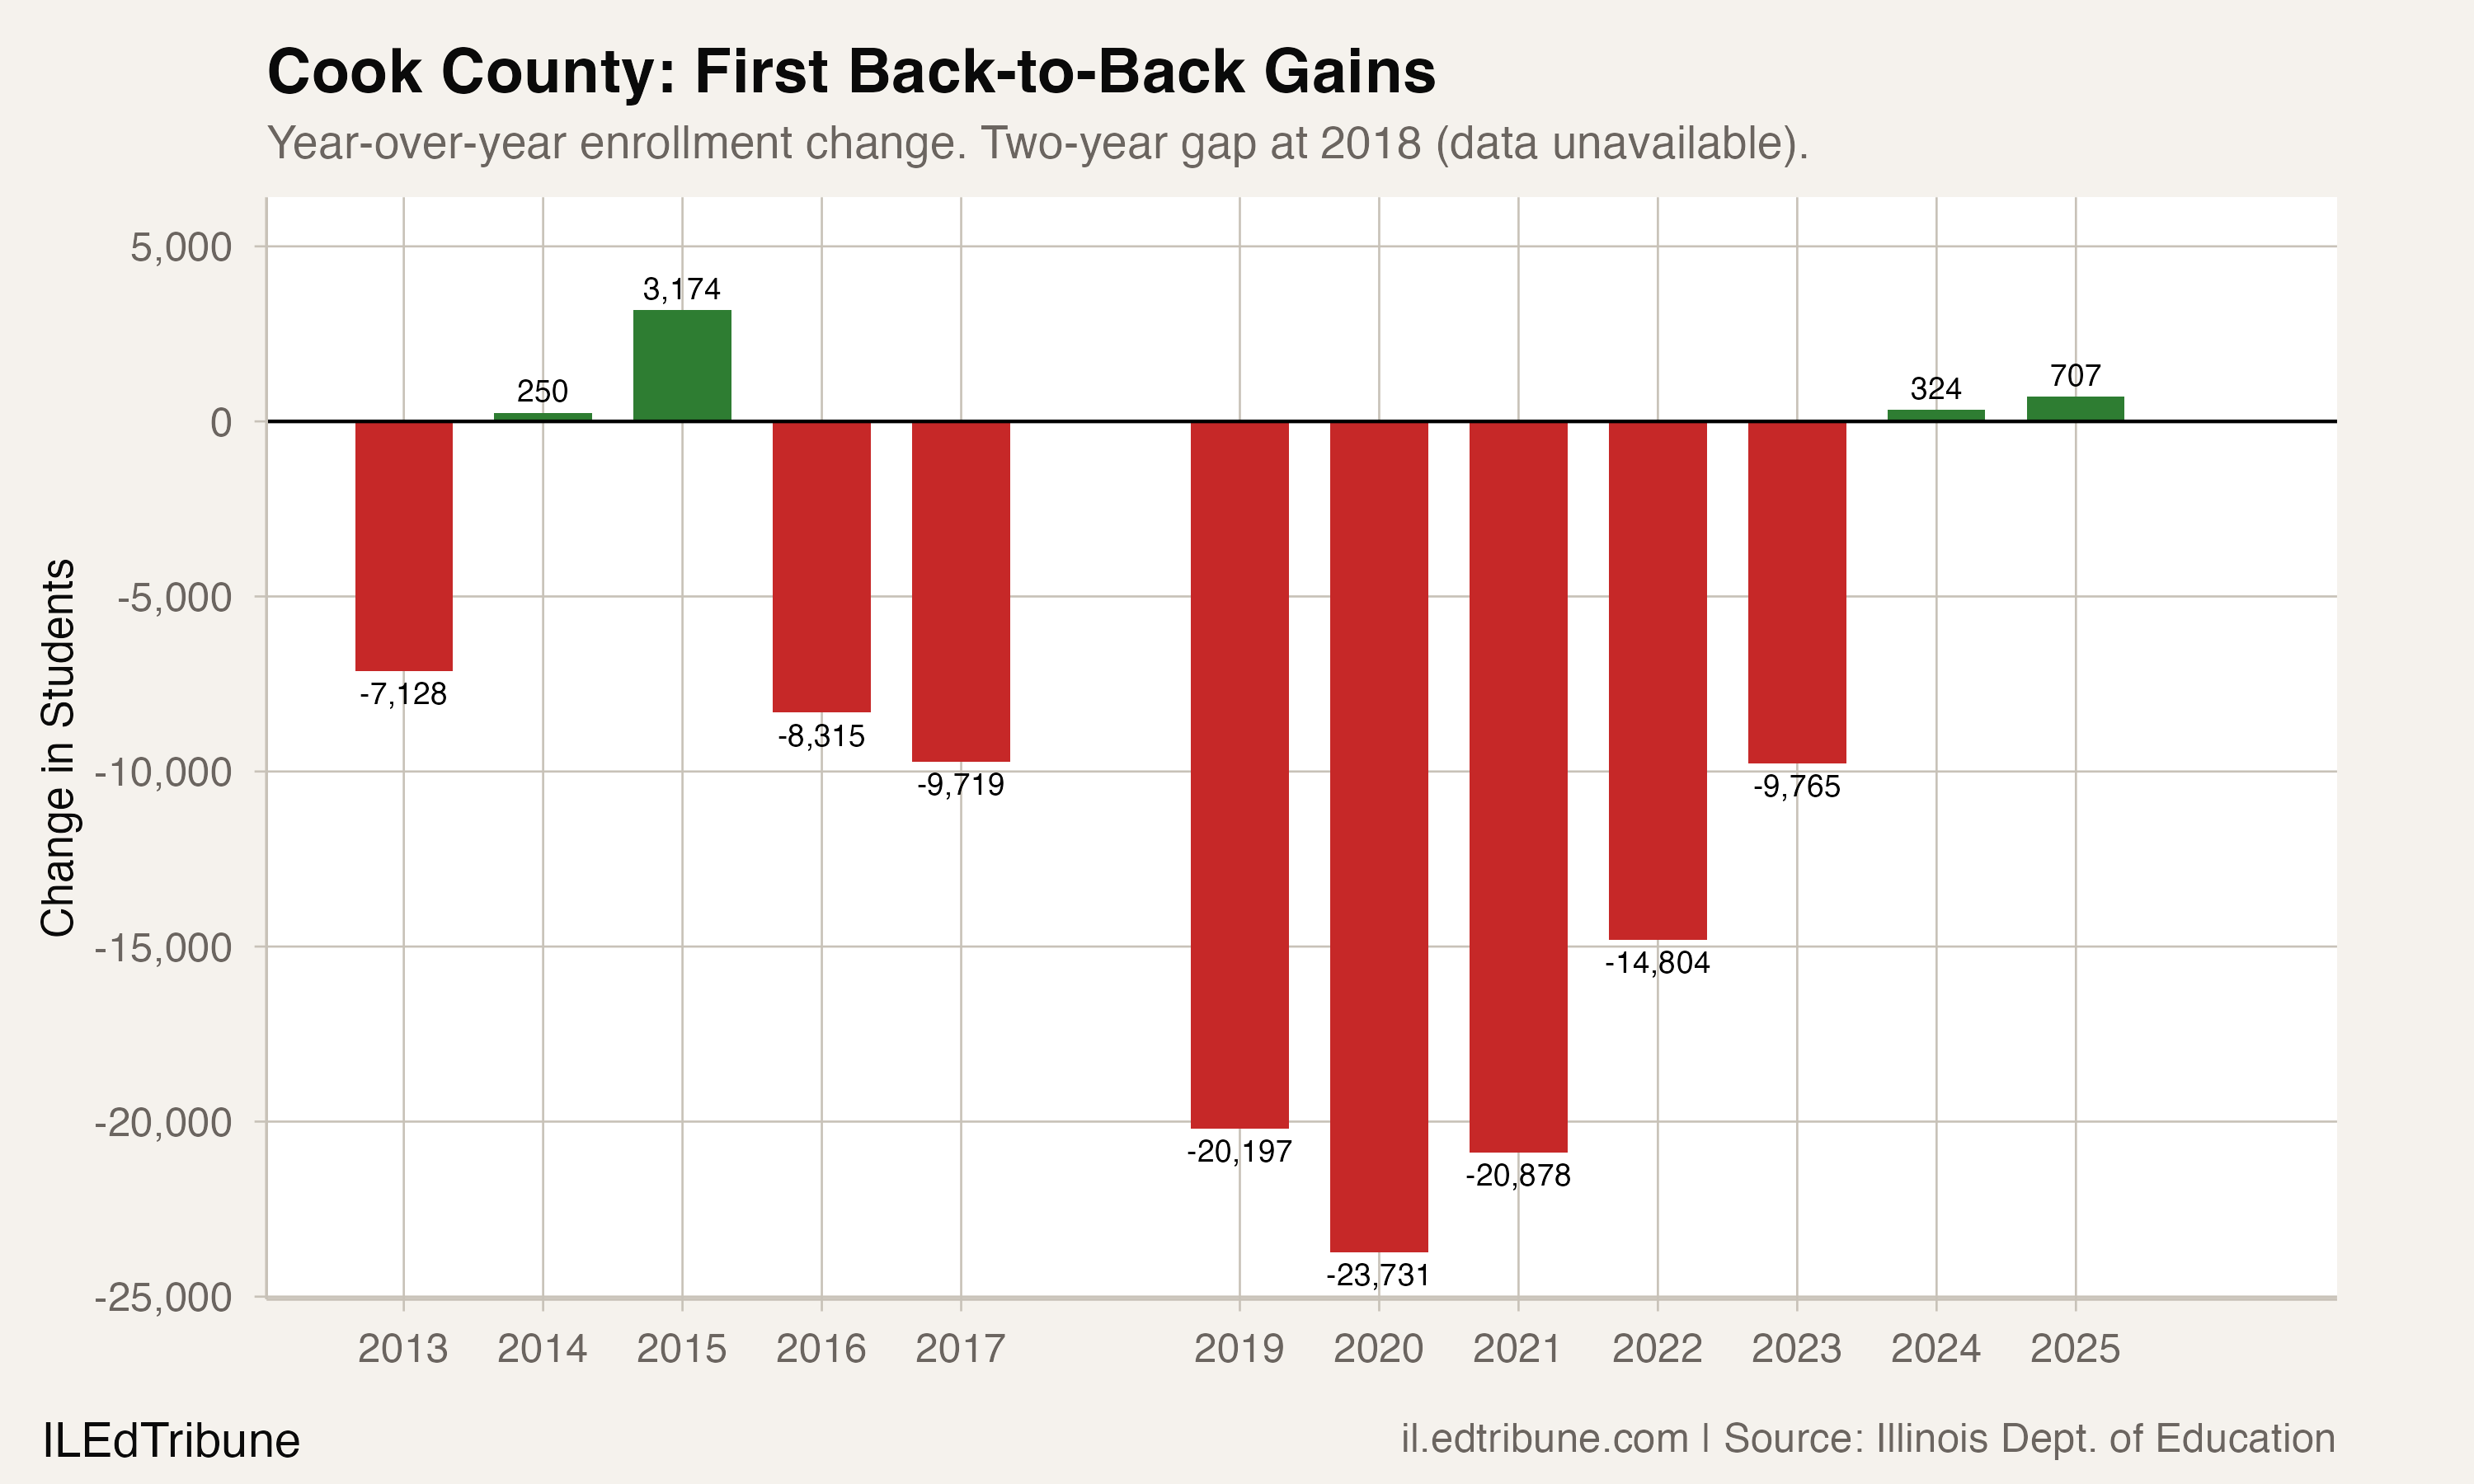
The YoY chart makes the recent reversal clear: after losing more than 20,000 students a year in 2020 and 2021 and another 14,804 in 2022, Cook County's bleeding slowed to 9,765 in 2023, then flipped to gains of 324 in 2024 and 707 in 2025.
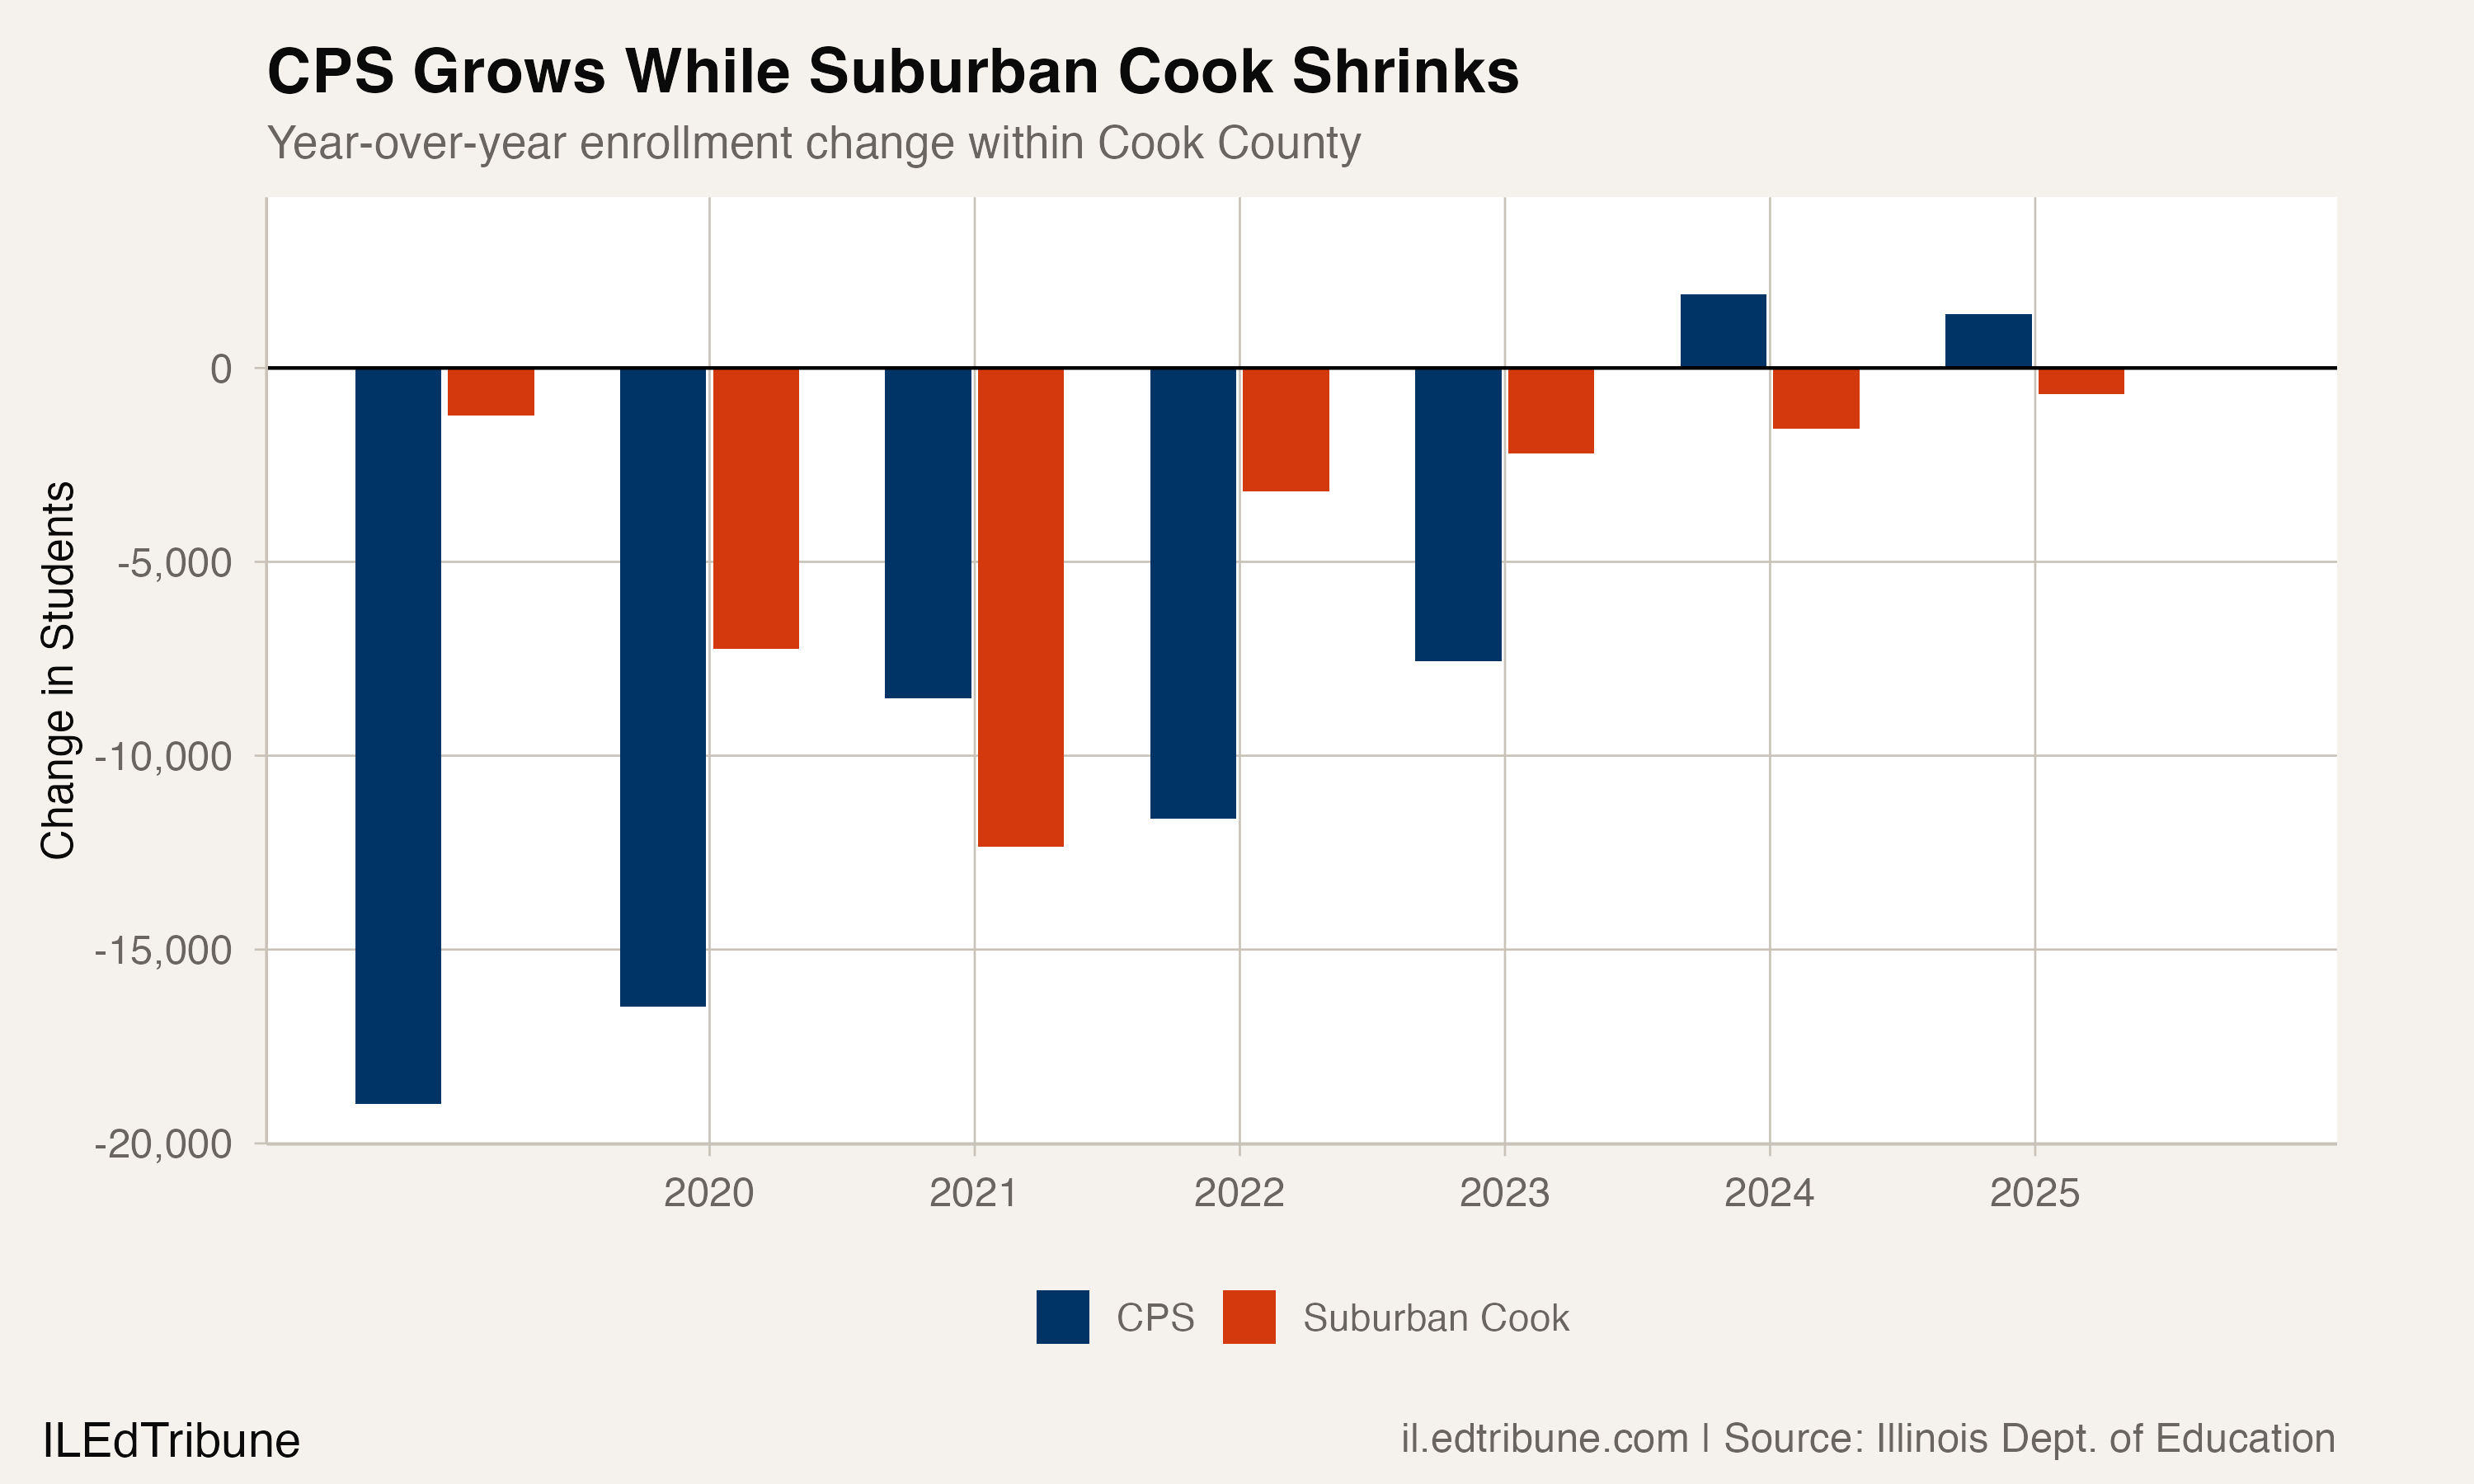
Chicago Public Schools accounts for nearly all of the turnaround. CPS gained 1,899 students in 2024 and 1,379 in 2025, adding 3,278 over two years. Suburban Cook County, by contrast, lost 1,698 in 2024 and 457 in 2025. CPS is growing fast enough to more than offset the suburban losses, but the pattern is fragile: 81 of the 144 suburban Cook districts that could be tracked across both years still lost students between 2023 and 2025, while 61 gained.
Among suburban Cook districts, the biggest gainers over two years were Schaumburg CCSD 54 (+341), Wheeling CCSD 21 (+268), CCSD 62 (+254), and Palatine CCSD 15 (+212). The pattern is concentrated in the northwest suburbs, where immigrant communities have expanded. The largest two-year losses were in the south and west suburbs: J S Morton HSD 201 lost 435 students, Bremen CHSD 228 lost 394, and Country Club Hills SD 160 lost 283.
Immigration as enrollment engine
The force behind Cook County's reversal is English learner enrollment. Illinois publishes an English learner rate for each district, and weighting those rates by enrollment puts Cook County's EL share at 17.9% in 2019 and 25.3% in 2025. Districts that publish a rate hold more than 99% of the county's enrollment in every one of those years. Over the same six years the county lost 68,147 students. A share that climbs that fast inside a shrinking county means the number of English learners grew while the rest of enrollment fell. The EL growth did not fully offset the decline, but it slowed it to a crawl and then reversed it.
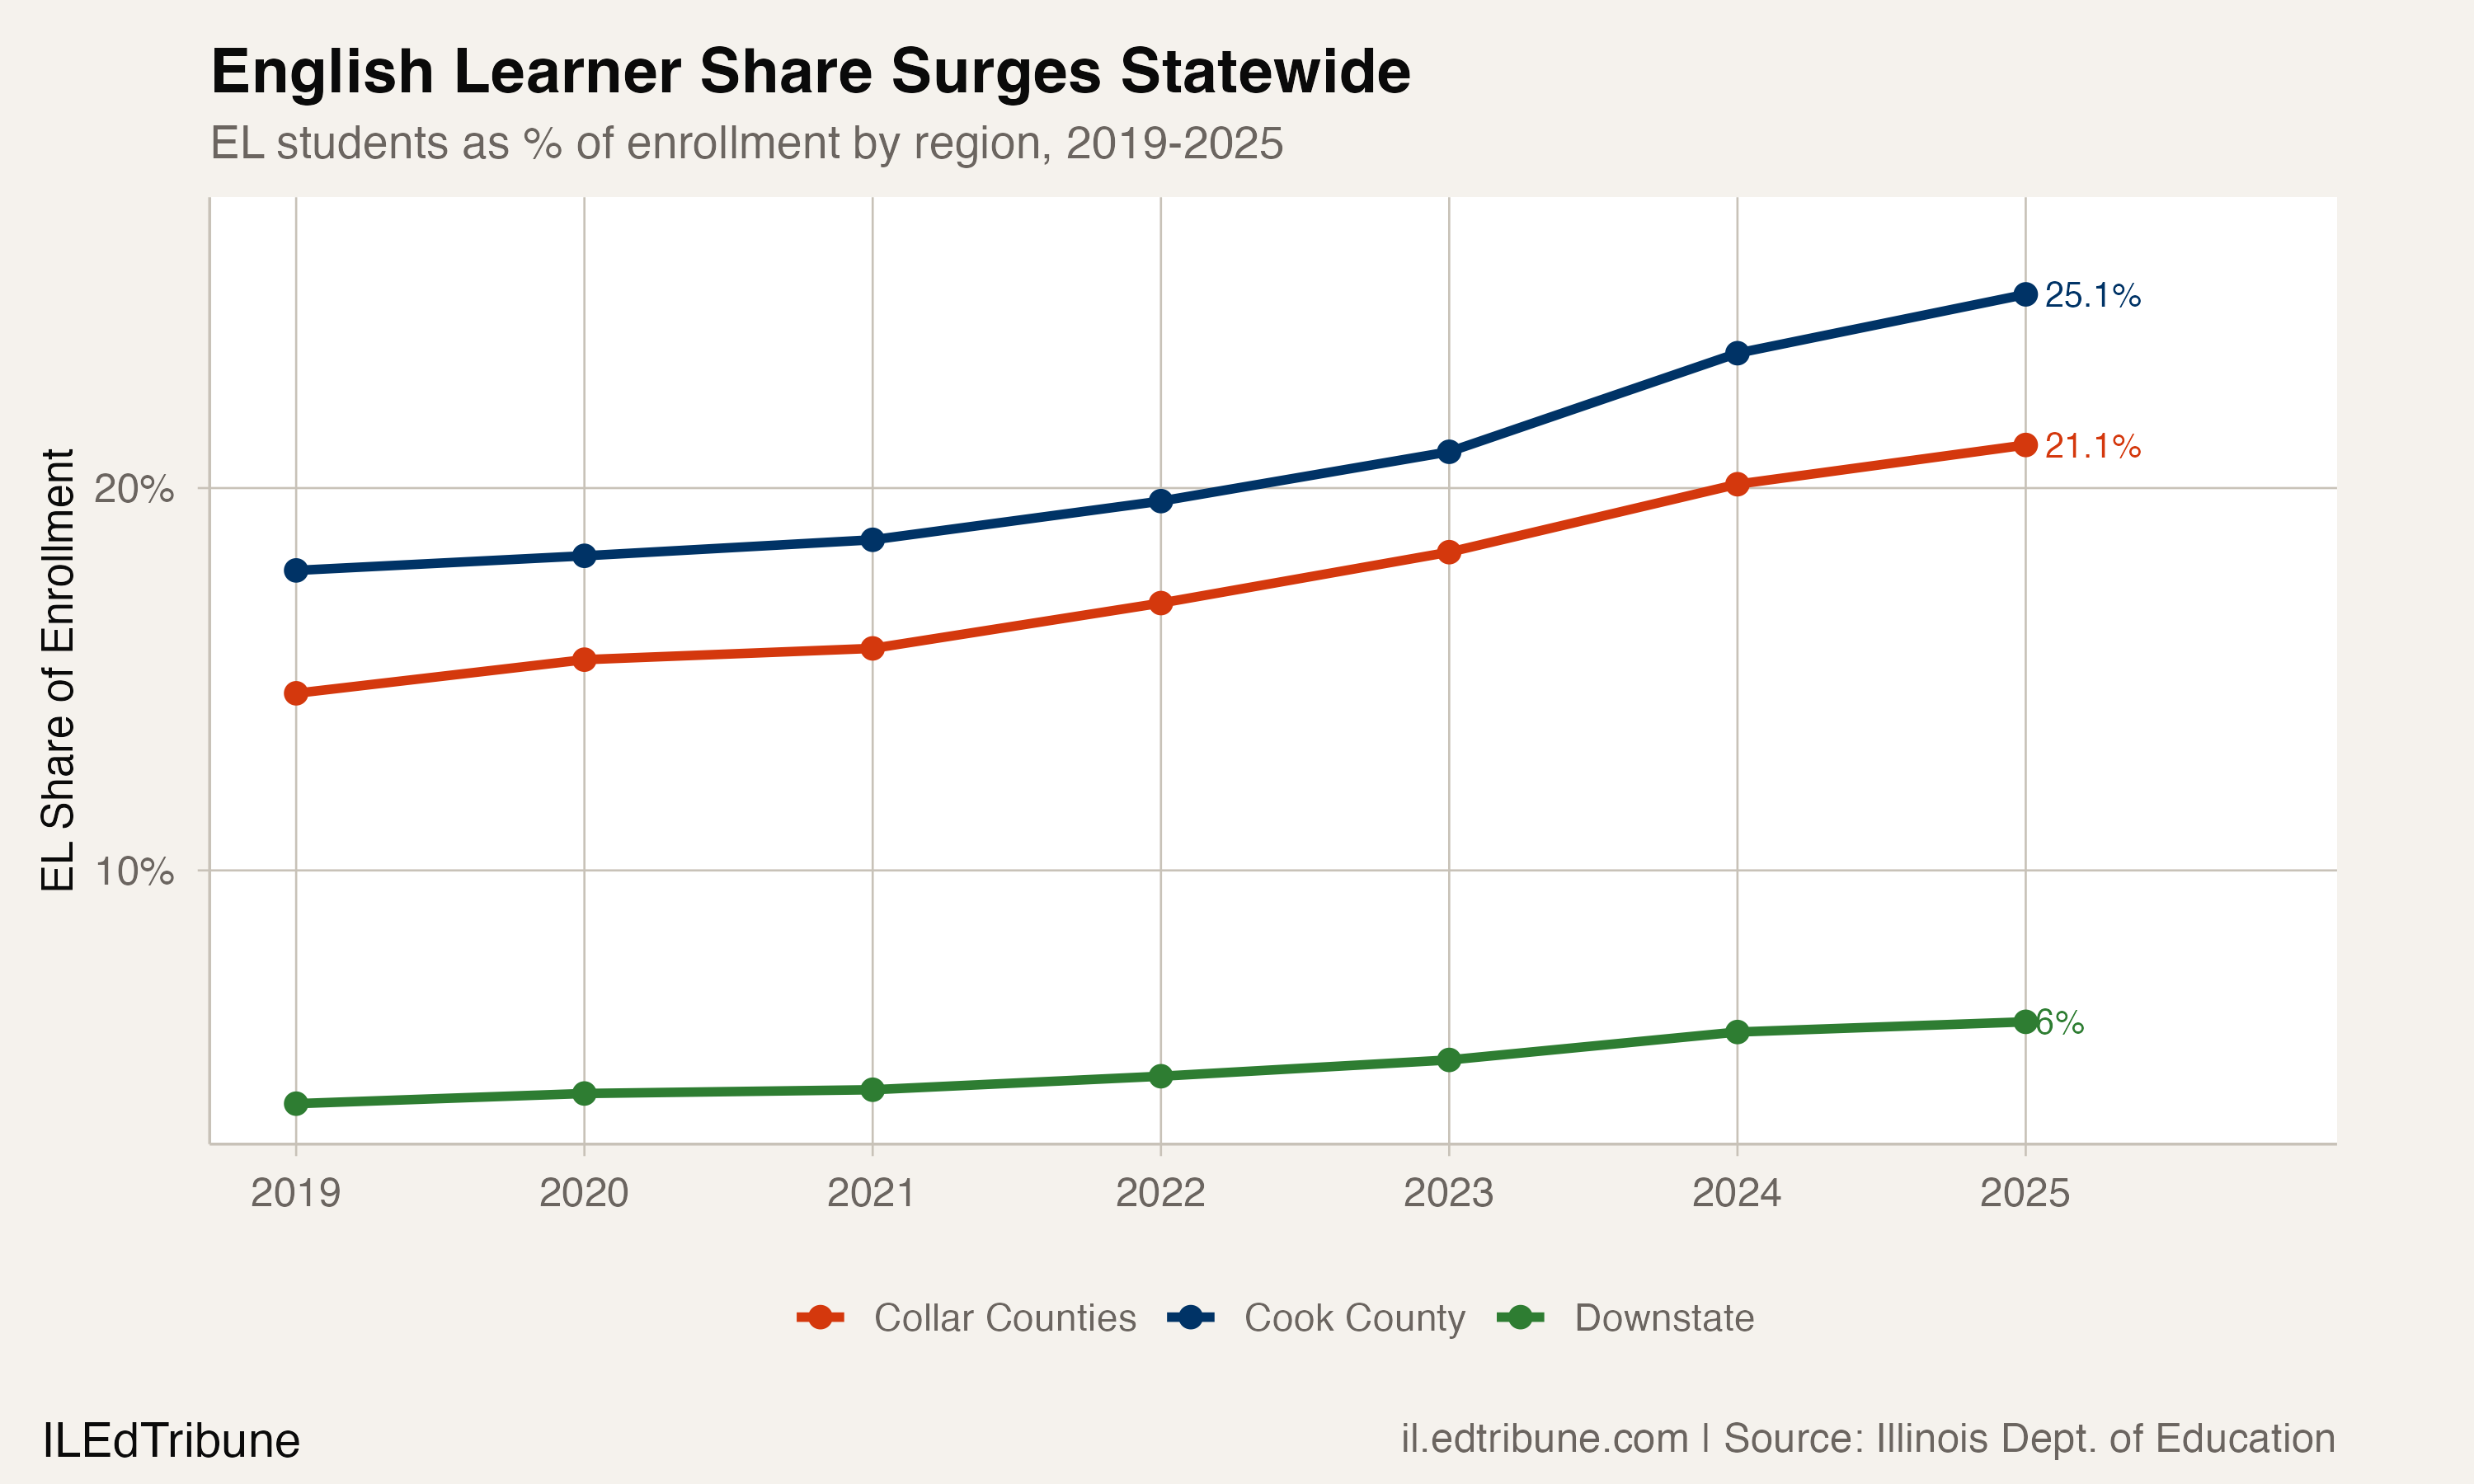
By 2025, one in four Cook County students was classified as an English learner. The collar counties saw a parallel rise, from 14.6% to 21.4%, though their total enrollment continues to fall. Downstate has no comparable figure. In 2025, 446 of its 568 districts published no English learner rate, and the districts that did held only 56% of downstate enrollment, down from 84% in 2019. With coverage that thin and that unstable, a regionwide share would say more about which districts reported than about how many English learners there are.
At CPS, the published English learner rate rose from 19.4% in 2019 to 22.9% in 2023 and 28.3% in 2025. The state began publishing English learner counts with the 2023-24 school year, and those show CPS going from 83,556 English learners in 2024 to 91,285 in 2025, a gain of 7,729 in one year while total CPS enrollment rose by 1,379. Over the same year, the number of CPS students who were not English learners fell from 238,112 to 231,762. Without the EL surge, CPS would still be shrinking.
The most likely driver is new arrivals from Central and South America. More than 51,000 immigrants arrived in Chicago beginning in late 2022, when Texas began busing migrants to the city. By February 2024, more than 5,700 newly arrived immigrant students had enrolled in CPS since the start of the 2023-24 school year, and families continued arriving into 2024-25.
An alternative explanation, that expanded identification criteria or improved screening are reclassifying students who were already enrolled, cannot be ruled out entirely. But a 7,729-student increase in a single year at a single district would be historically unprecedented for a reclassification-driven shift. The timing, geography, and scale all point to actual new enrollment.
Bilingual infrastructure under strain
The enrollment growth has outpaced the capacity to serve it. A Chalkbeat investigation found that many migrant families settled in predominantly Black, low-income neighborhoods on the South and West sides where schools had no existing bilingual programs. As of March 2024, at least 72 CPS schools had vacancies for bilingual-certified staff.
"The overall stabilization of the school system's enrollment represents a stunning and unexpected turnaround after more than a decade of decline." -- WBEZ, September 2024
The staffing challenge extends beyond CPS. At Township HSD 214, the published English learner rate went from 15.1% in 2023 to 21.8% in 2025. Township HSD 211 went from 11.6% to 17.3%, and Schaumburg CCSD 54 from 22.5% to 26.1%. For districts that had bilingual programs scaled to a stable or declining EL population, a jump that size in two years strains everything from teacher pipelines to assessment capacity.
CPS came into the surge short-handed. A Sun-Times analysis found the district budgeted for fewer bilingual teachers each year from 2018 to 2023, going from about 33 English learners per bilingual teacher to 43. How suburban districts, with smaller budgets and less existing infrastructure, will staff the same shift remains an open question.
The collar counties keep falling
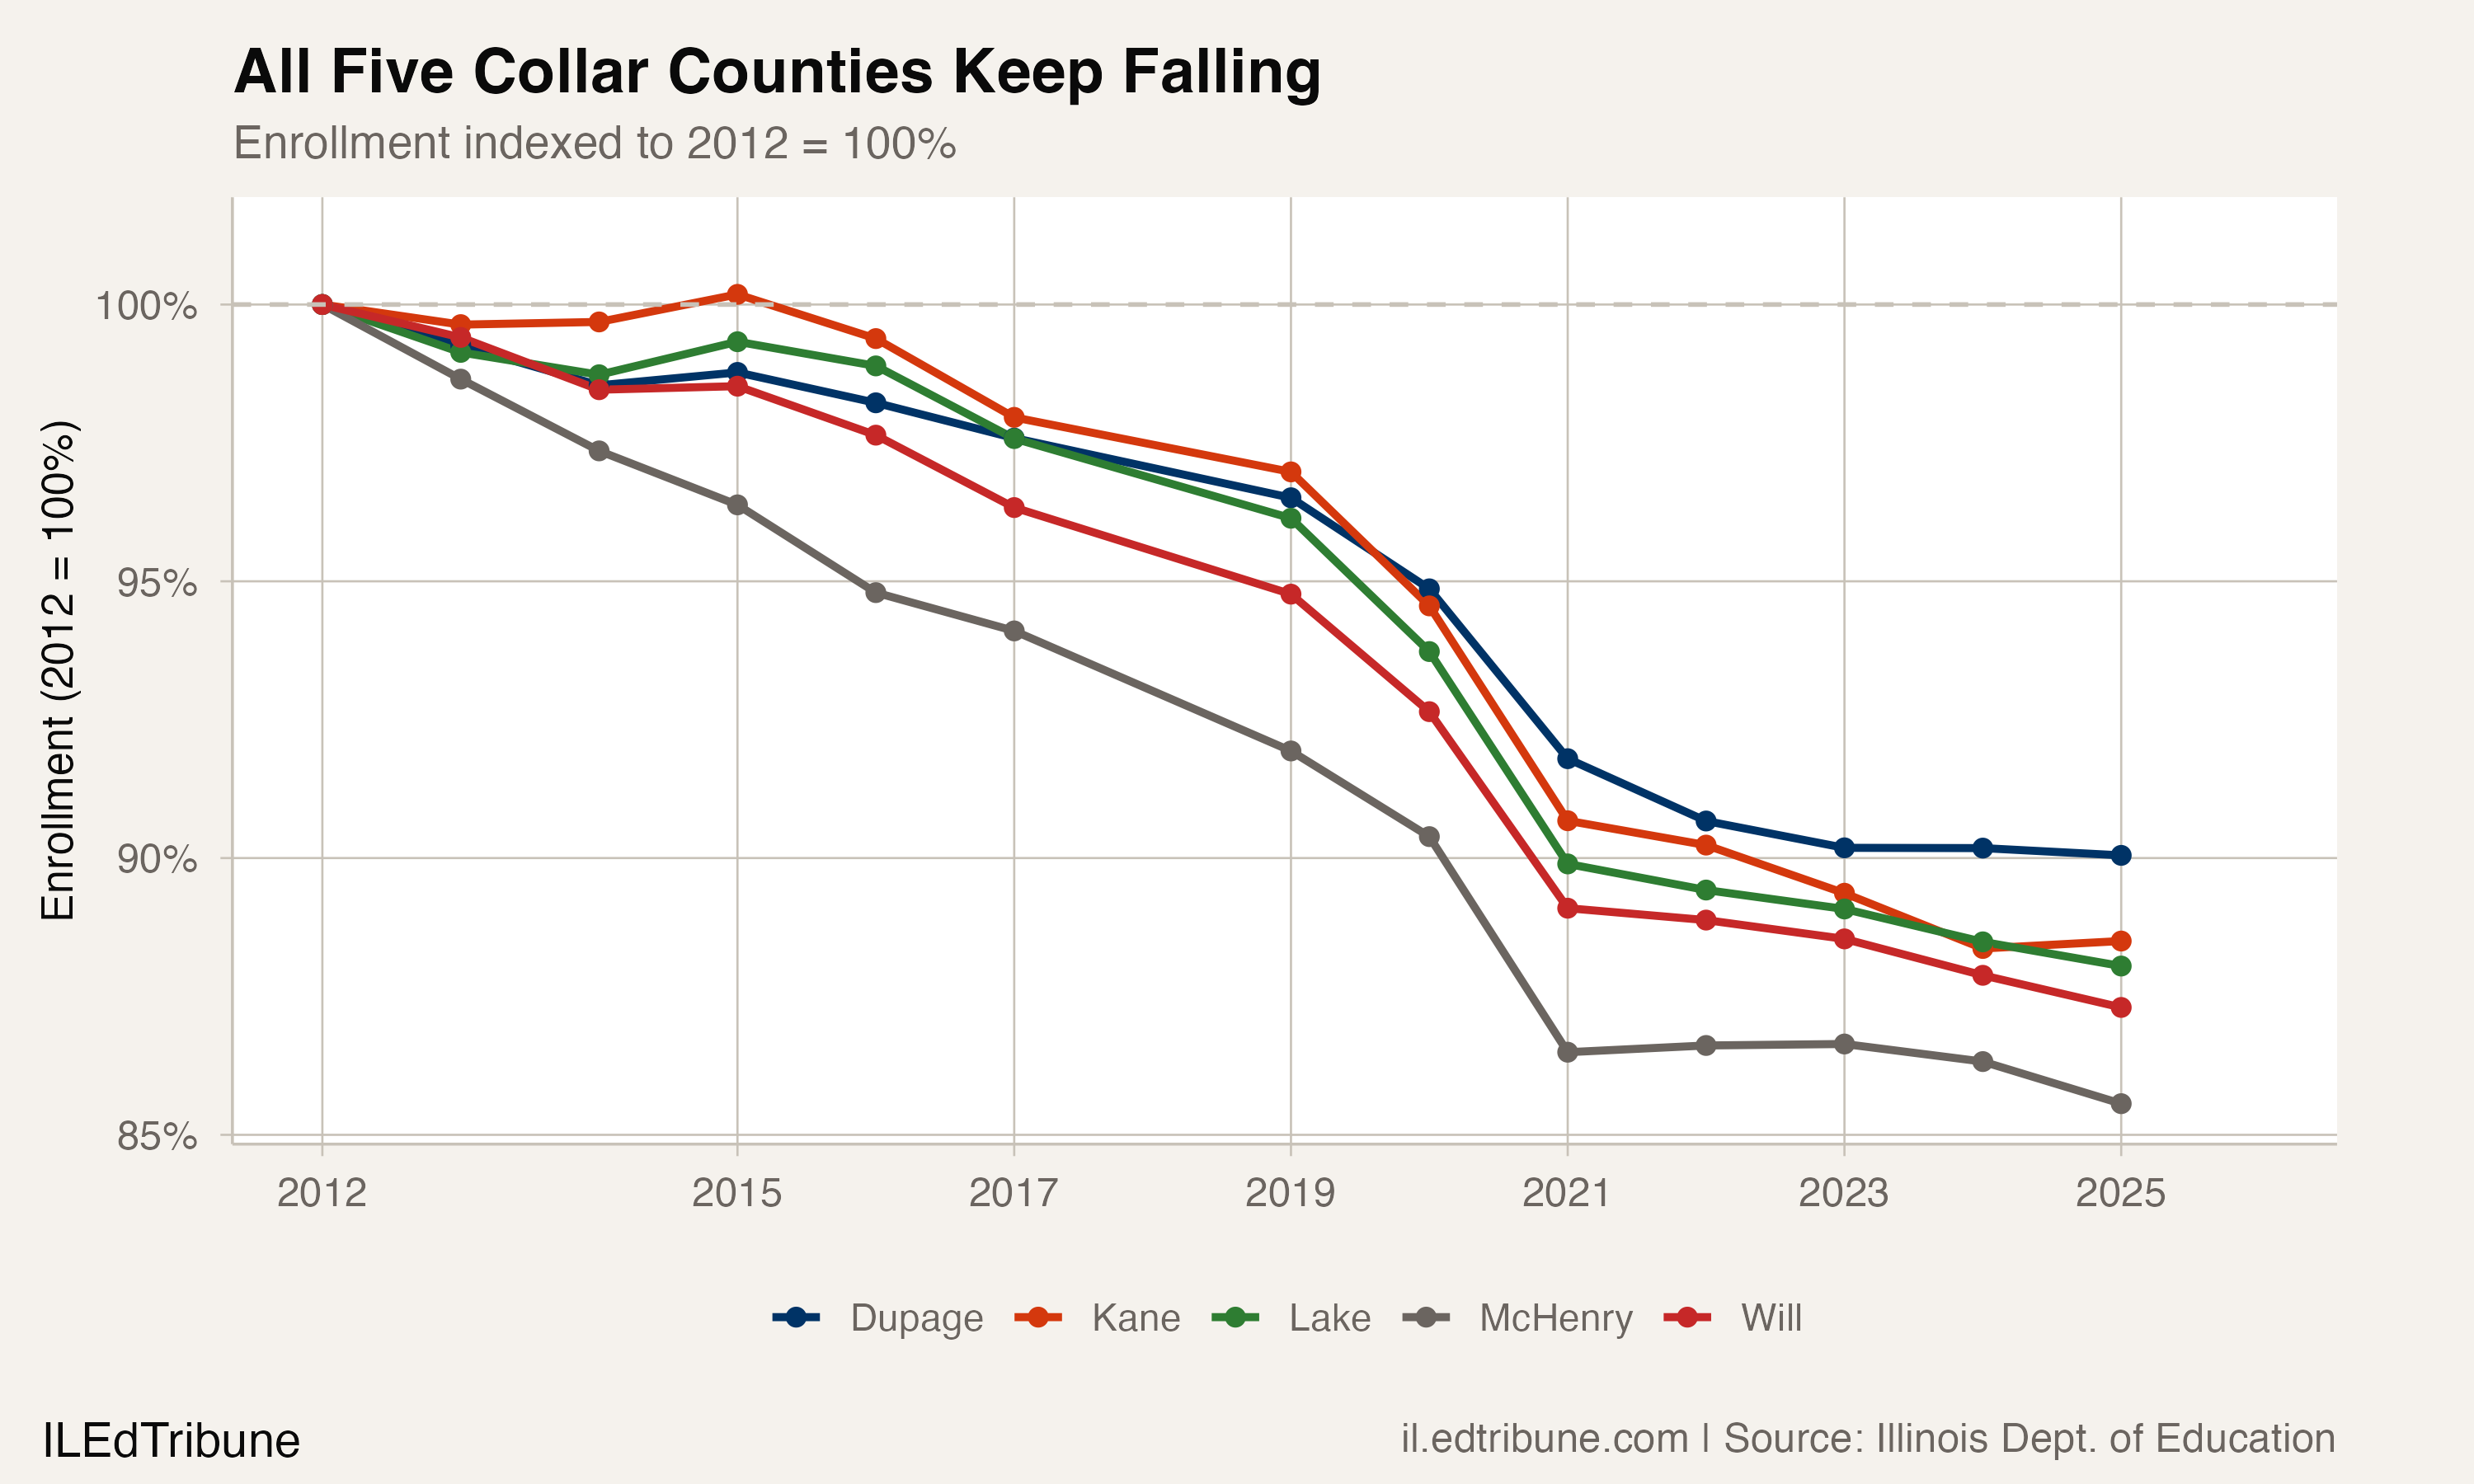
While Cook County turned upward, the collar counties as a group continued declining in 2025, losing 1,715 students. Will County lost the most (-673), followed by Lake (-599), McHenry (-400), and DuPage (-207). Kane County was the lone bright spot, adding 164 students, likely driven by its large Hispanic population. Since 2012, the five collar counties have lost 68,444 students, an 11.7% decline.
McHenry County has been hit hardest in percentage terms, falling from 52,608 in 2012 to 45,013 in 2025, a 14.4% decline. Will County is close behind at 12.7%. Kane County, which has a large and growing Hispanic population, has held up somewhat better at 11.5%.
The collar counties face a structural problem that Cook County's immigration wave does not solve. Illinois lost more than 172,000 residents under 18 between 2020 and 2024, a 6% drop that was steeper in percentage terms than the losses in California and New York. Birth rates are falling statewide, and domestic outmigration continues to pull families out of the Chicago metro area. The collar counties are absorbing both forces without the countervailing inflow of immigrant families that has buoyed Cook County.
Downstate lost 2,744 students in 2025, continuing a decline from 698,034 in 2012 to 629,193 in 2025, a 9.9% drop. The downstate losses are spread across hundreds of small districts where even modest enrollment drops can threaten program viability.
A bet on one variable
Cook County's gains are real, but they rest on a single variable. If immigration patterns shift due to federal policy changes, border enforcement, or changes to asylum processing, the inflow that is sustaining Cook County enrollment could slow or reverse. The county is not organically growing. Its birth-rate-driven decline is simply being masked by new arrivals.
The 2026-27 school year will be the first full test of whether the reversal holds. CPS enrolled about 325,000 students on the 20th day of school in 2024-25, with enrollment continuing to climb through the year as families arrived. Whether suburban Cook and the collar counties can tap into the same immigration-driven growth, or whether they continue losing students as cohorts shrink, will determine whether Illinois enrollment stabilizes or resumes its downward slide.
Detailed code that reproduces the analysis and figures in this article is available exclusively to EdTribune subscribers.
Discussion
Sign in to join the discussion.
Loading comments...