In Lake Forest School District 67, on Chicago's affluent North Shore, 21 out of 1,644 students are classified as economically disadvantaged. That is 1.3%. Across the state in East St. Louis, the figure is 99.3%. Nearly every student in the district qualifies.
These two districts share a state education system, a funding formula, and almost nothing else. Between them stretches the full width of economic inequality in Illinois public schools, where 918,734 students, 49.7% of total enrollment, are classified as economically disadvantaged in the 2024-25 school year. The rate has hovered within a fraction of the 50% mark for three consecutive years, and the state's enrollment decline is slowly pushing it higher.
The rate is rising even as the count falls
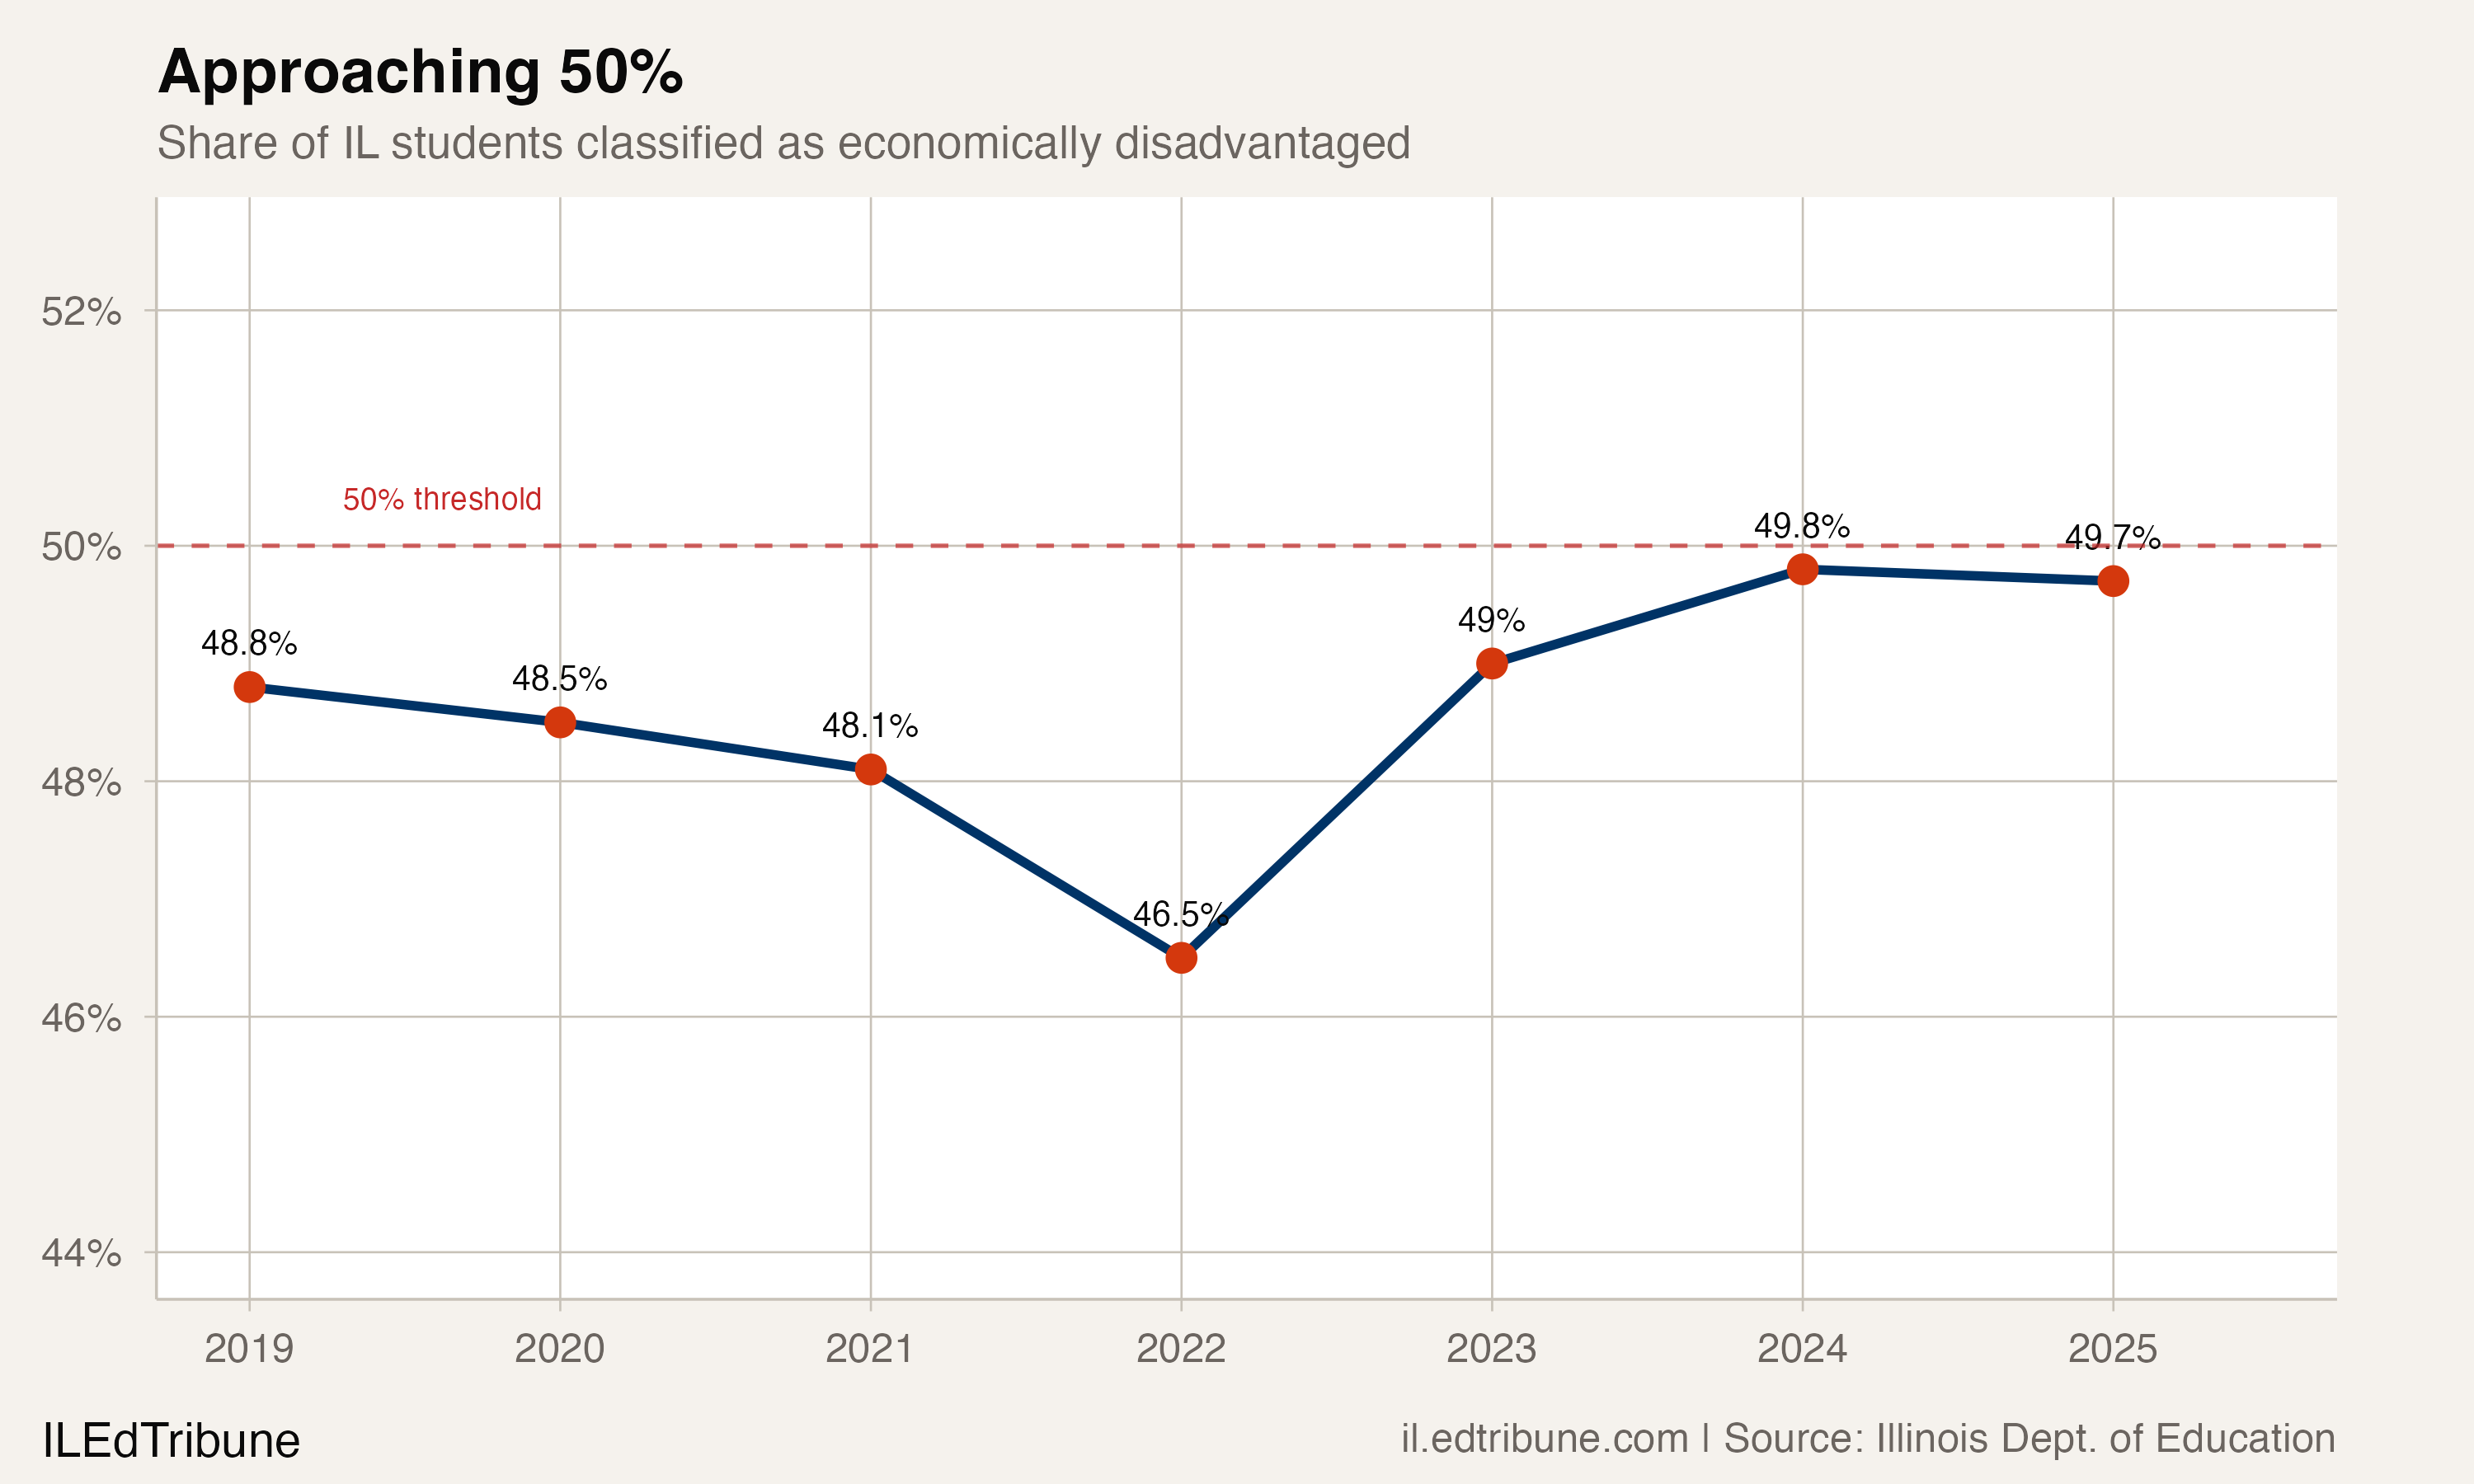
The economically disadvantaged share of Illinois enrollment stood at 48.8% in 2019. It dipped to 46.5% in 2022 before rebounding sharply to 49.0% in 2023 and reaching 49.8% in 2024. In 2025, it pulled back slightly to 49.7%.
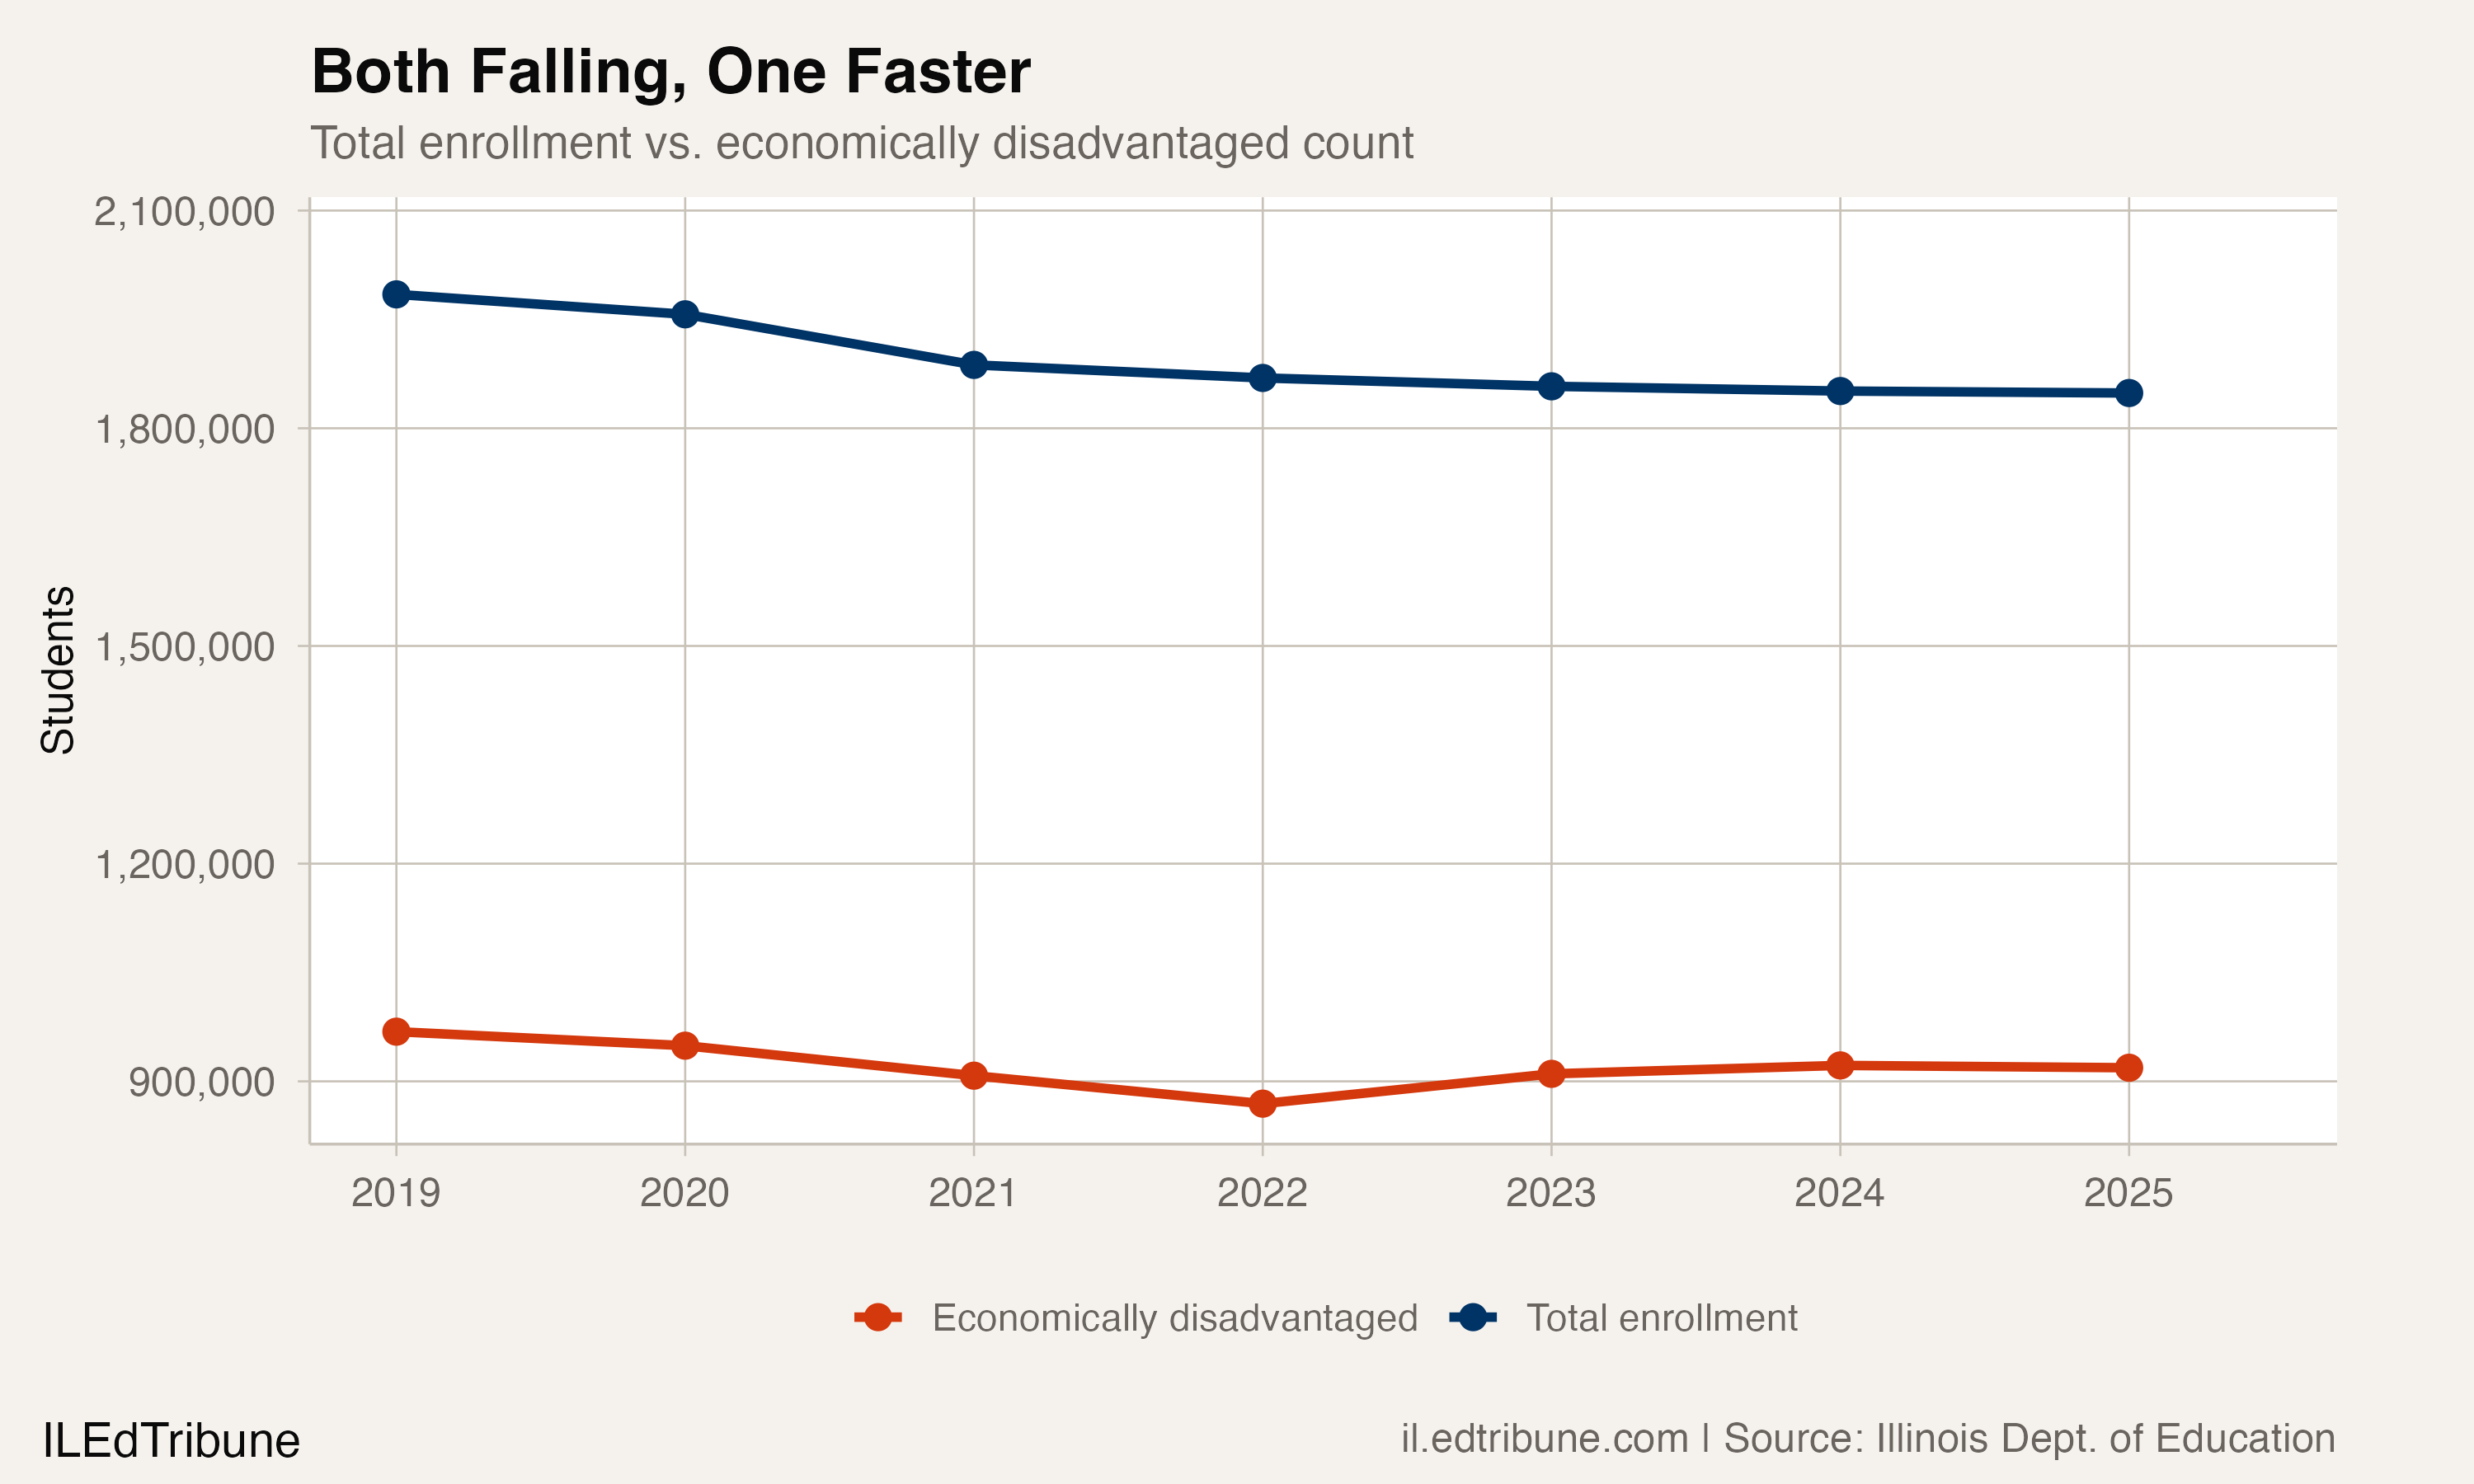
The count itself tells a different story. Illinois enrolled 968,445 economically disadvantaged students in 2019 and 918,734 in 2025, a decline of 49,711, or 5.1%. Total enrollment fell faster, dropping 6.9% over the same period. Students not classified as economically disadvantaged declined 8.5%, from 1,016,074 to 929,826. Part of this differential is mechanical: reclassification through CEP (detailed below) shifted some students into the disadvantaged category. But even accounting for measurement noise, the pattern is consistent with non-disadvantaged families leaving the public system at a higher rate.
The 2022 dip was not what it seemed
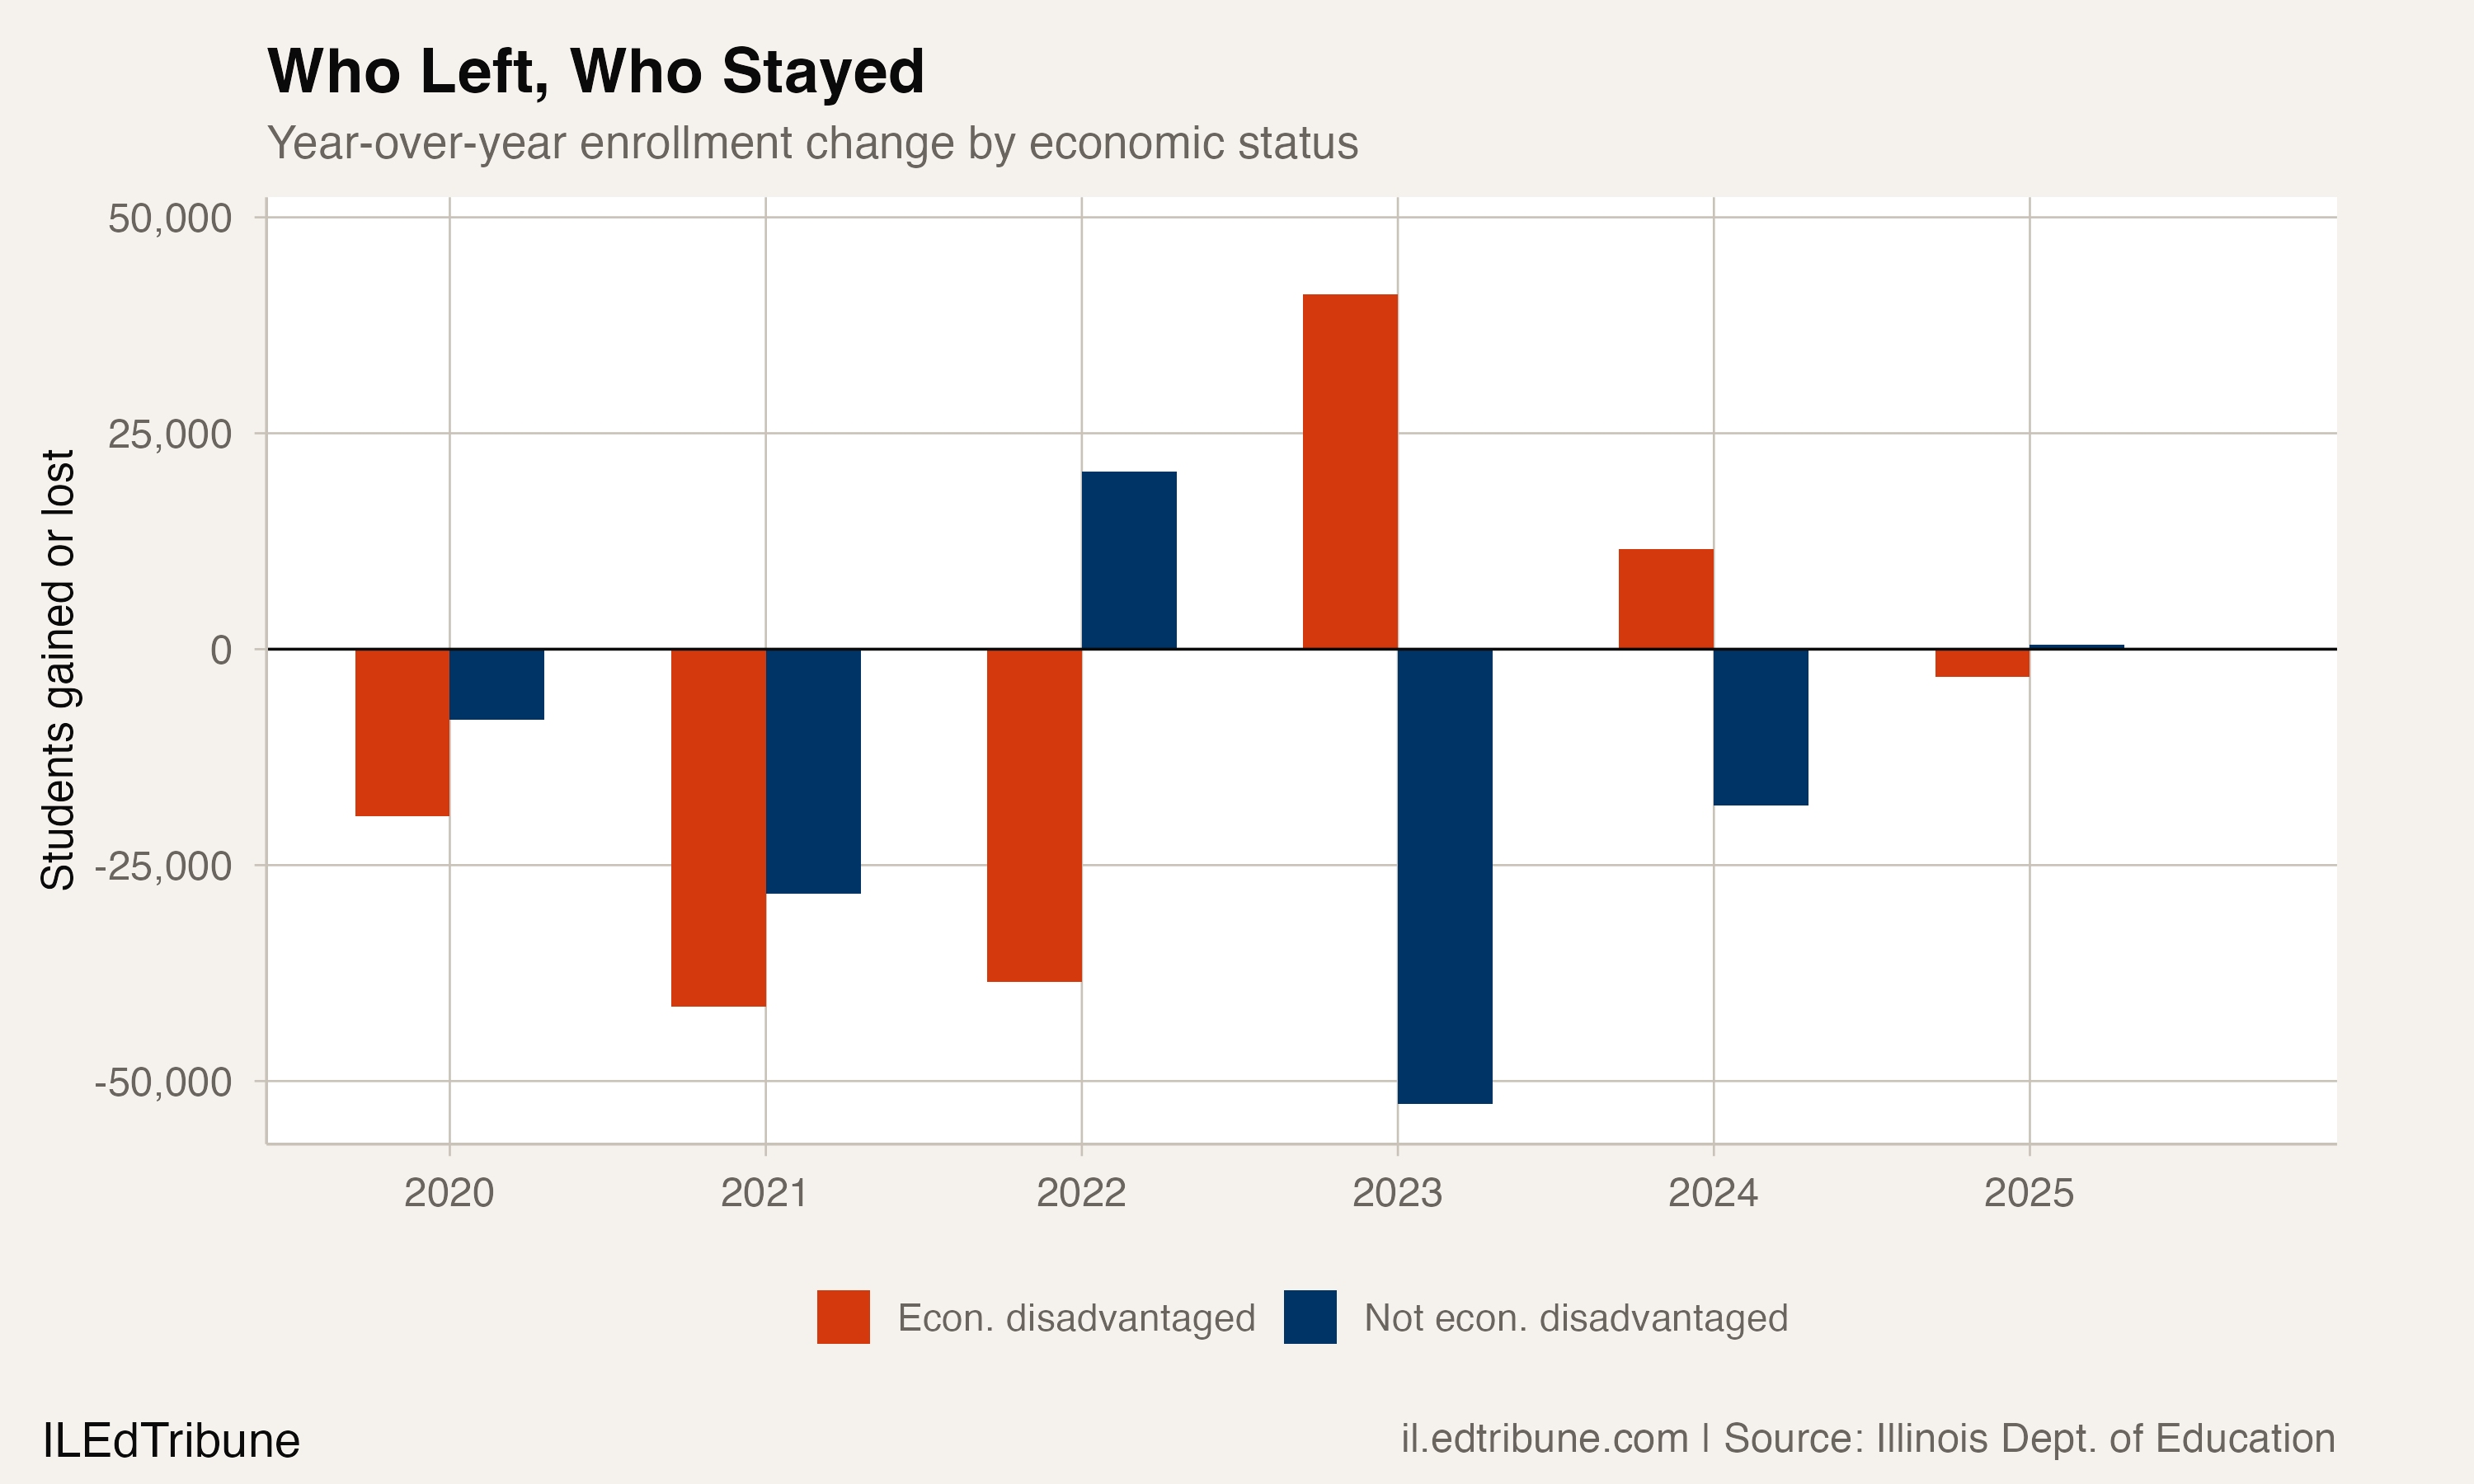
The most visible feature of the trend line is the V-shaped drop in 2022 and recovery in 2023, a 2.5-percentage-point swing in a single year. That swing represents 41,081 students reclassified as economically disadvantaged in 2023 while total enrollment simultaneously fell by 11,535.
The pattern is consistent with expanded participation in the federal Community Eligibility Provision. CEP allows schools where at least 40% of students qualify for subsidized meals to offer free meals to all enrolled students without requiring household applications. In September 2023, the USDA finalized a rule lowering the qualifying threshold from 40% to 25%, a change that made thousands more schools eligible nationwide. Illinois also passed the Healthy School Meals for All Program in August 2023, requiring districts to seek CEP funding before implementing the state's universal meals law.
Individual district data reinforces this interpretation. Rockford SD 205, the state's fifth-largest district, saw its economically disadvantaged rate swing from 64.0% in 2019 to 45.2% in 2022 and then to 68.3% in 2023. Round Lake CUSD 116 followed a similar arc, dropping from 74.1% to 59.6% and jumping to 84.0%. These are not plausible shifts in actual household income over 12 months. They are artifacts of how eligibility is measured, reflecting when districts adopt CEP or direct certification changes rather than when families gain or lose income.
This means the current 49.7% rate should be interpreted cautiously. The underlying level of economic hardship among Illinois students may not have changed as dramatically as the trend line suggests. What changed was how many of those students were captured by the classification system.
Two states in one
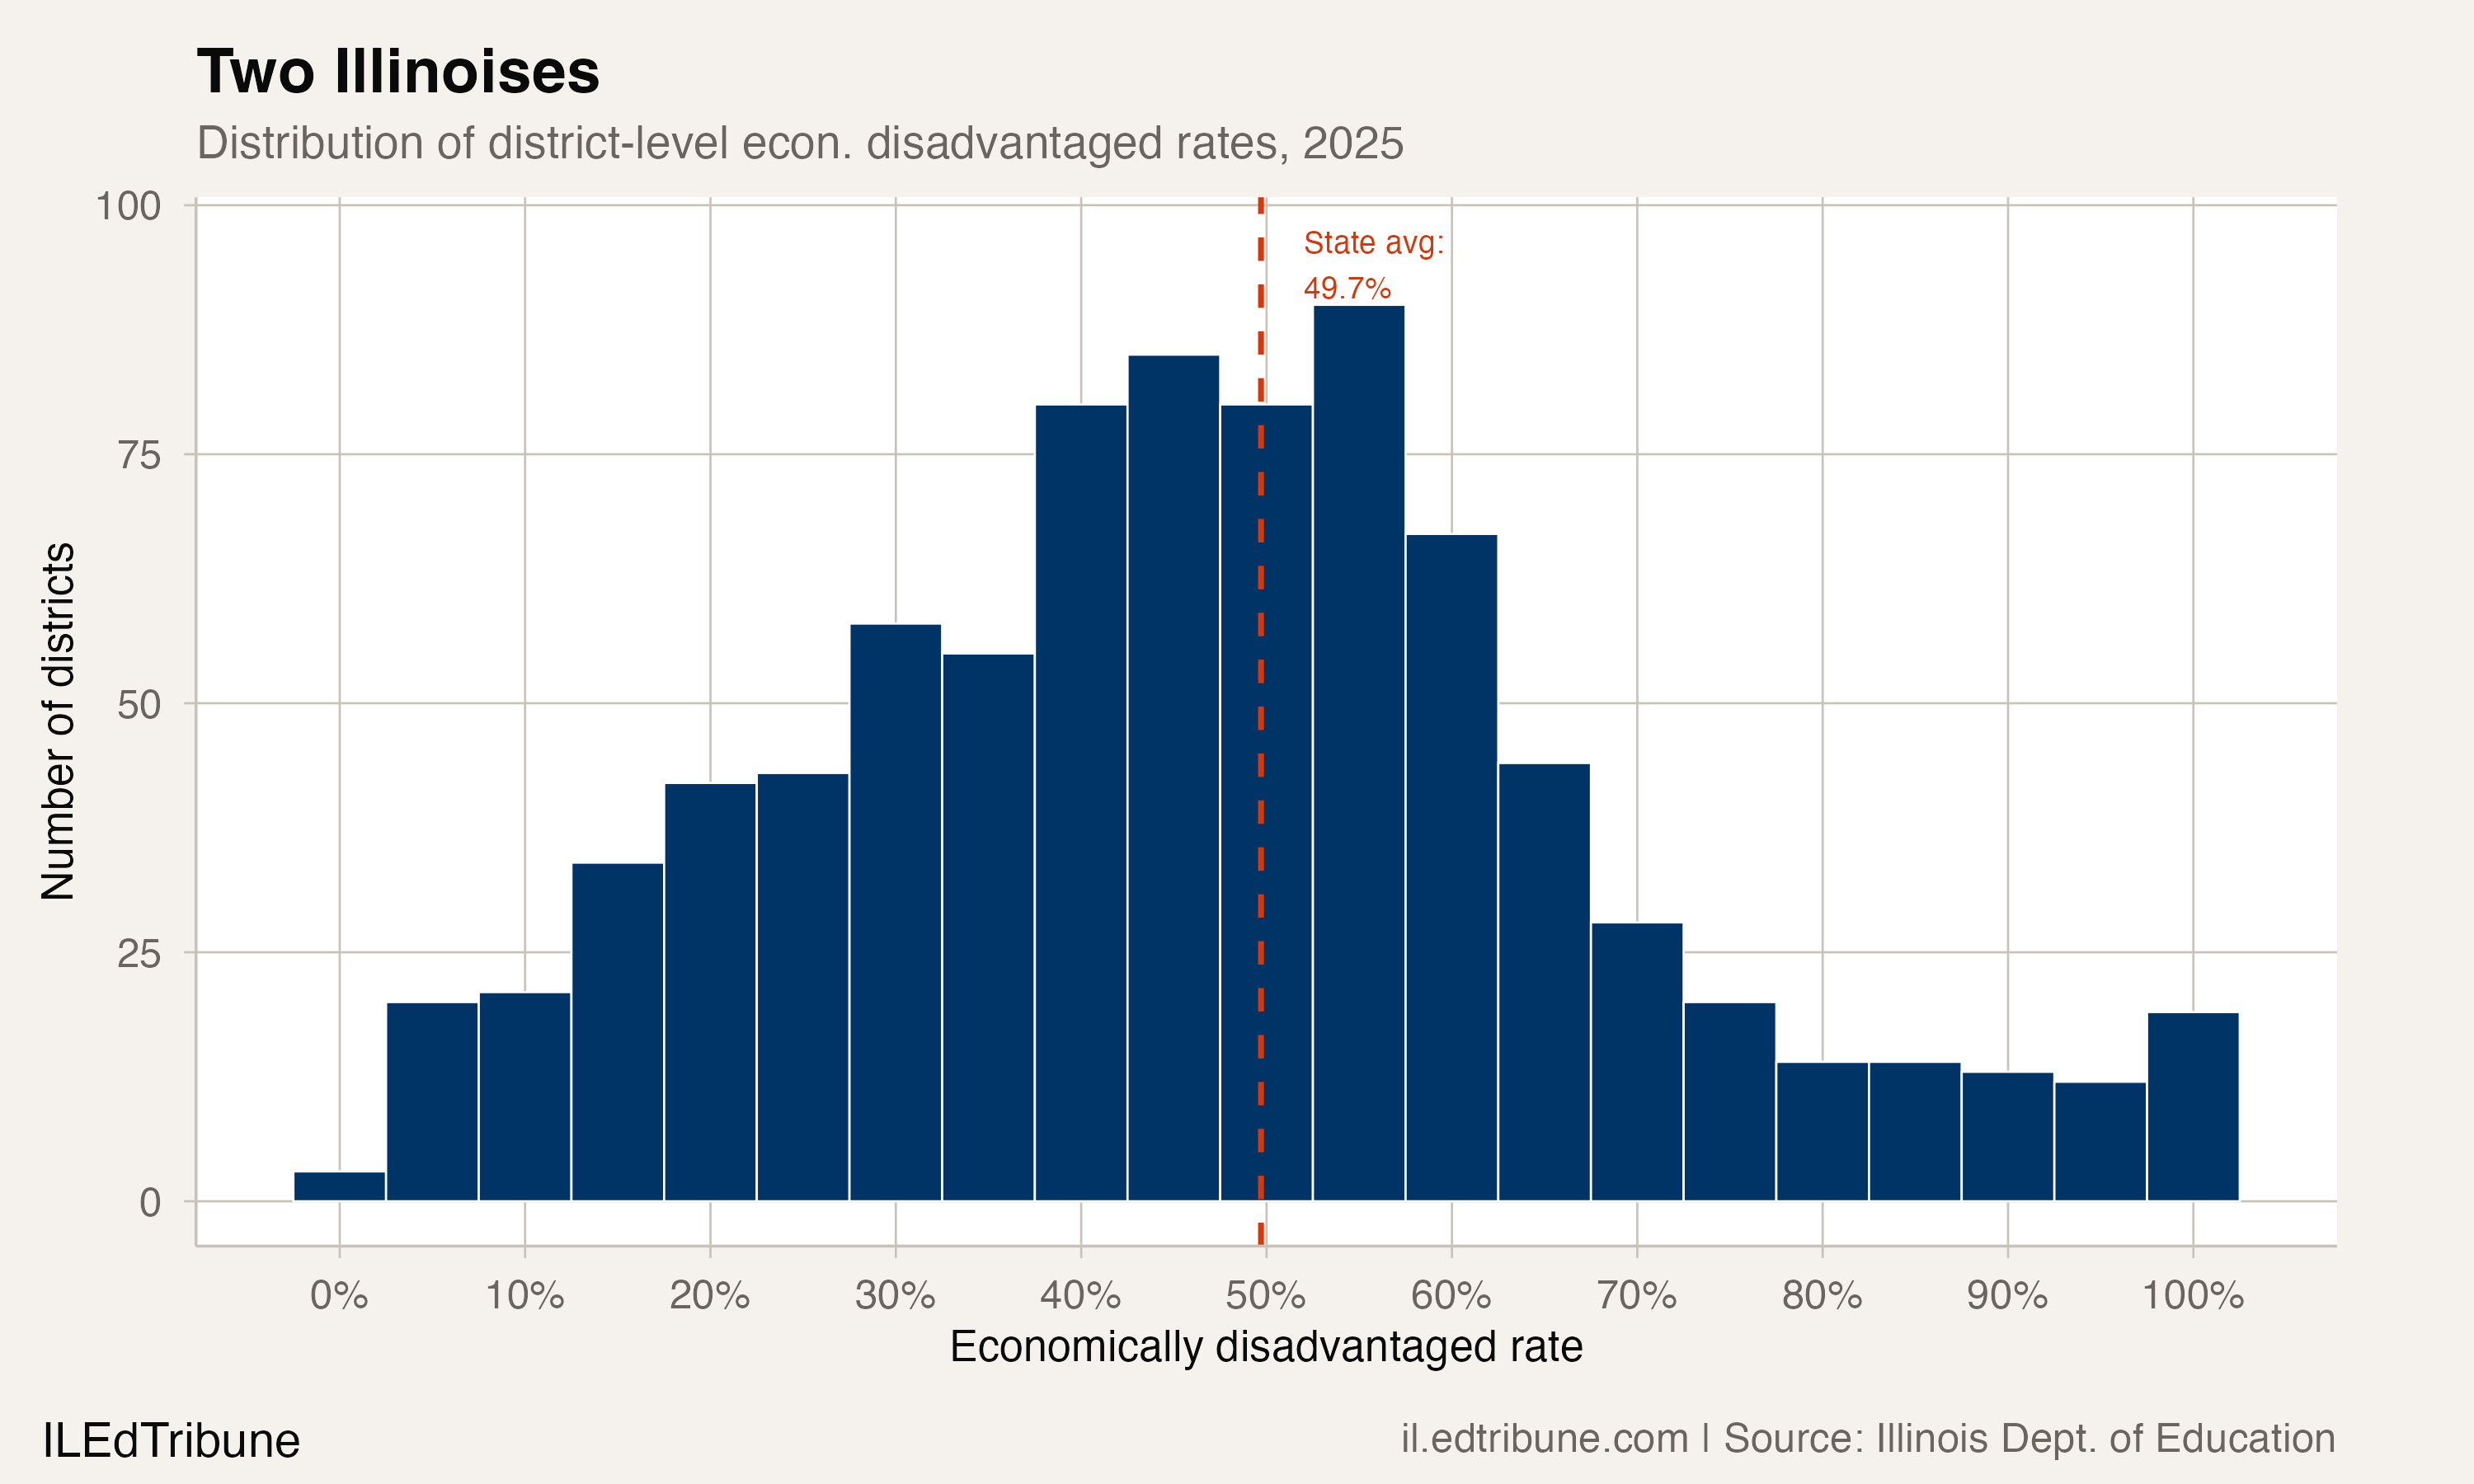
The statewide average masks enormous variation. Among Illinois's 842 districts reporting economically disadvantaged data in 2025, the median rate is 46.3%. The 10th percentile sits at 18.0% and the 90th at 73.7%, a 55.7-percentage-point gulf.
The concentration is stark: 82 districts report rates above 75%, and 40 of those exceed 90%. At the other end, 31 districts report rates below 10%. The top quintile of districts by rate (168 districts, all above 62.3%) accounts for 501,254 economically disadvantaged students. The bottom quintile (169 districts, all below 28.0%) accounts for 72,994, about one-seventh as many.
What the funding formula sees
Illinois's evidence-based funding formula, enacted in 2017, was designed to address exactly this kind of concentration. Districts with higher shares of low-income students, English learners, and students with disabilities receive more state funding to close the gap between their resources and what the formula calculates they need.
The formula has made progress. In its first year, 430 districts fell below 70% of their adequacy target. By 2025, that number had fallen to 49. Since 2019, state investment in evidence-based funding has grown from $6.8 billion to $8.6 billion, with 89% of initial new funding directed to the neediest tier of districts.
But the formula is running behind schedule. The original promise was to adequately fund all schools by 2027. Current projections push that date to somewhere between 2034 and 2038, depending on the annual appropriation. Chicago Public Schools alone, where 73.8% of 323,047 students are economically disadvantaged, is underfunded by approximately $1.2 billion under the formula's own calculations.
The gap among the largest districts
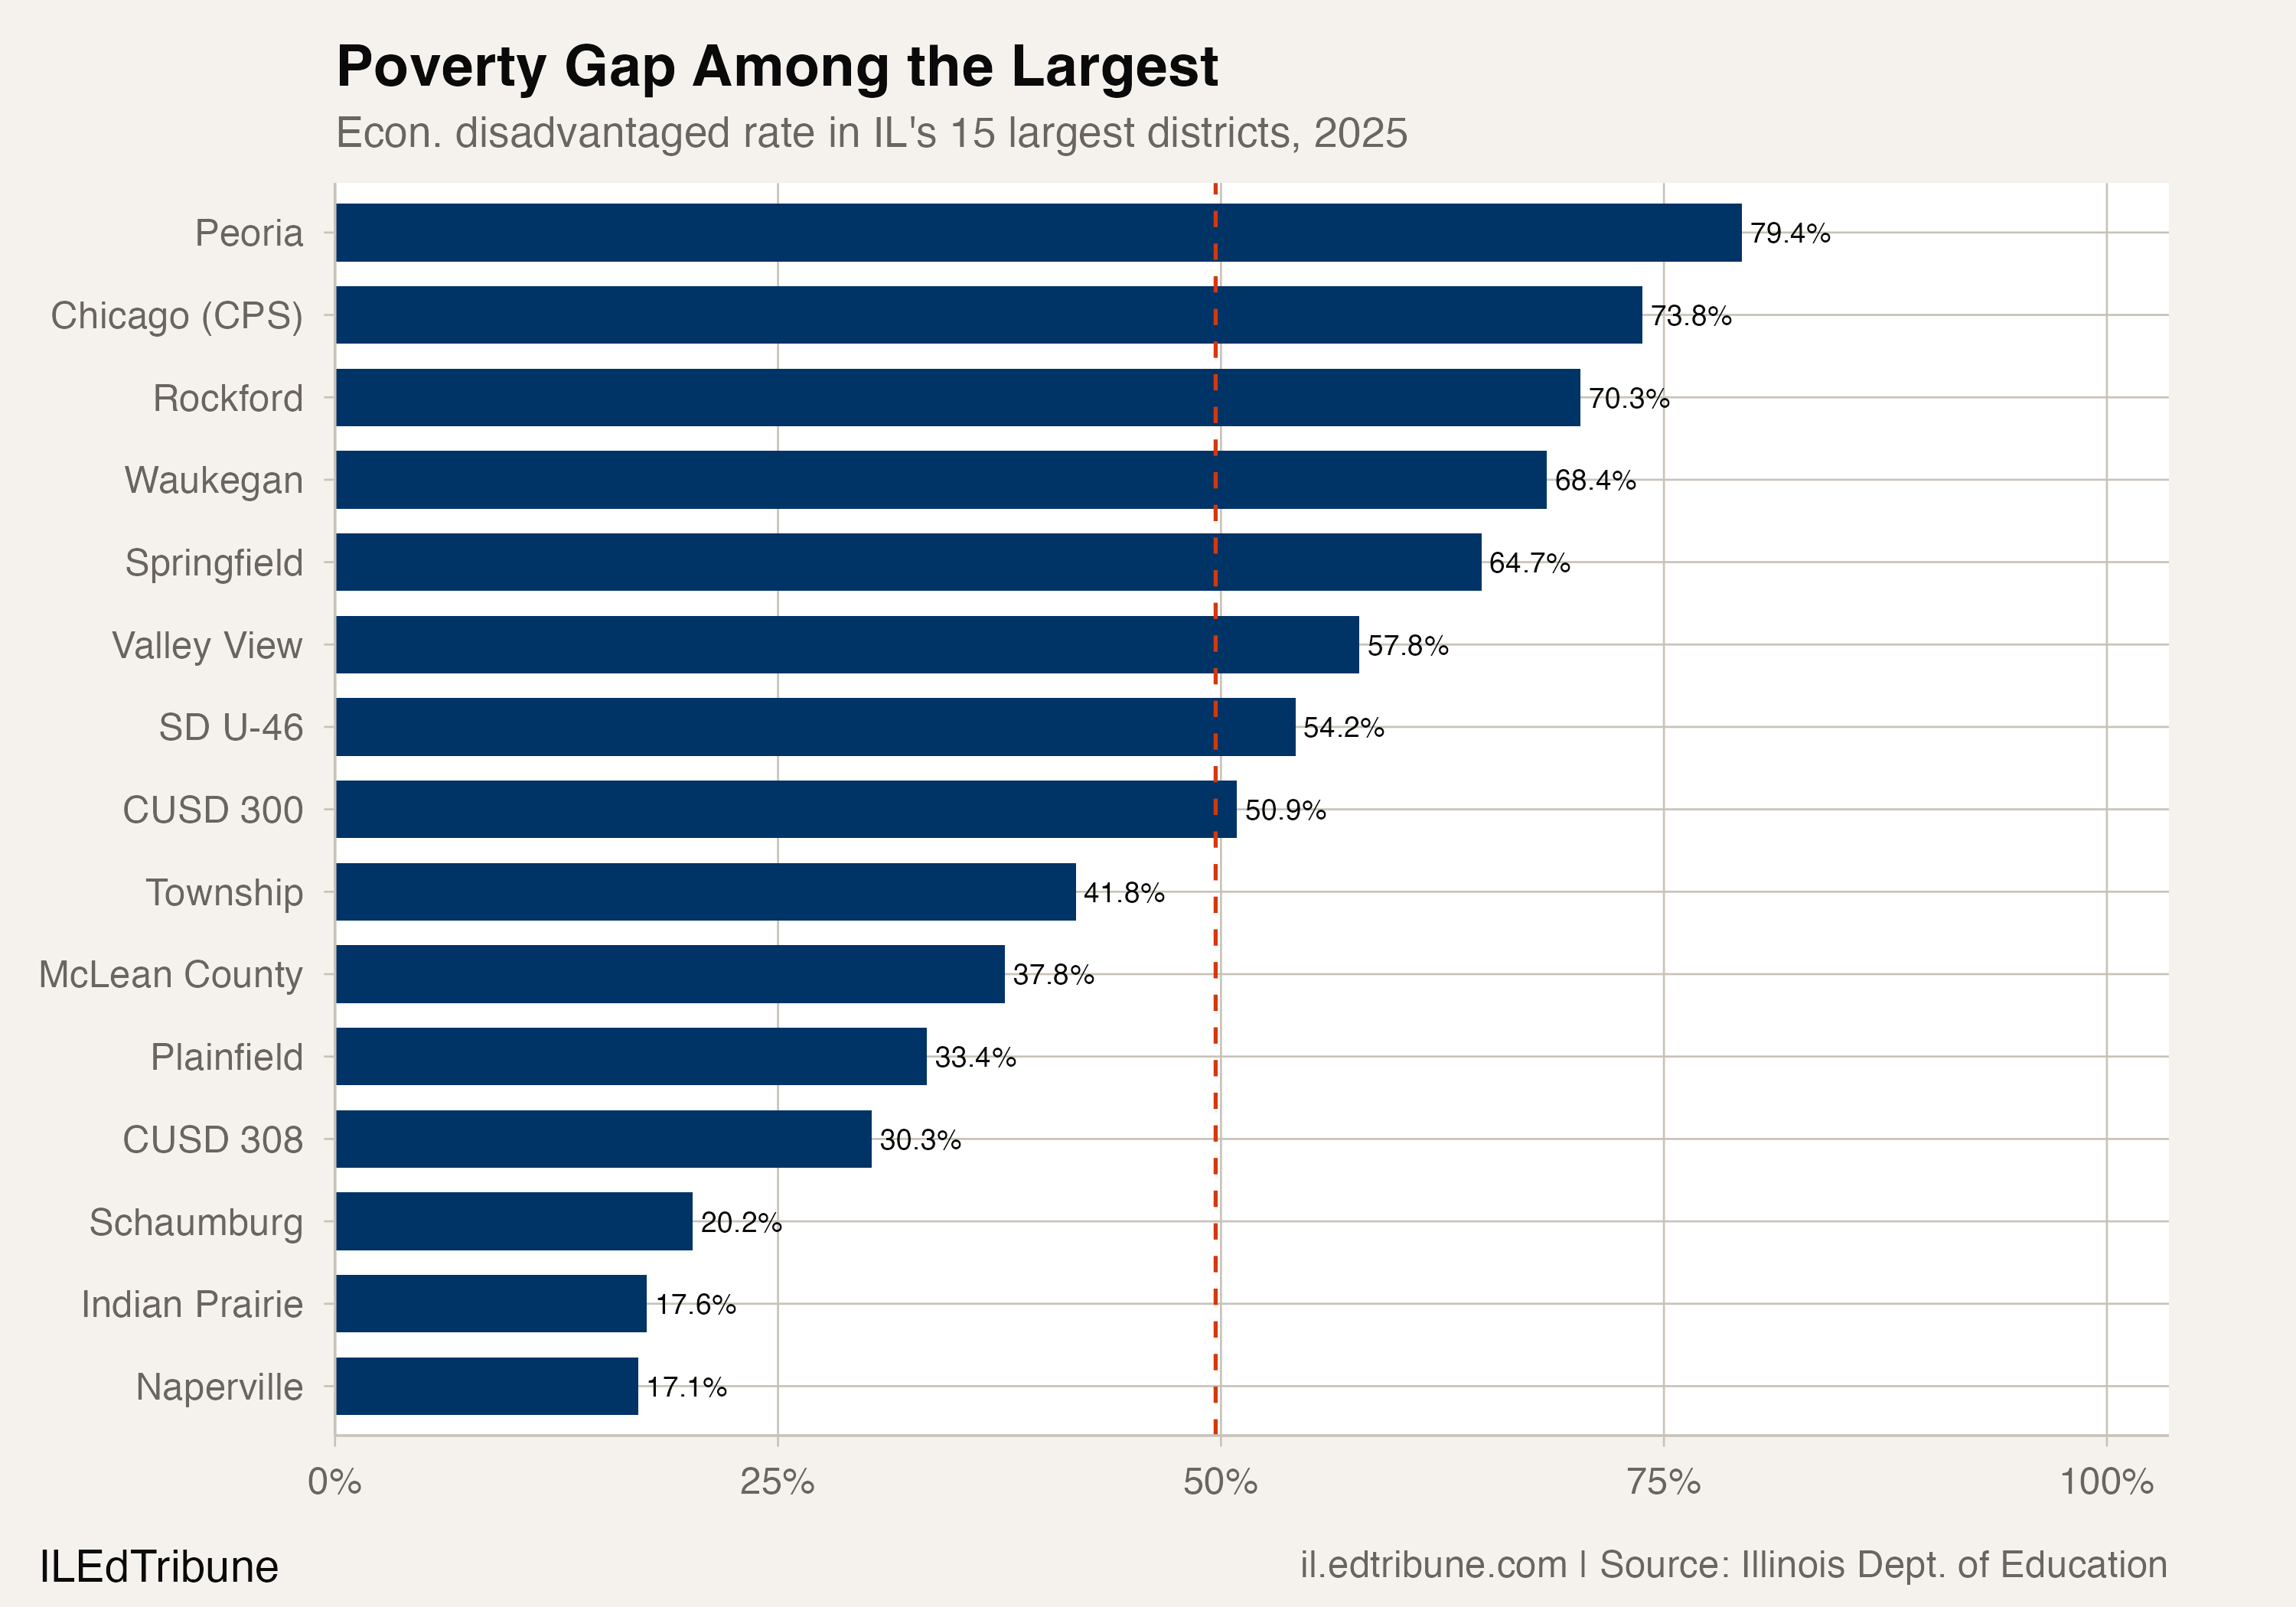
Among the 15 largest districts, the economically disadvantaged rate ranges from 17.1% in Naperville CUSD 203 to 79.4% in Peoria SD 150. Eight of these 15 districts are above the state average; seven are below. The split tracks geography closely. Peoria, Chicago, Rockford, Waukegan, and Springfield, all urban centers, cluster above 64%. Naperville, Indian Prairie, Schaumburg, and CUSD 308, all suburban, sit below 33%.
Several of these suburban districts have seen their rates climb. CUSD 300 rose from 42.2% in 2019 to 50.9% in 2025, crossing the majority-disadvantaged threshold. Plainfield SD 202 went from 27.0% to 33.4%. SD U-46, serving the Elgin area, dropped slightly from 60.6% to 54.2%, but remains more than three times the rate of its neighboring Schaumburg district.
What reporting suggests
The intersection of high poverty concentration and underfunding has drawn sustained attention from Illinois fiscal analysts.
"Generations of public school students will be deprived of their right to a quality, fully-funded public education and we should all see that as being unacceptable." -- Elizabeth Todd-Breland, vice president of the Chicago Board of Education, via Chalkbeat Chicago, May 2024
The Center for Tax and Budget Accountability found that 63% of the formula's first round of new funding, $229 million, went to districts where at least 59% of students are low-income, confirming the formula's progressive intent. The question is whether $350 million per year in new state funding can keep pace with the structural need. At that rate, full adequacy is at least eight years away.
How to read this number
The 49.7% figure is not a poverty rate. It is an administrative classification that counts students who receive SNAP or TANF benefits, are directly certified through Medicaid, are classified as homeless, migrant, or foster children, or whose household income meets USDA guidelines for free or reduced-price meals. Changes in how aggressively districts pursue direct certification or adopt CEP can shift the number without any change in underlying economic conditions.
That said, even the most conservative reading of the data points to a system where economic disadvantage is the norm, not the exception. Nearly half of all students qualify. In 363 of 842 districts, the rate exceeds 50%. In CPS, nearly three out of four students qualify. The 14.1% child poverty rate measured by the Census Bureau captures only the deepest end of economic hardship. The school-based measure captures a much broader band of financial stress.
The practical question is what happens next. Illinois is losing enrollment across the board, but it is losing non-disadvantaged students faster. If that differential persists, the state could cross the 50% threshold soon, though reclassification effects make the exact timing uncertain. The funding formula was built for a system approaching that composition. Whether it arrives funded or underfunded will shape outcomes for the 918,734 students already there.
Detailed code that reproduces the analysis and figures in this article is available exclusively to EdTribune subscribers.
Discussion
Sign in to join the discussion.
Loading comments...