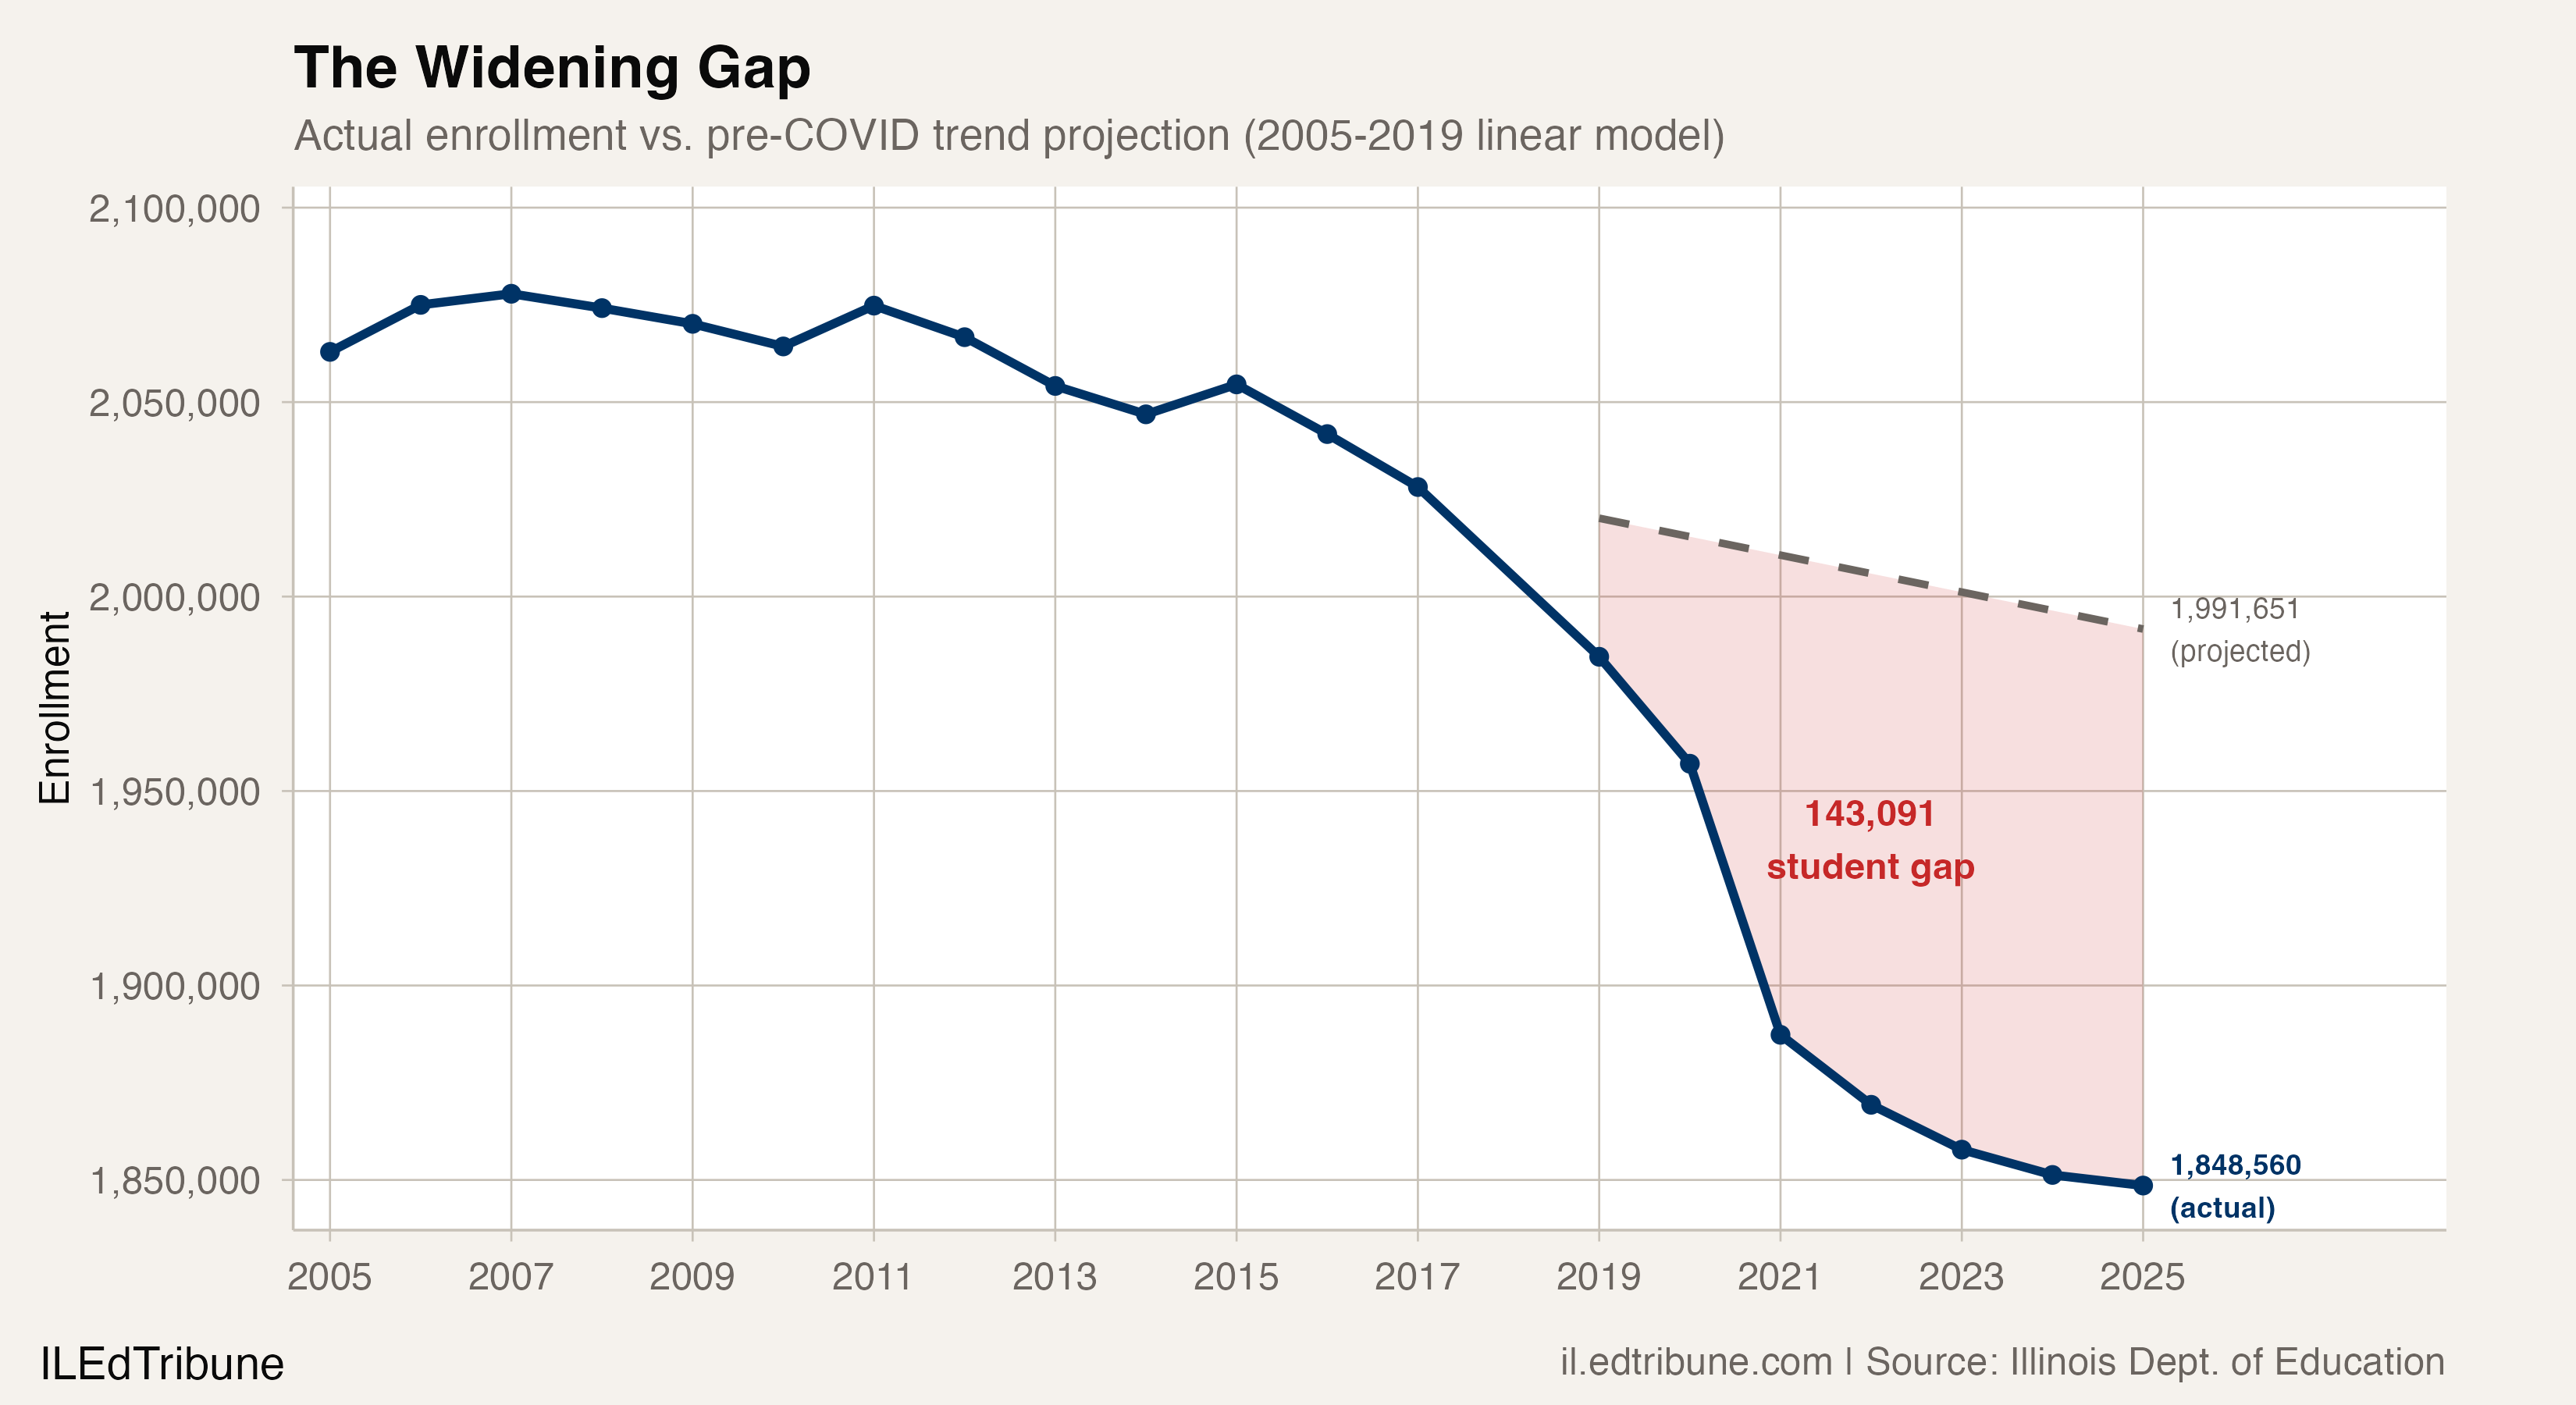
Illinois was losing students before the pandemic. The state's enrollment had been sliding by roughly 4,750 students per year since 2005, a pace so steady it traced nearly a straight line. Had nothing changed, Illinois would have about 1,991,651 students in 2024-25. Instead, it has 1,848,560. The gap between where the state was headed and where it landed is 143,091 students, equivalent to emptying every public school seat in Elgin, Rockford, Naperville, and Plainfield combined.
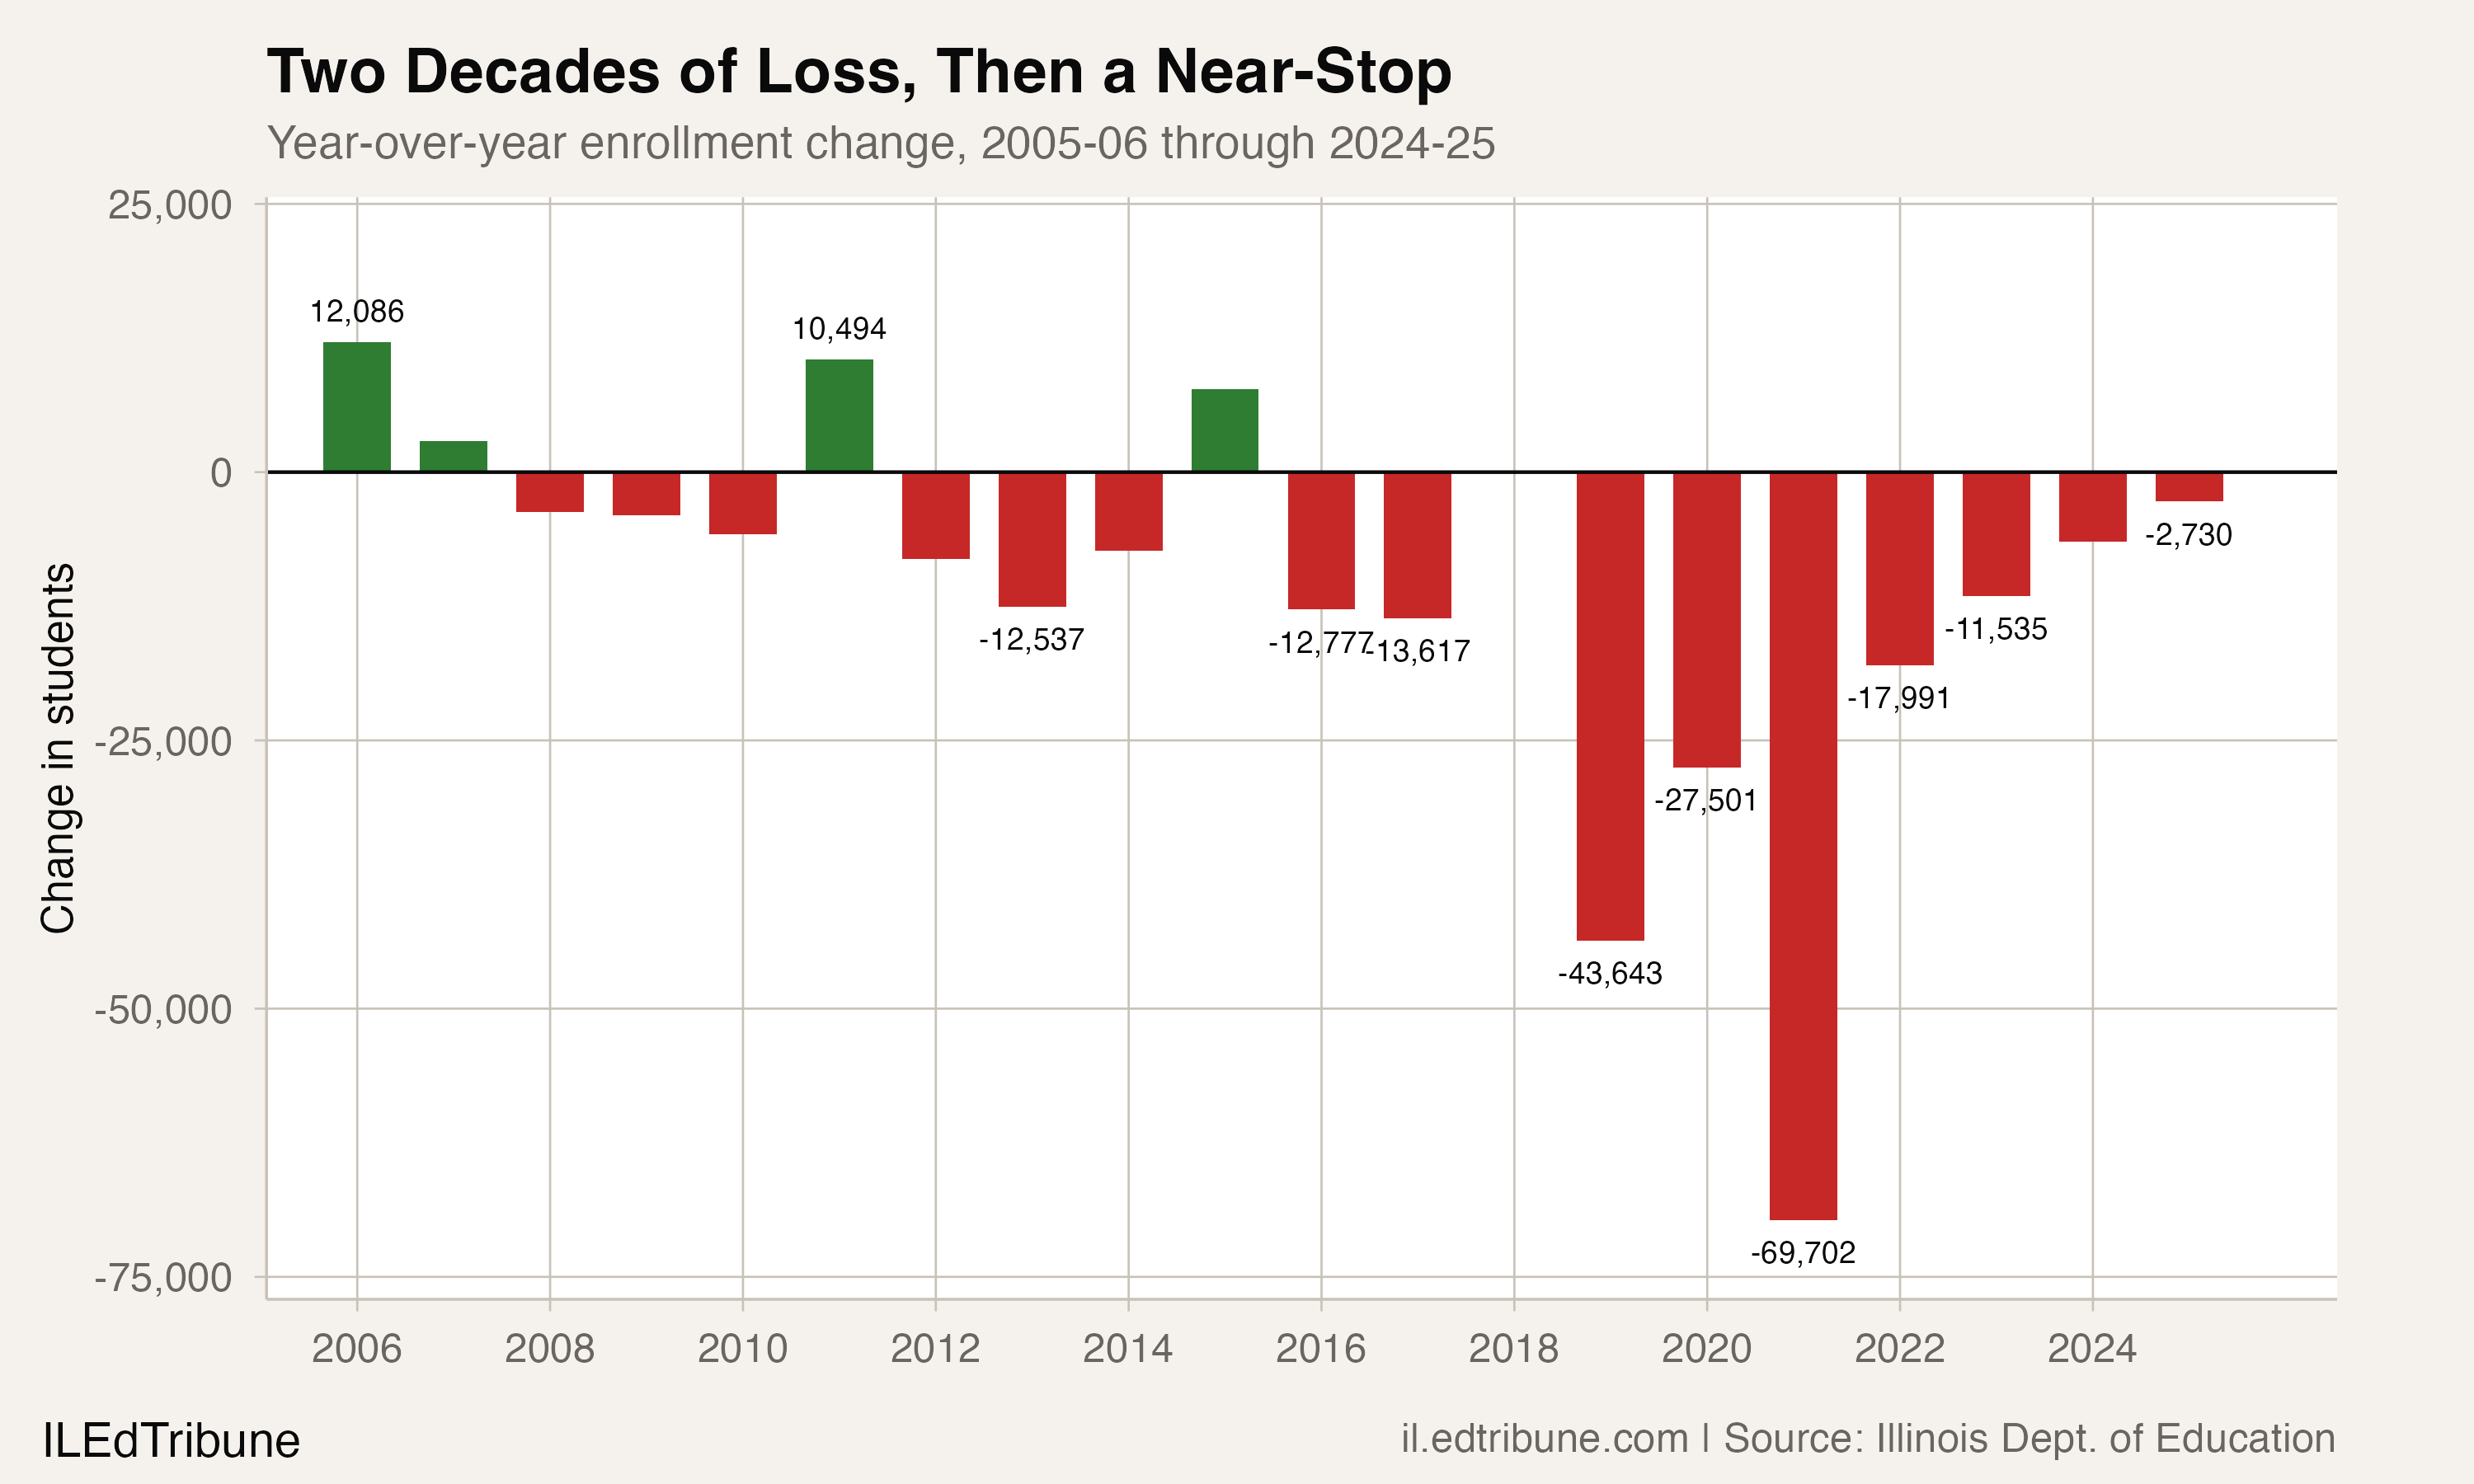
The gap is not new. It ripped open in 2020-21, when 69,702 students vanished from the rolls in a single year. But a gap that was growing by tens of thousands of students per year has now stabilized. In 2024-25, Illinois lost just 2,730 students, the smallest annual decline since 2008-09. The state is approaching a plateau, but at a level that no one planned for.
The arithmetic of a 143,000-student hole
Before COVID, Illinois was declining at a manageable pace. The pre-COVID trend (a linear fit from 2005 through 2019) had a slope of negative 4,749 students per year. That rate already accounted for falling birth rates and domestic outmigration. The pandemic blew through that floor.
The gap from the pre-COVID projection opened rapidly: 58,377 students below the line in 2019-20, then 123,331 in 2020-21. By 2022-23 it reached 143,359, and it peaked at 145,110 in 2023-24. In 2024-25, for the first time, the gap narrowed slightly to 143,091.
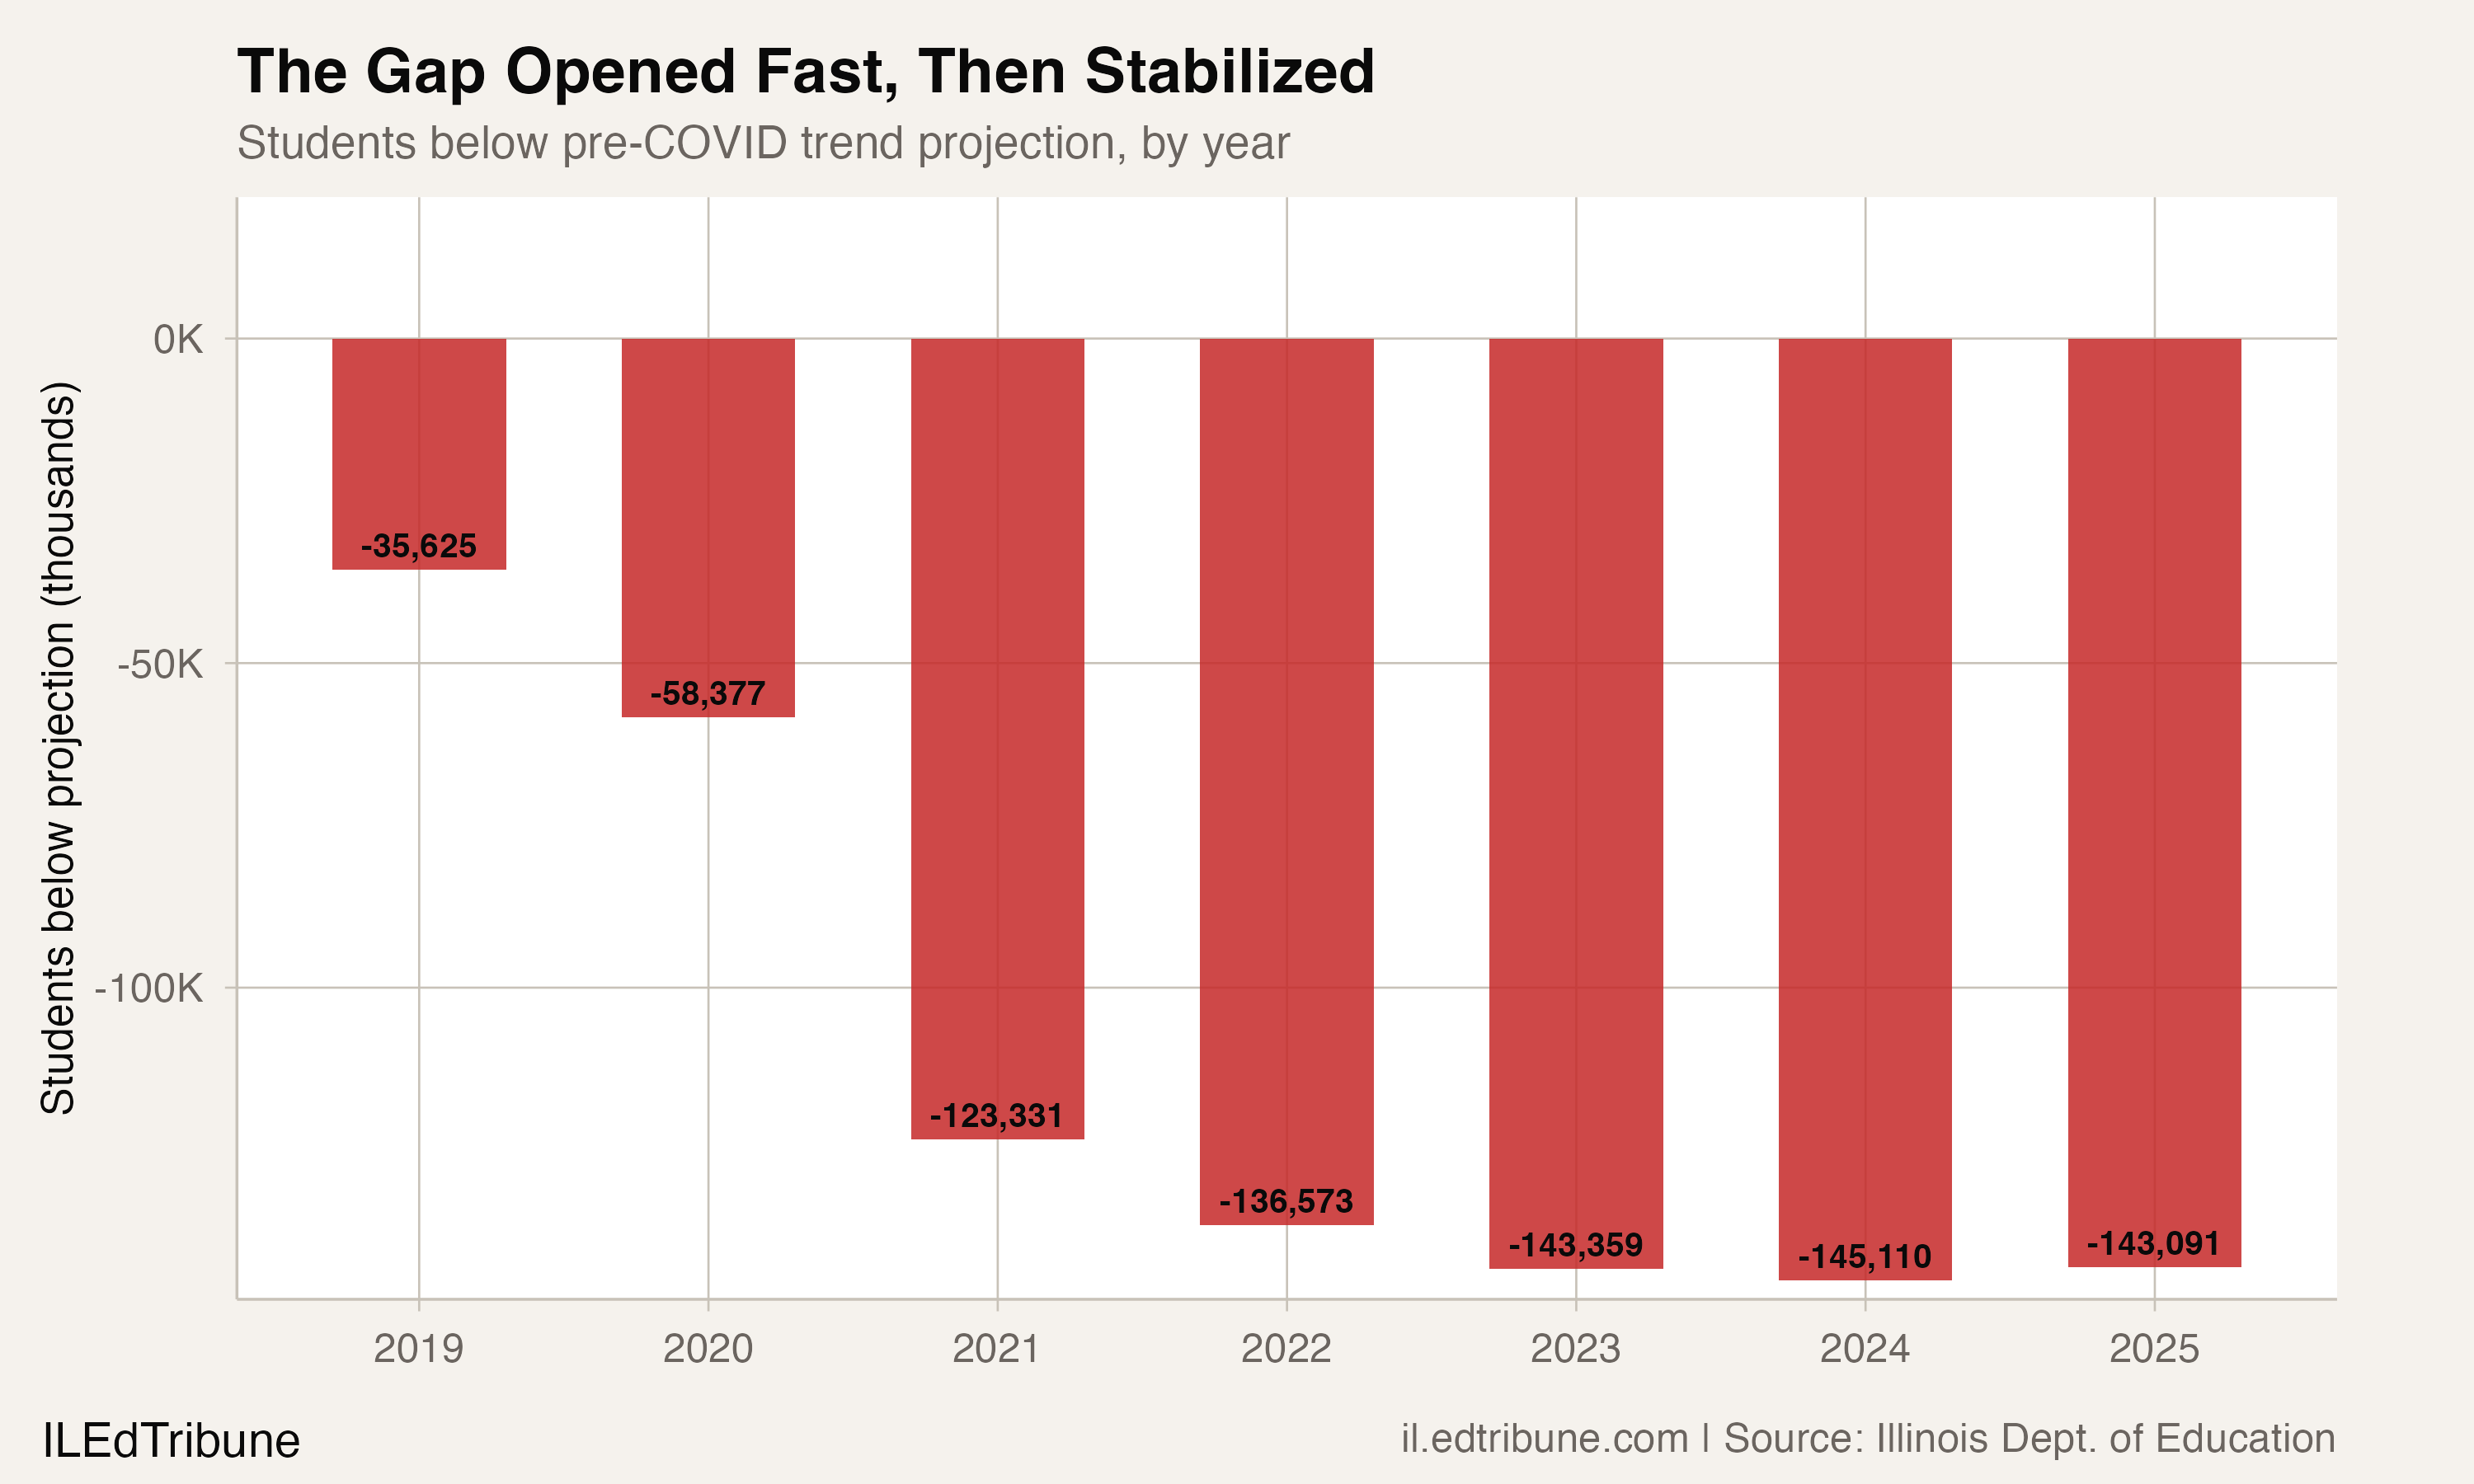
That narrowing is modest: 2,019 students, or 1.4% of the gap. It happened because Illinois lost fewer students in 2024-25 (-2,730) than the trend line predicted it would have lost anyway (-4,749). The state is still shrinking, just more slowly than its own historical trajectory. It is not recovering.
Deceleration is not recovery
The distinction matters for districts planning budgets. A -39.9% COVID recovery rate means Illinois has not only failed to regain the 97,203 students it lost between 2018-19 and 2020-21, it has lost an additional 38,756 since the trough. Every year since 2020-21 has been worse than the year before it in absolute terms:
| Year | Enrollment | Change |
|---|---|---|
| 2018-19 | 1,984,519 | -- |
| 2019-20 | 1,957,018 | -27,501 |
| 2020-21 | 1,887,316 | -69,702 |
| 2021-22 | 1,869,325 | -17,991 |
| 2022-23 | 1,857,790 | -11,535 |
| 2023-24 | 1,851,290 | -6,500 |
| 2024-25 | 1,848,560 | -2,730 |
The annual losses are shrinking quickly. The 2,730 students lost in 2024-25 is 96% smaller than the 69,702 lost at the trough. But the cumulative damage is permanent: Illinois would need to add 135,959 students to return to its 2018-19 level, or 143,091 to match where its pre-COVID trajectory would have placed it.
Three forces behind the gap
The 143,000-student gap is not attributable to a single cause. Three forces are operating simultaneously, and they affect different parts of the state differently.
Outmigration. Illinois lost more than 40,000 residents to other states in the most recent Census year, ranking behind only California and New York in domestic migration losses. Census estimates show the state has 172,000 fewer residents under 18 since 2020, a 6% decline that is the largest percentage drop in the nation. Families with school-age children are disproportionately represented among those leaving, and the state's overall population has only stayed roughly flat because international immigration has offset domestic departures.
Fewer births. The connection between birth rates and enrollment operates on a five-year lag, and births in Illinois have been falling since the Great Recession. The National Center for Health Statistics data shows that the decline in kindergarten-age cohorts has been feeding through the enrollment pipeline for over a decade. This structural factor was already embedded in the pre-COVID trend line. The gap above it reflects forces beyond demographics alone.
Pandemic displacement. The sharpest single-year loss, 69,702 students in 2020-21, was far larger than birth rates or migration patterns can explain in a single year. Some students shifted to private schools, homeschooling, or left the state. The fact that enrollment has continued to fall every year since, rather than bouncing back, suggests that many of those departures were permanent.
Who the gap took
The 135,959 students Illinois has lost since 2018-19 did not leave proportionally. White students account for 125,719 of those losses, or 92.5% of the total decline, falling from 47.6% of enrollment to 44.3%. Black students lost 30,100. Hispanic enrollment grew by 4,775, Asian by 4,158, and multiracial by 7,773. The combined gains of those three groups (16,706) offset barely 10.7% of the white and Black losses.
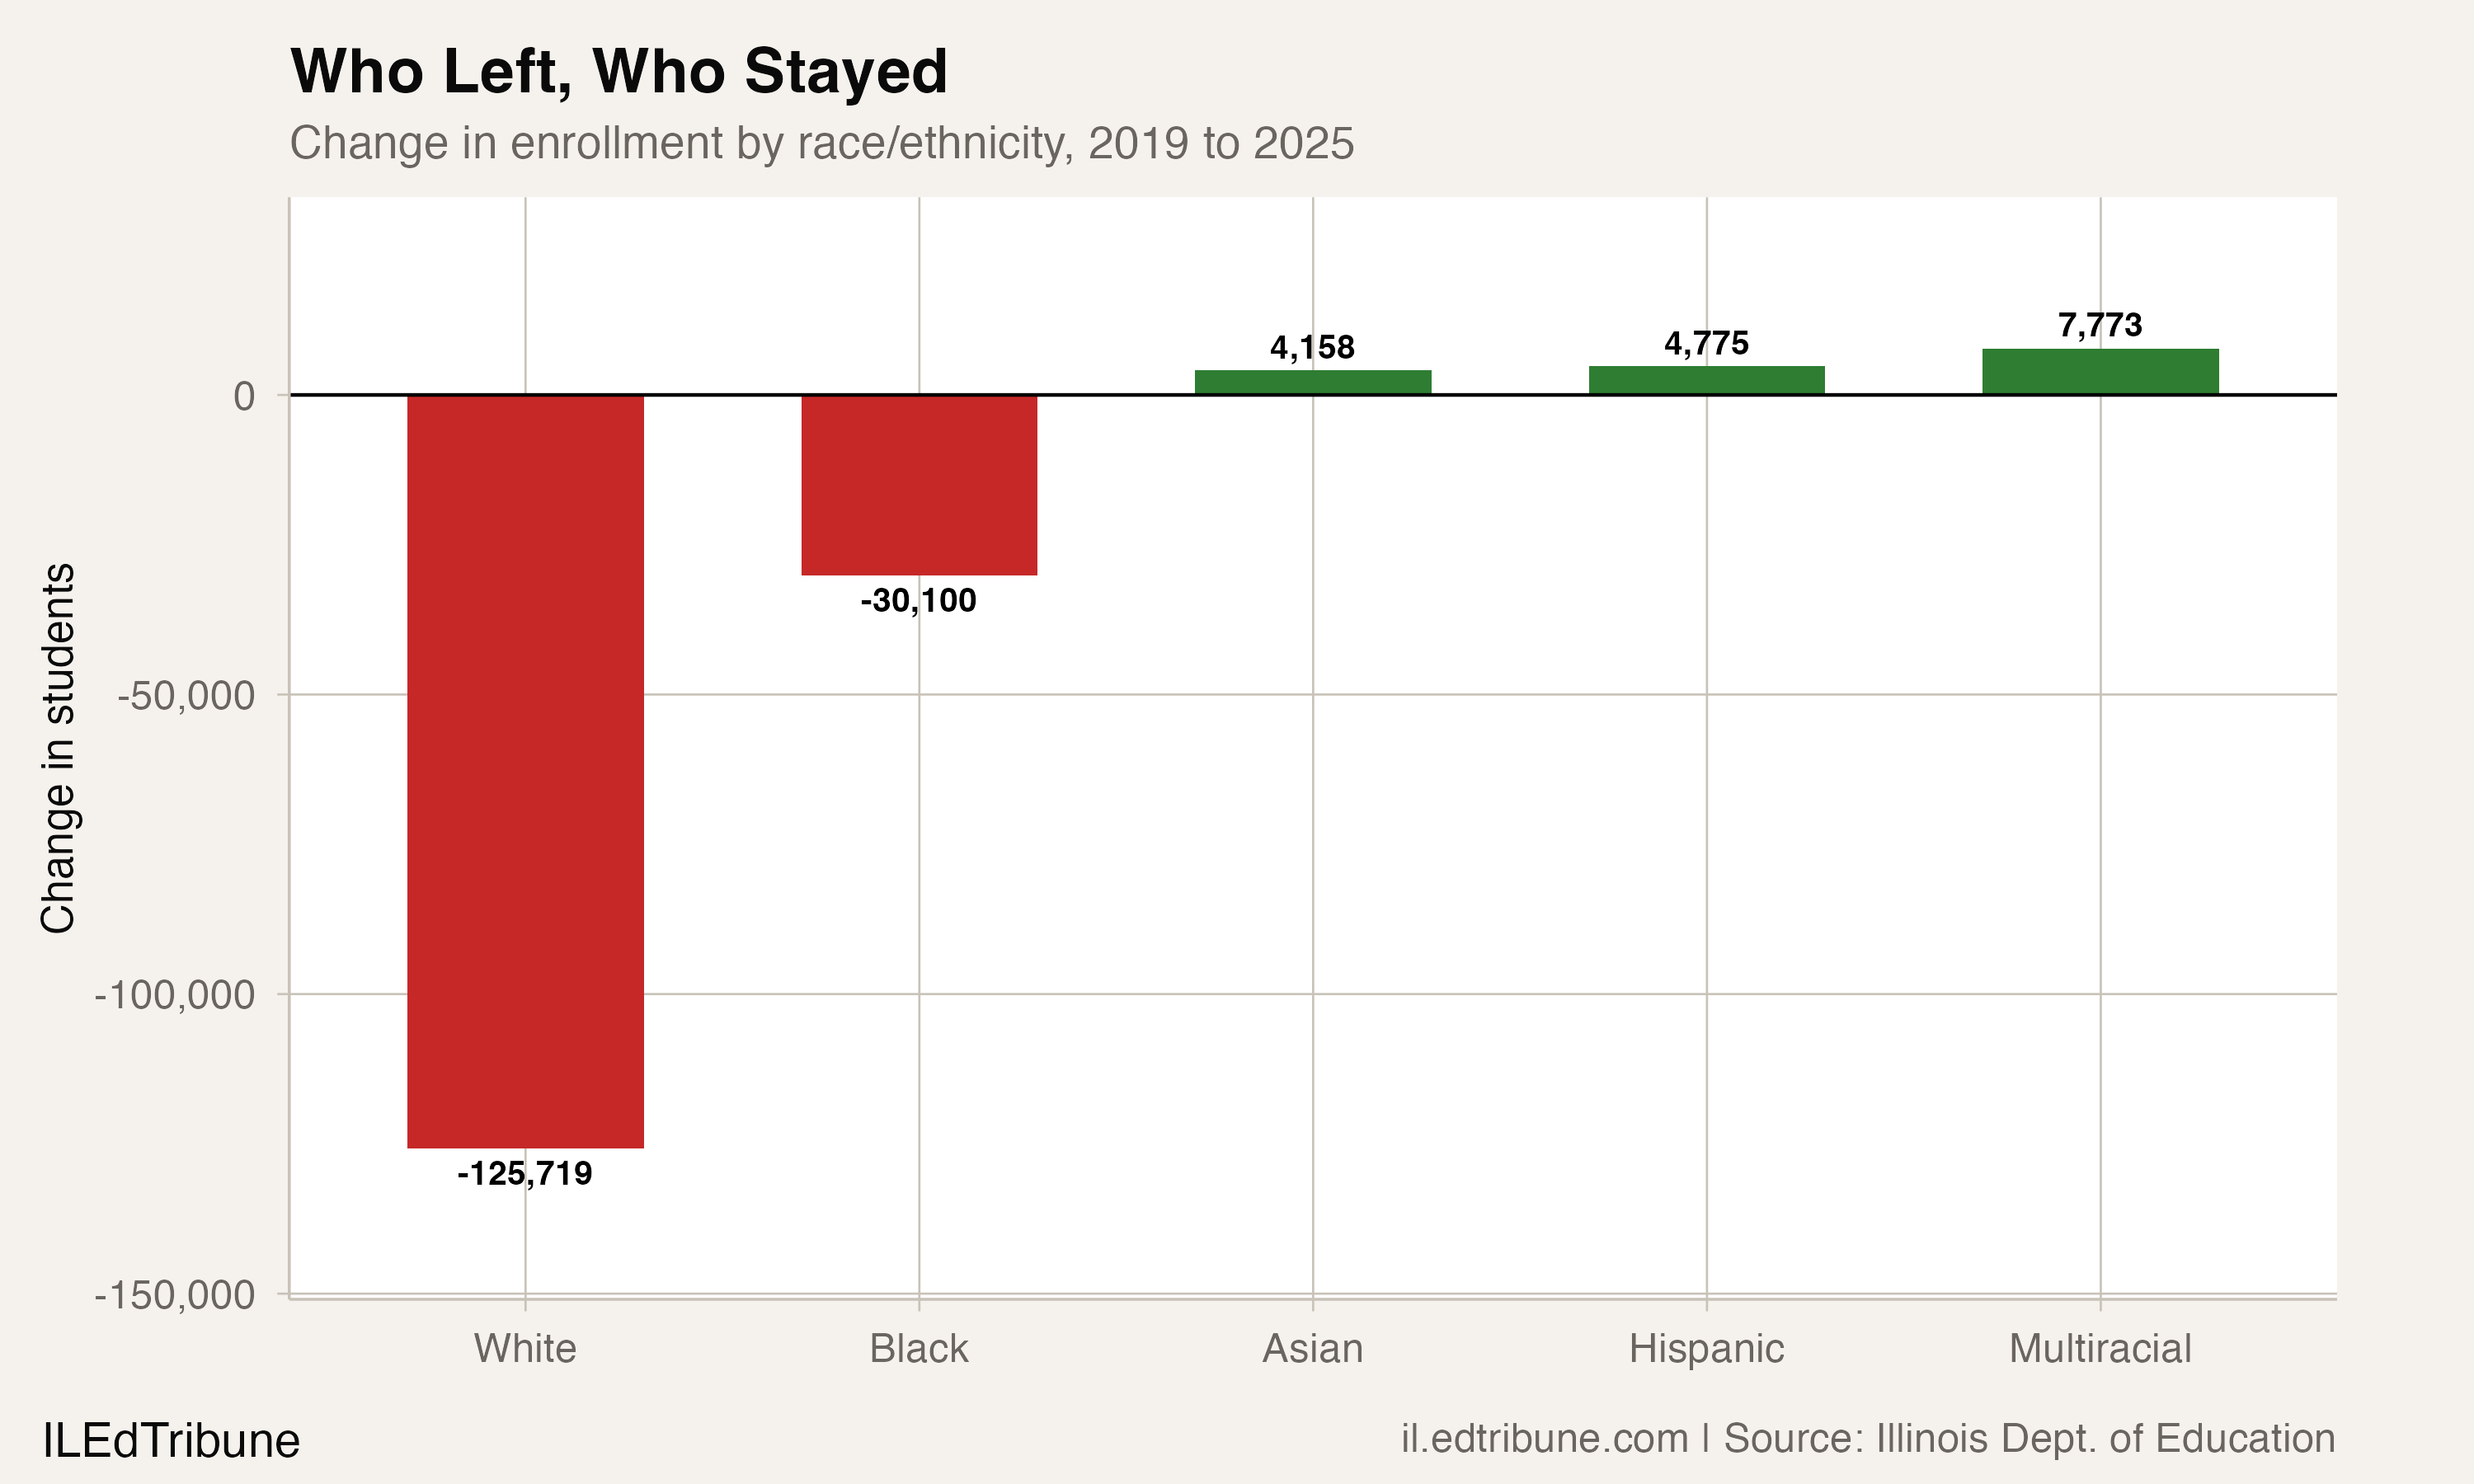
Separately, the English learner population, which overlaps heavily with Hispanic enrollment, grew by 83,371 students (34.7%) over the same period, rising from 12.1% to 17.5% of all students. A total of 62,644 newcomer students arrived in Illinois schools over the past two years alone.
The result is a school system that is shrinking and simultaneously transforming. Districts built for the students who left now serve students who need different instructional programs at higher per-pupil cost.
What reporting suggests
The newcomer surge has strained district capacity across the Chicago metro area. ISBE Chief of Staff Kimako Patterson told state legislators in April 2024 that the state's schools had enrolled 62,644 newcomer students in just two years.
"Over 40 percent of our students qualify for English learner services, and the numbers are continuing to grow." -- Jeannie Stachowiak, Superintendent, North Palos SD 117, NPR Illinois, April 2024
Districts sought $188 million in state funding to support those students, against ISBE's initial $35 million budget request. State Rep. Fred Crespo noted that "some school districts have seen their population go up by 10 percent" in a single year, even as the state's total enrollment continued to fall.
The dynamic is playing out in reverse in Chicago. CPS enrollment dropped 2.8% to 316,224 in fall 2025, erasing gains from the prior two years that had been driven by migrant family arrivals. With federal immigration enforcement intensifying, Interim CEO Macquline King reported that "enrollment decreased across a majority of grades and most student groups." CPS lost 40,907 students between 2018-19 and 2024-25, accounting for 30.1% of the state's total loss despite representing only 17.5% of enrollment.
Four out of five districts are smaller
The losses are not concentrated in a few large systems. Of 856 districts that can be compared across the 2018-19 and 2024-25 data, 704 (82.2%) lost students and 149 (17.4%) gained. Among those with at least five years of data, 297 districts, or 34.6%, are at their all-time enrollment low in 2024-25. Seven districts have been declining for 12 consecutive years without a single year of growth.
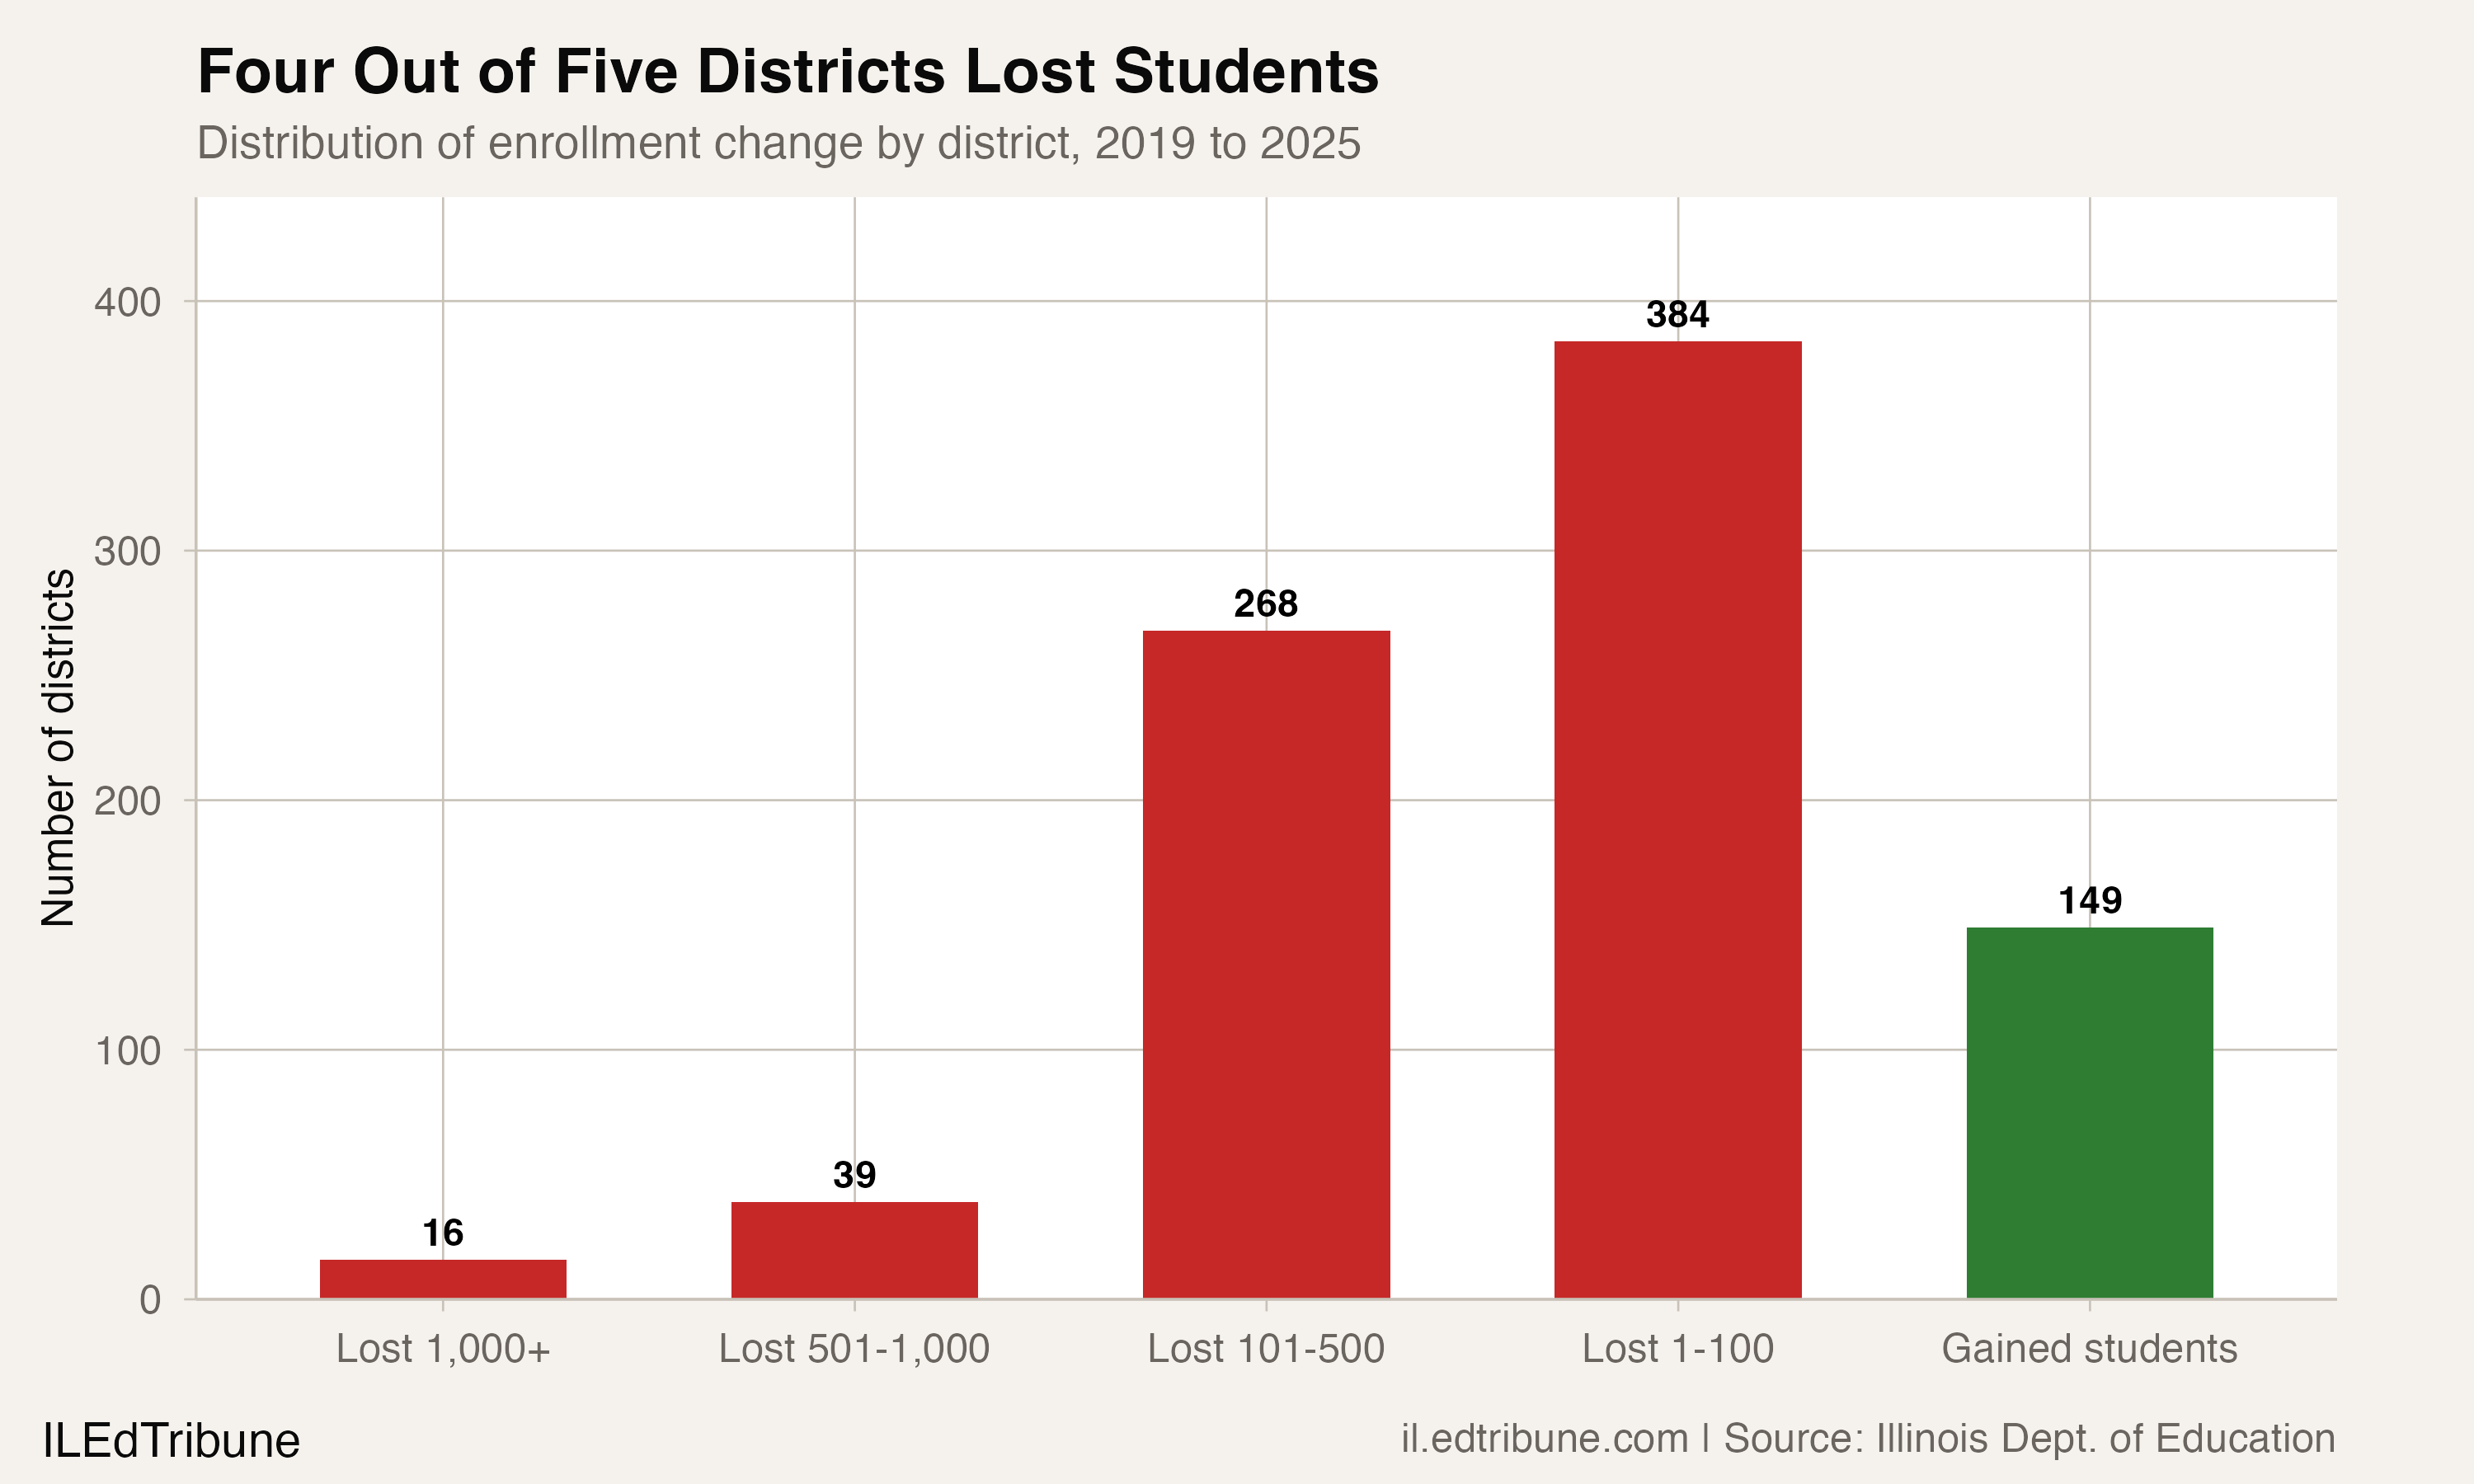
The largest absolute losses outside Chicago are concentrated in suburban collar counties: SD U-46 in Elgin (-4,870), Cicero SD 99 (-2,649), Waukegan CUSD 60 (-2,321), and Plainfield SD 202 (-2,084). The few districts growing tend to be smaller exurban systems: Yorkville CUSD 115 (+778), Central CUSD 301 (+666), and Manhattan SD 114 (+411). The pattern is consistent with families moving outward from established suburbs to newer development on the metro fringe.
The plateau ahead
Illinois enrollment is nearing a floor. At -2,730 students, the 2024-25 loss was the smallest in nearly two decades. If the deceleration pattern holds, 2025-26 could be the first year enrollment holds steady since the late 2010s. But the 143,000-student gap between where the state is and where it was headed is not closing. It is simply no longer widening.
The fiscal question is whether Illinois school finance can adjust to a system built for two million students that now serves 1.85 million. Under the state's evidence-based funding model, per-pupil dollars follow students, but fixed costs for buildings, transportation, and administration do not scale down proportionally. Districts at their all-time enrollment lows with growing shares of students who receive specialized instruction face a structural mismatch between declining revenue and rising per-pupil costs.
The 2025-26 enrollment count, due in fall 2025, will show whether the plateau is real or whether immigration enforcement and continued outmigration push the line down further. The gap may have stopped growing. Whether it starts to close depends on forces largely outside the control of the school districts left to manage it.
Detailed code that reproduces the analysis and figures in this article is available exclusively to EdTribune subscribers.
Discussion
Sign in to join the discussion.
Loading comments...