Correction and update (October 1, 2026): An earlier version of this article left DuPage County out of the collar-county totals and counted its districts as downstate, gave a count of Yorkville's Hispanic students that Illinois does not publish, and cited a planned-housing figure its source did not contain. Those errors were corrected on Sept. 30. The article has now been updated with 2025-26 enrollment, the most recent year the state has published, and with the result of Yorkville's March 2026 referendum and the measure on the November ballot; it previously described the March vote as upcoming. Illinois' 2025-26 counts come from its fall enrollment report, which counts students differently from the Report Card figures used for earlier years, so this version compares 2025-26 only with 2024-25 figures from that same fall report and ends its longer comparisons in 2024-25.
Yorkville CUSD 115↗ET spent two decades adding students. On the Illinois Report Card count it grew from 3,116 students in 2004-05 to 7,097 in 2024-25, a gain of 3,981, or 127.8%, while 483 of the 588 Illinois districts with counts at both ends, 82.1%, lost students. In 2025-26, the most recent year the state has published, that growth reversed. The state's fall enrollment count put Yorkville at 7,100 students, 74 fewer than the 7,174 it counted a year earlier. It was the district's first year-over-year drop since 2019-20.
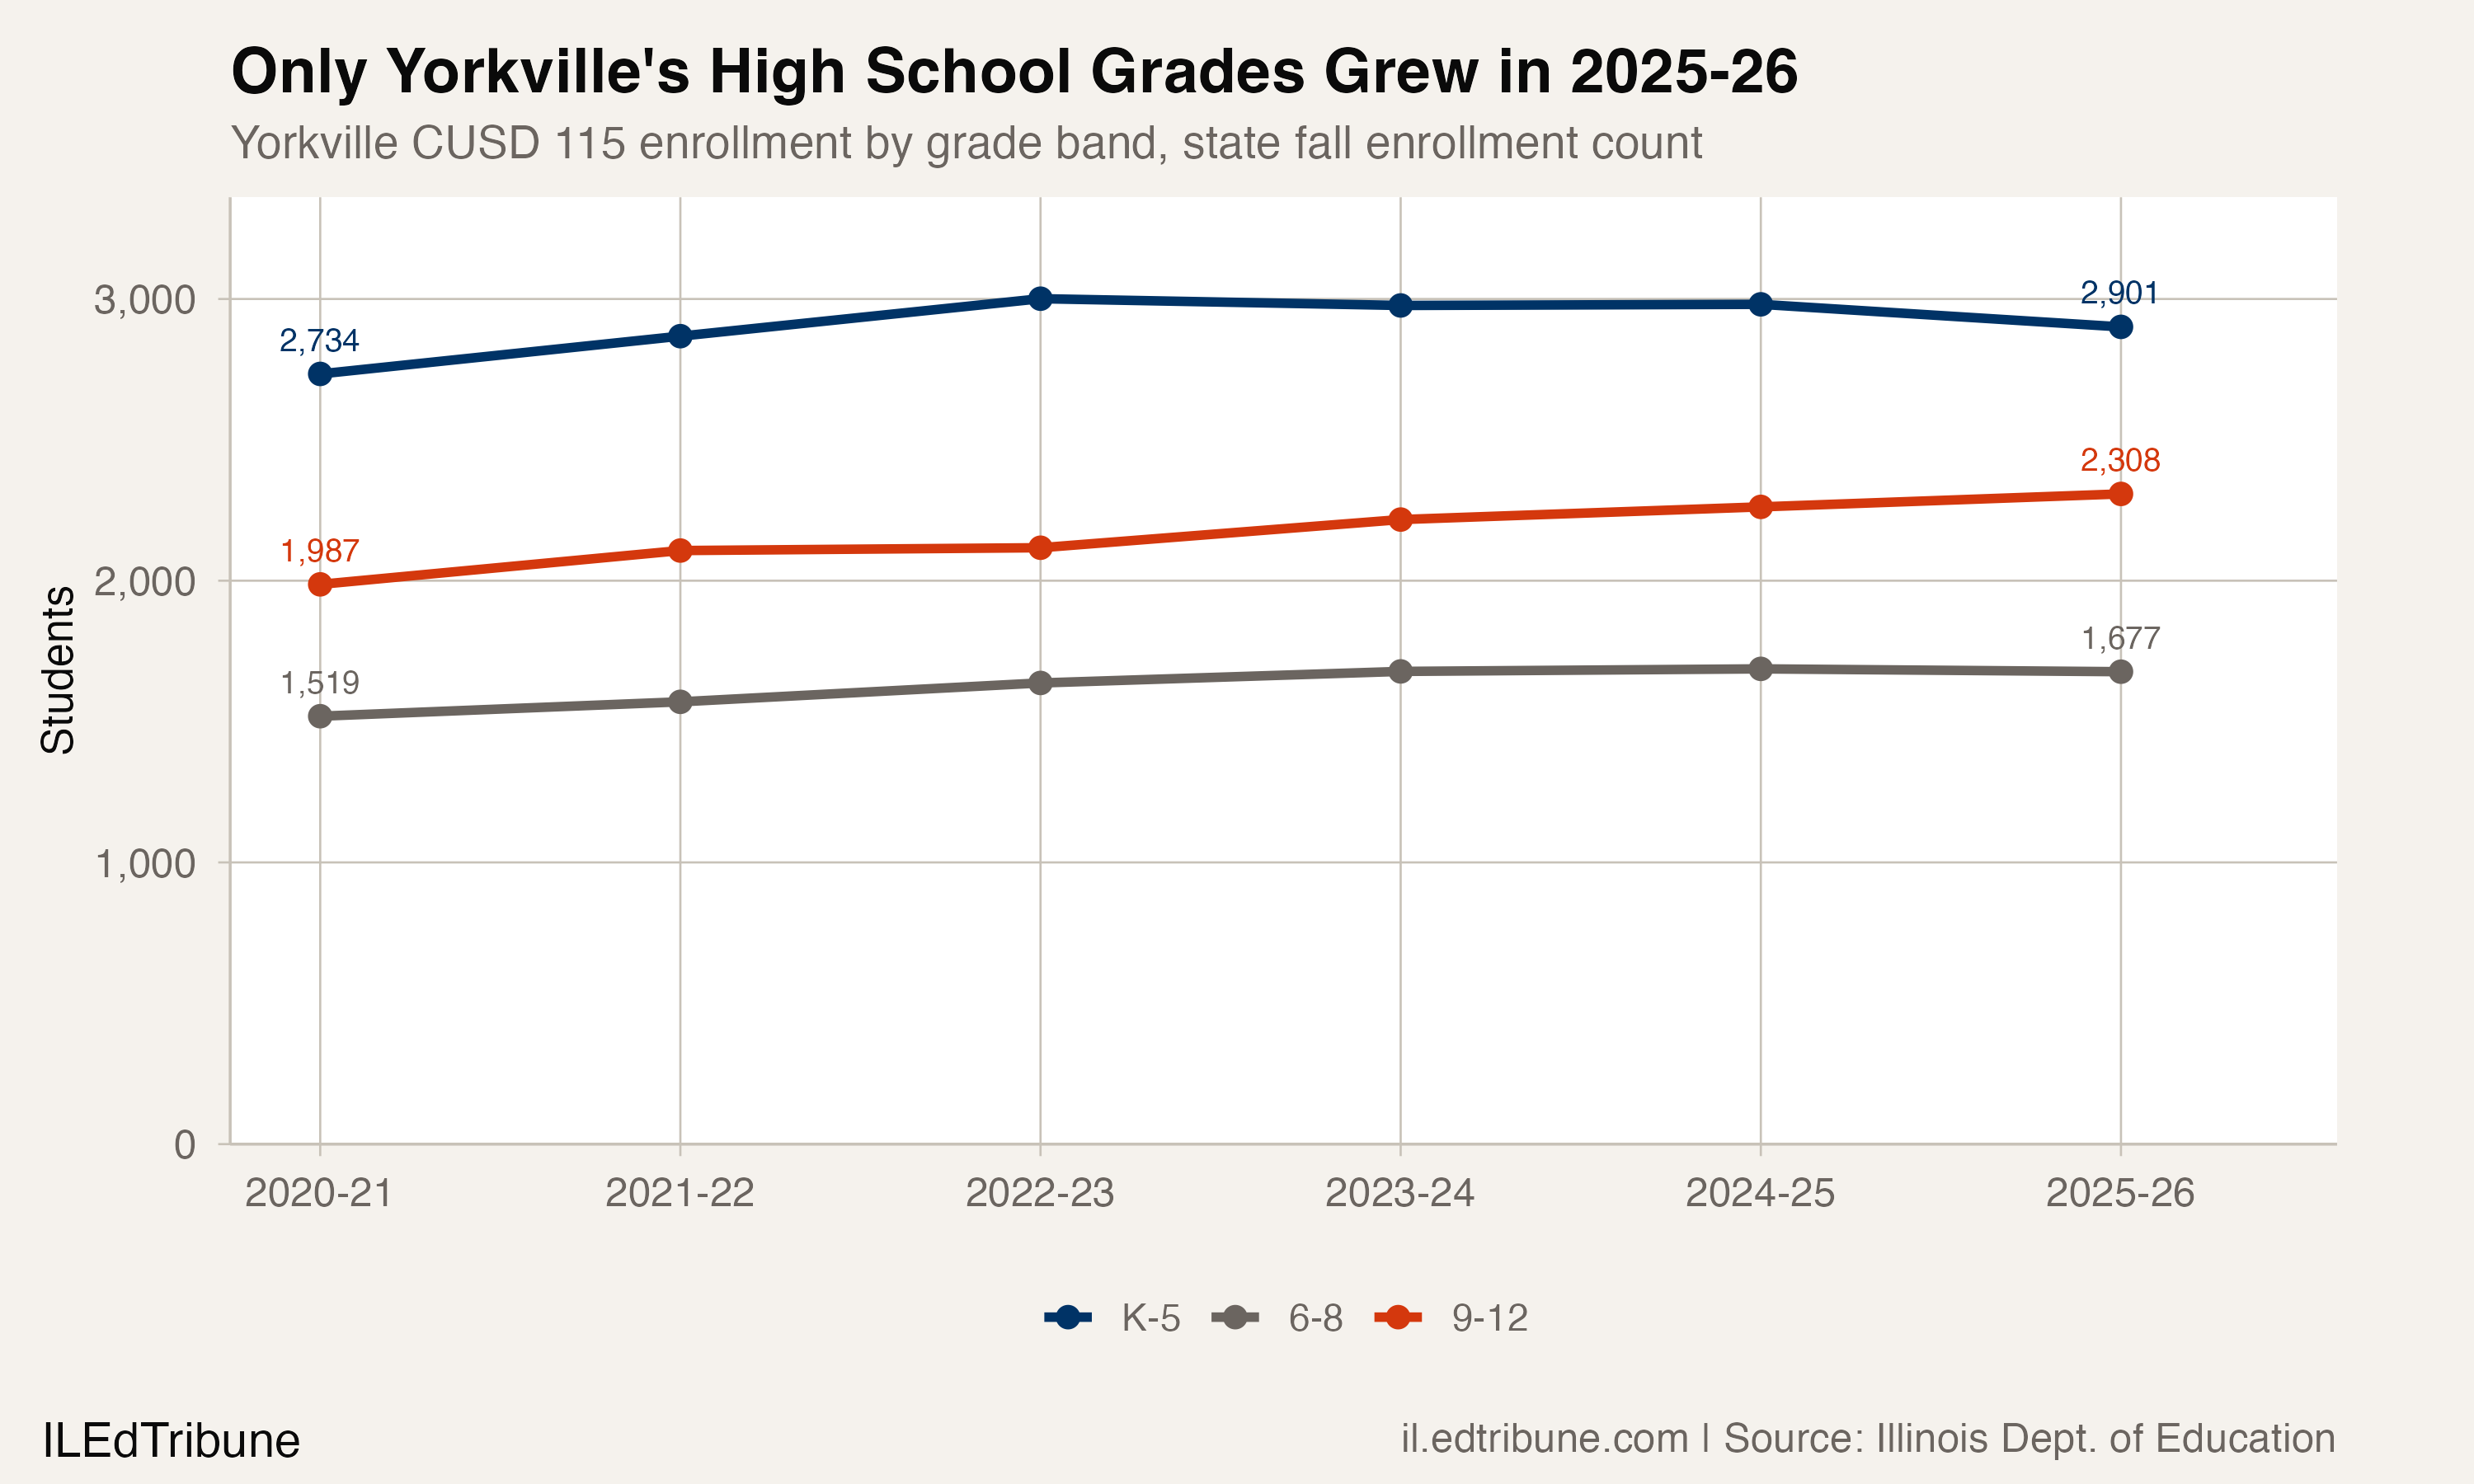
The decline was not spread evenly. On the same fall count, kindergarten through fifth grade lost 80 students, grades 6 through 8 lost 10 and pre-kindergarten lost 30, while the high school grades added 46, reaching 2,308.
That matters this fall. After voters rejected a $275 million building plan in March, Yorkville is asking them on Nov. 3 to approve a $159 million plan that builds a new elementary school and a new middle school, and leaves the high school for later.
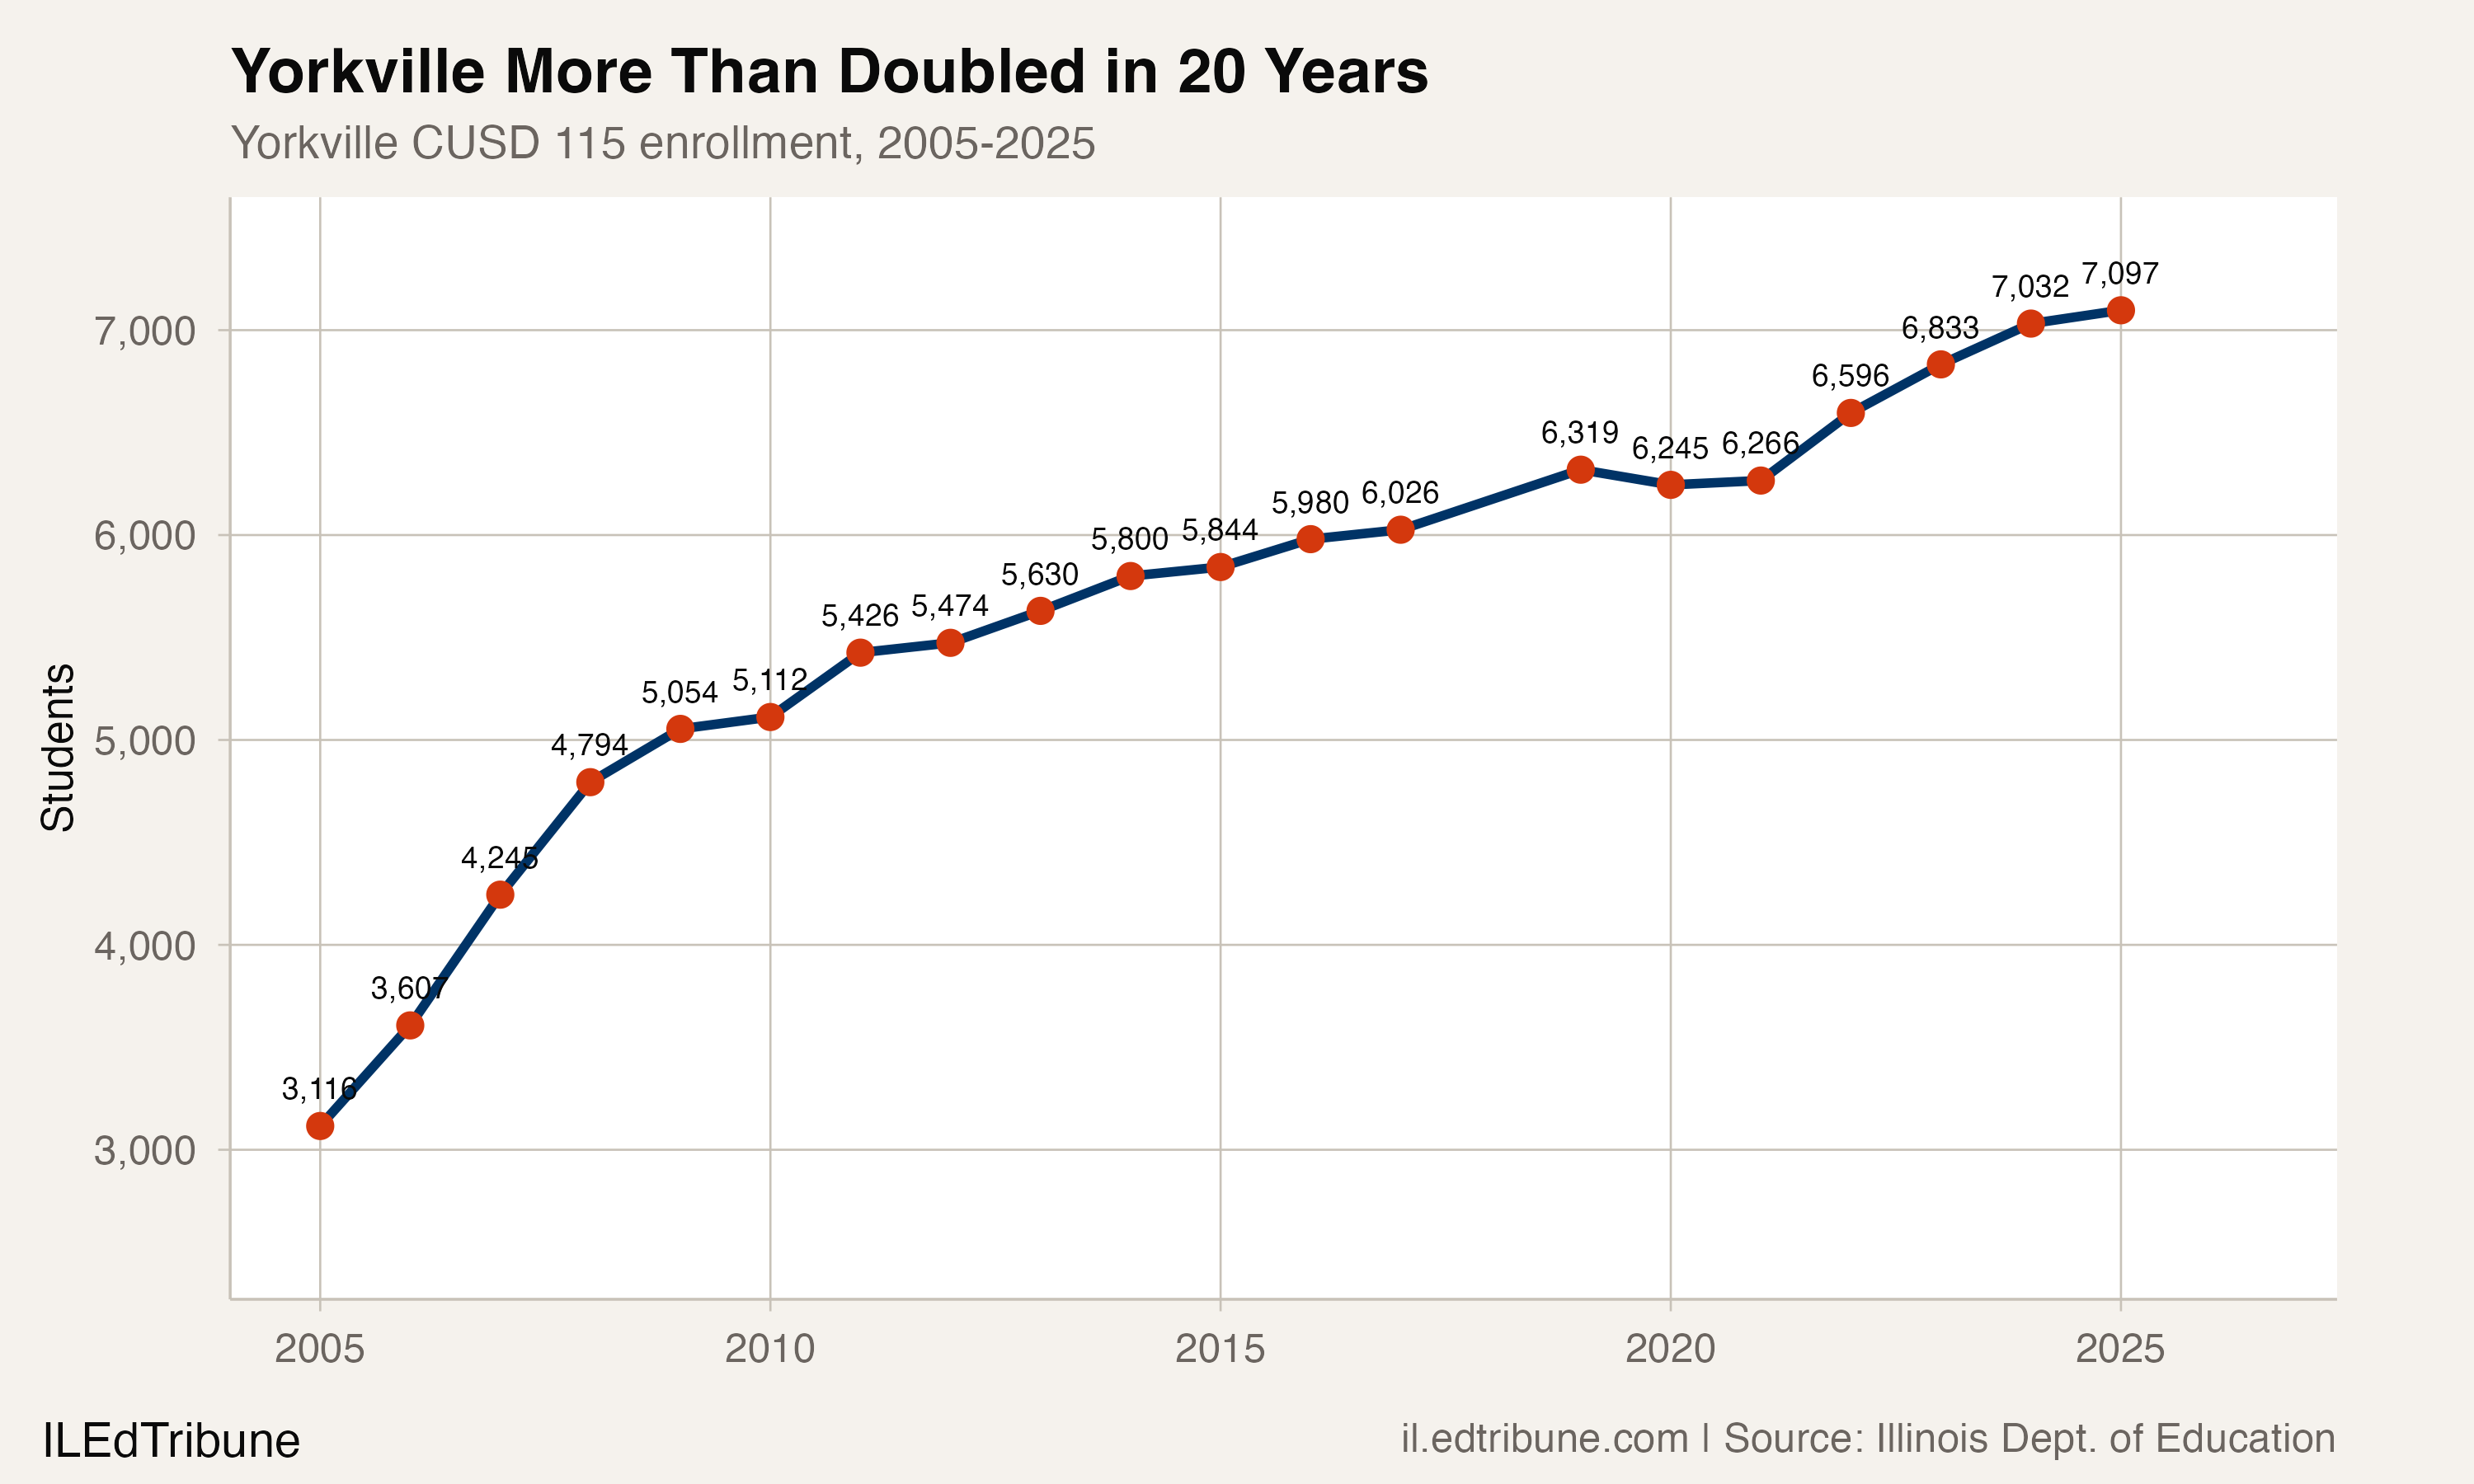
Two decades of growth, then a turn
Yorkville sits in Kendall County, southwest of Chicago, where subdivisions are still being built. The district's most recent school buildings opened in 2009. Grande Reserve, the district's largest development, issued 80 new housing permits in 2024 alone.
From 2008-09, when the district enrolled 5,054 students, to 2024-25, Report Card enrollment grew 40.4%, to 7,097. The pace had already slowed before the 2025-26 drop: on the fall count, Yorkville added 336 students in 2021-22, 232 in 2022-23, 182 in 2023-24 and 55 in 2024-25.
Superintendent Matt Zediker told the Yorkville City Council in January that the district's facilities situation was "unsustainable" with growing enrollment. "Every building is overcrowded with even more growth projected," he said. He said the district has no auditorium and that band classes are taught in a hallway.
The state's fall count does not show the same pressure in every grade. Kindergarten through fifth grade peaked at 3,001 students in 2022-23 and stood at 2,901 in 2025-26, 100 lower. The high school grades rose every year the fall count covers, from 1,987 in 2020-21 to 2,308, a gain of 321. The state's counts cannot say whether the elementary decline will continue.
What voters decided in March, and what is on the ballot now
On March 17, voters in the district rejected a $275 million bond measure that would have paid for a new middle school, a new elementary school, a new academic wing at the high school, an early childhood center, a performing arts center and an athletic field house. The measure failed with about 5,100 "no" votes to 2,300 "yes" votes, according to WSPY.
The district then surveyed residents about the defeat. The school board unanimously approved a smaller measure on July 13. The $159 million proposal on the Nov. 3 ballot covers the new elementary and middle schools. It drops the high school academic wing, the performing arts center and the field house. Zediker has said the plan is designed to leave the district's tax rate unchanged, in part because existing debt is coming off the books, and that a district-hired demographer found the greatest enrollment growth in the K-5 schools.
Zediker called the plan "a good first step" and said the high school is not finished business. "That doesn't mean we aren't going to have to look at our high school in the future, because we certainly are," he said, according to Shaw Local.
Data-center money is a separate question. The City of Yorkville has slotted $68.25 million for the school district from the development agreements for two proposed data centers, Project Cardinal and Project Steel, according to Shaw Local. All of it is contingent on final building permits, and Zediker said the district is not counting on those payments because of the uncertainty the projects bring. After the March defeat, Zediker said, according to Shaw Local, that "the assumption that the data center money would be able to take care of all our needs was one that was pretty prevalent in the community."
Oswego, a decade past its peak
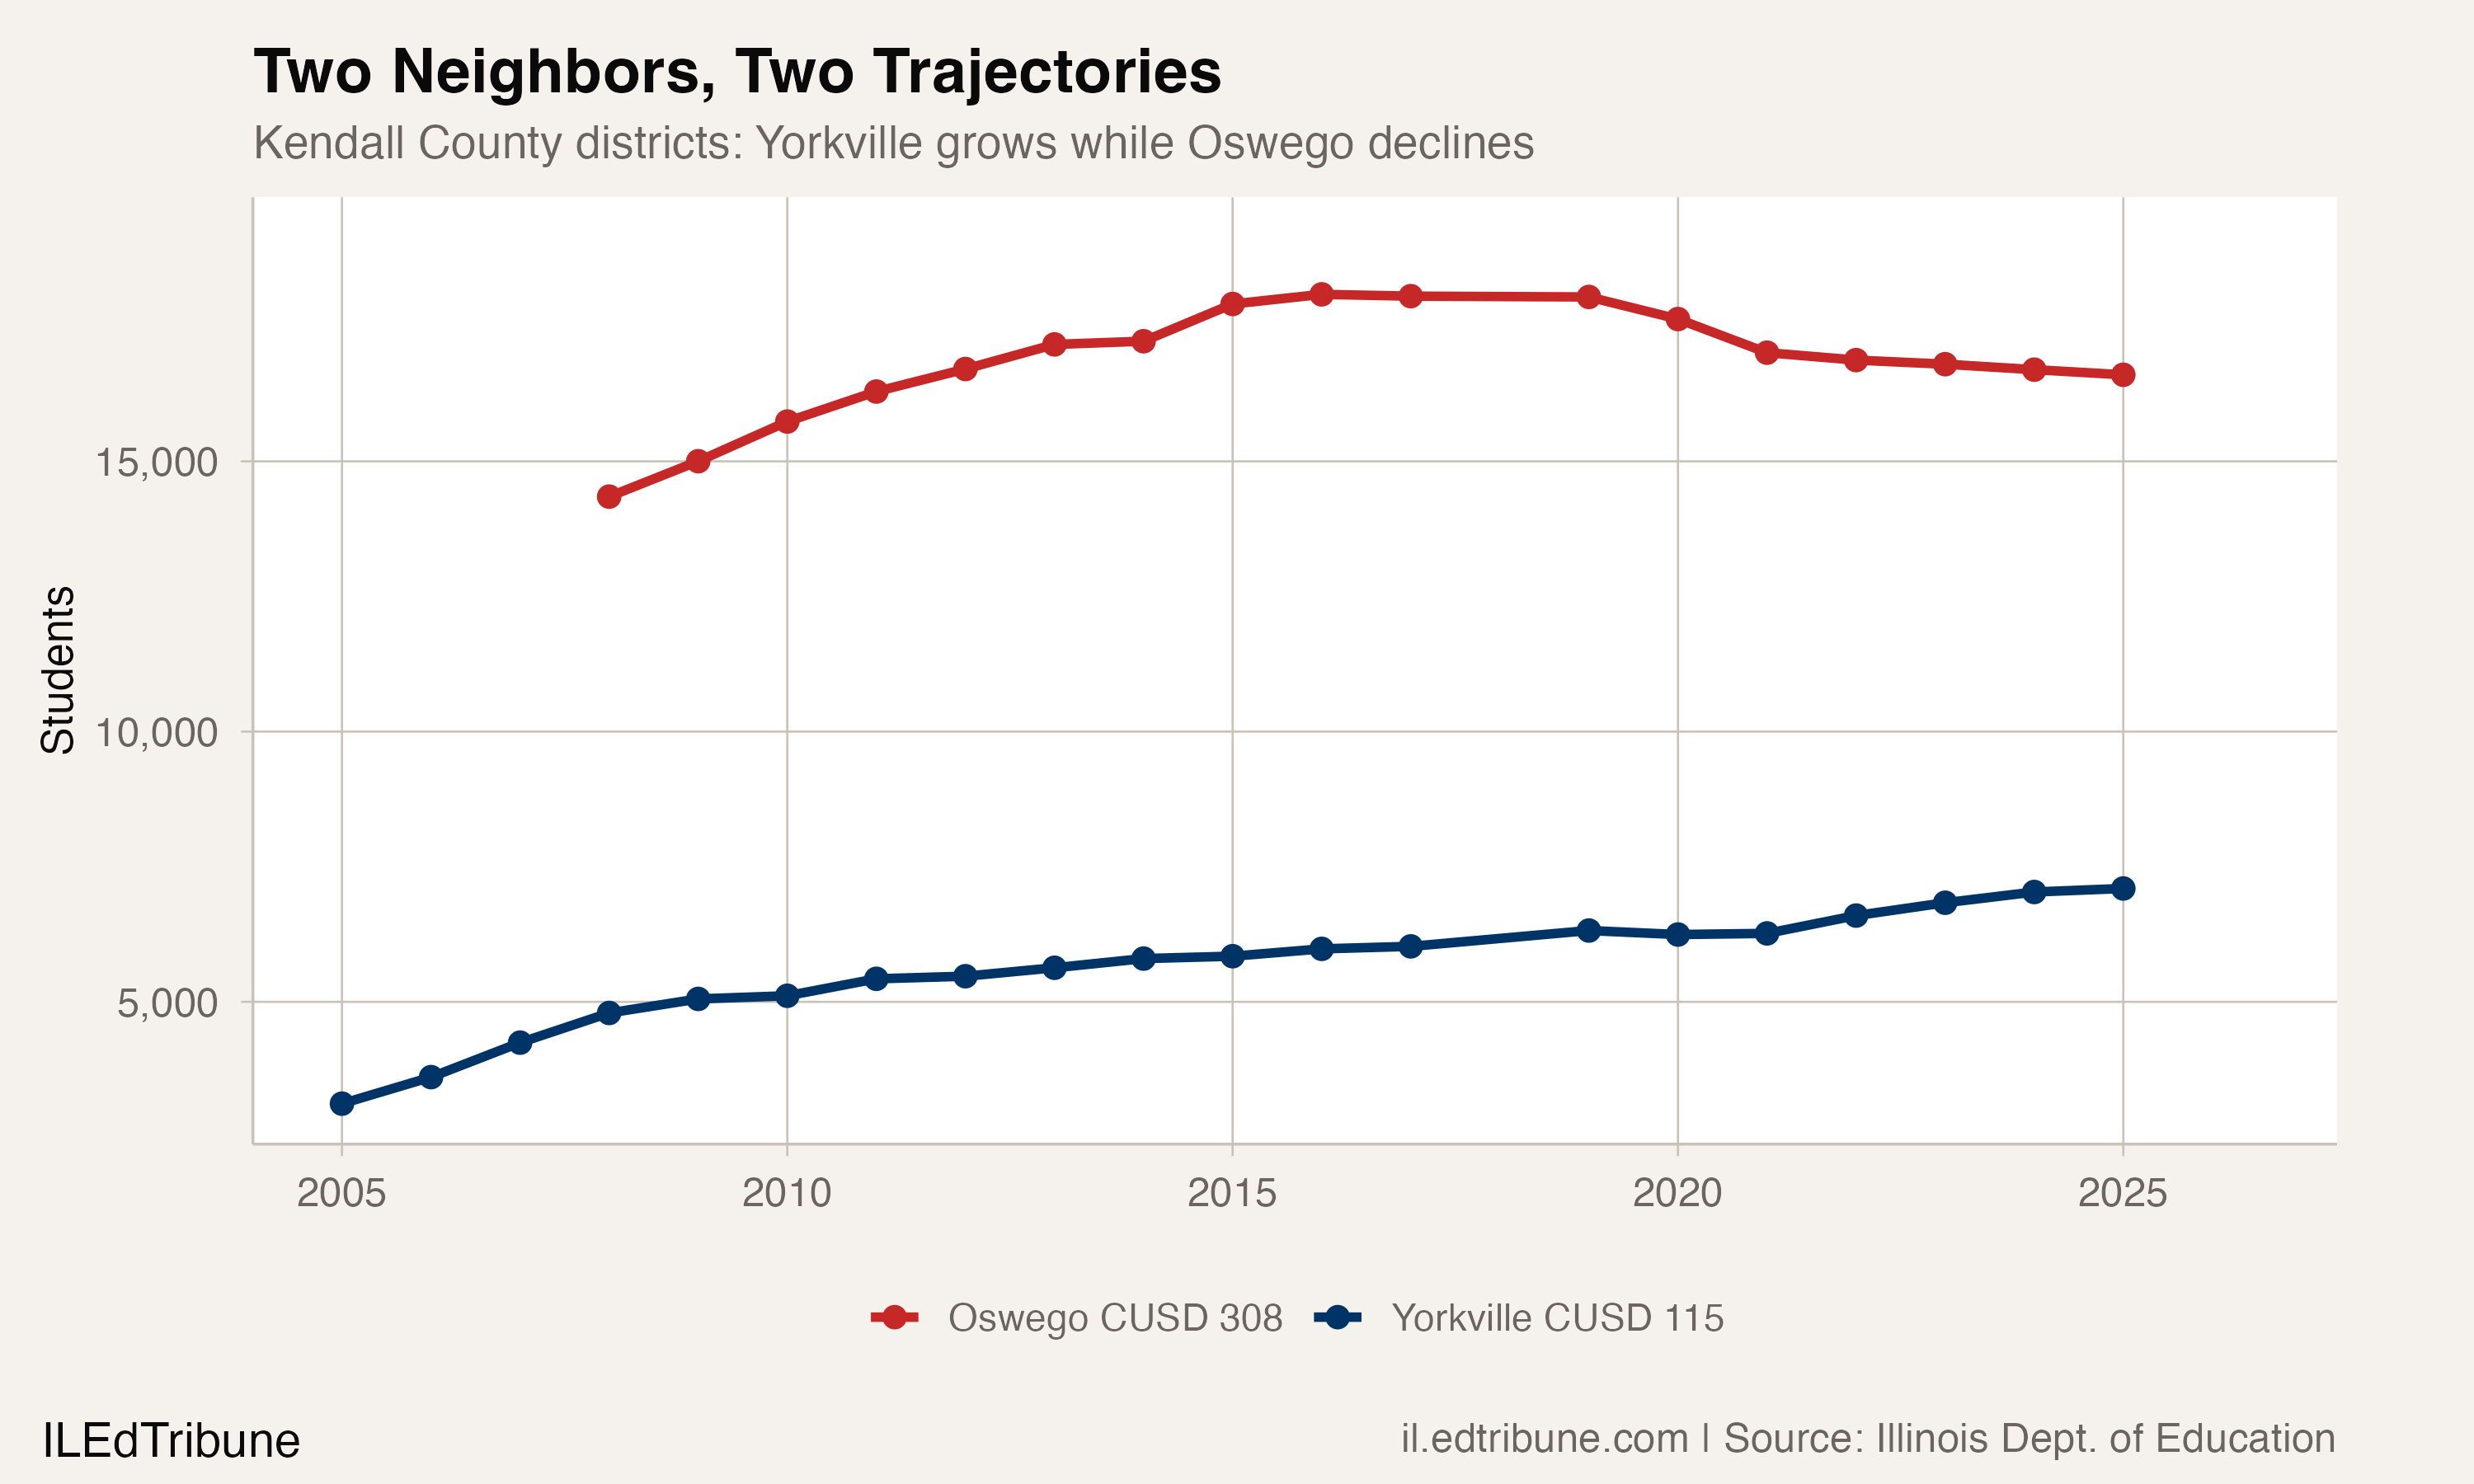
Oswego CUSD 308↗ET, Yorkville's larger neighbor in Kendall County, has followed a different path. On the Report Card count, Oswego peaked at 18,089 students in 2015-16, more than three times Yorkville's enrollment that year. It then posted eight straight declines in the state's reported years, reaching 16,601 in 2024-25, 1,488 students, or 8.2%, below its peak. In 2025-26 the direction changed: on the state's fall count, Oswego added 30 students, from 16,766 to 16,796, its first increase in the five years that count covers.
Both districts sit in the same county along the same commuter corridor. Oswego reached its peak a decade ago; Yorkville was still adding students through 2024-25. In 2025-26, each moved against its own recent trend. The state's enrollment files cannot show how much of each district's path comes from home construction, family size or students moving between districts.
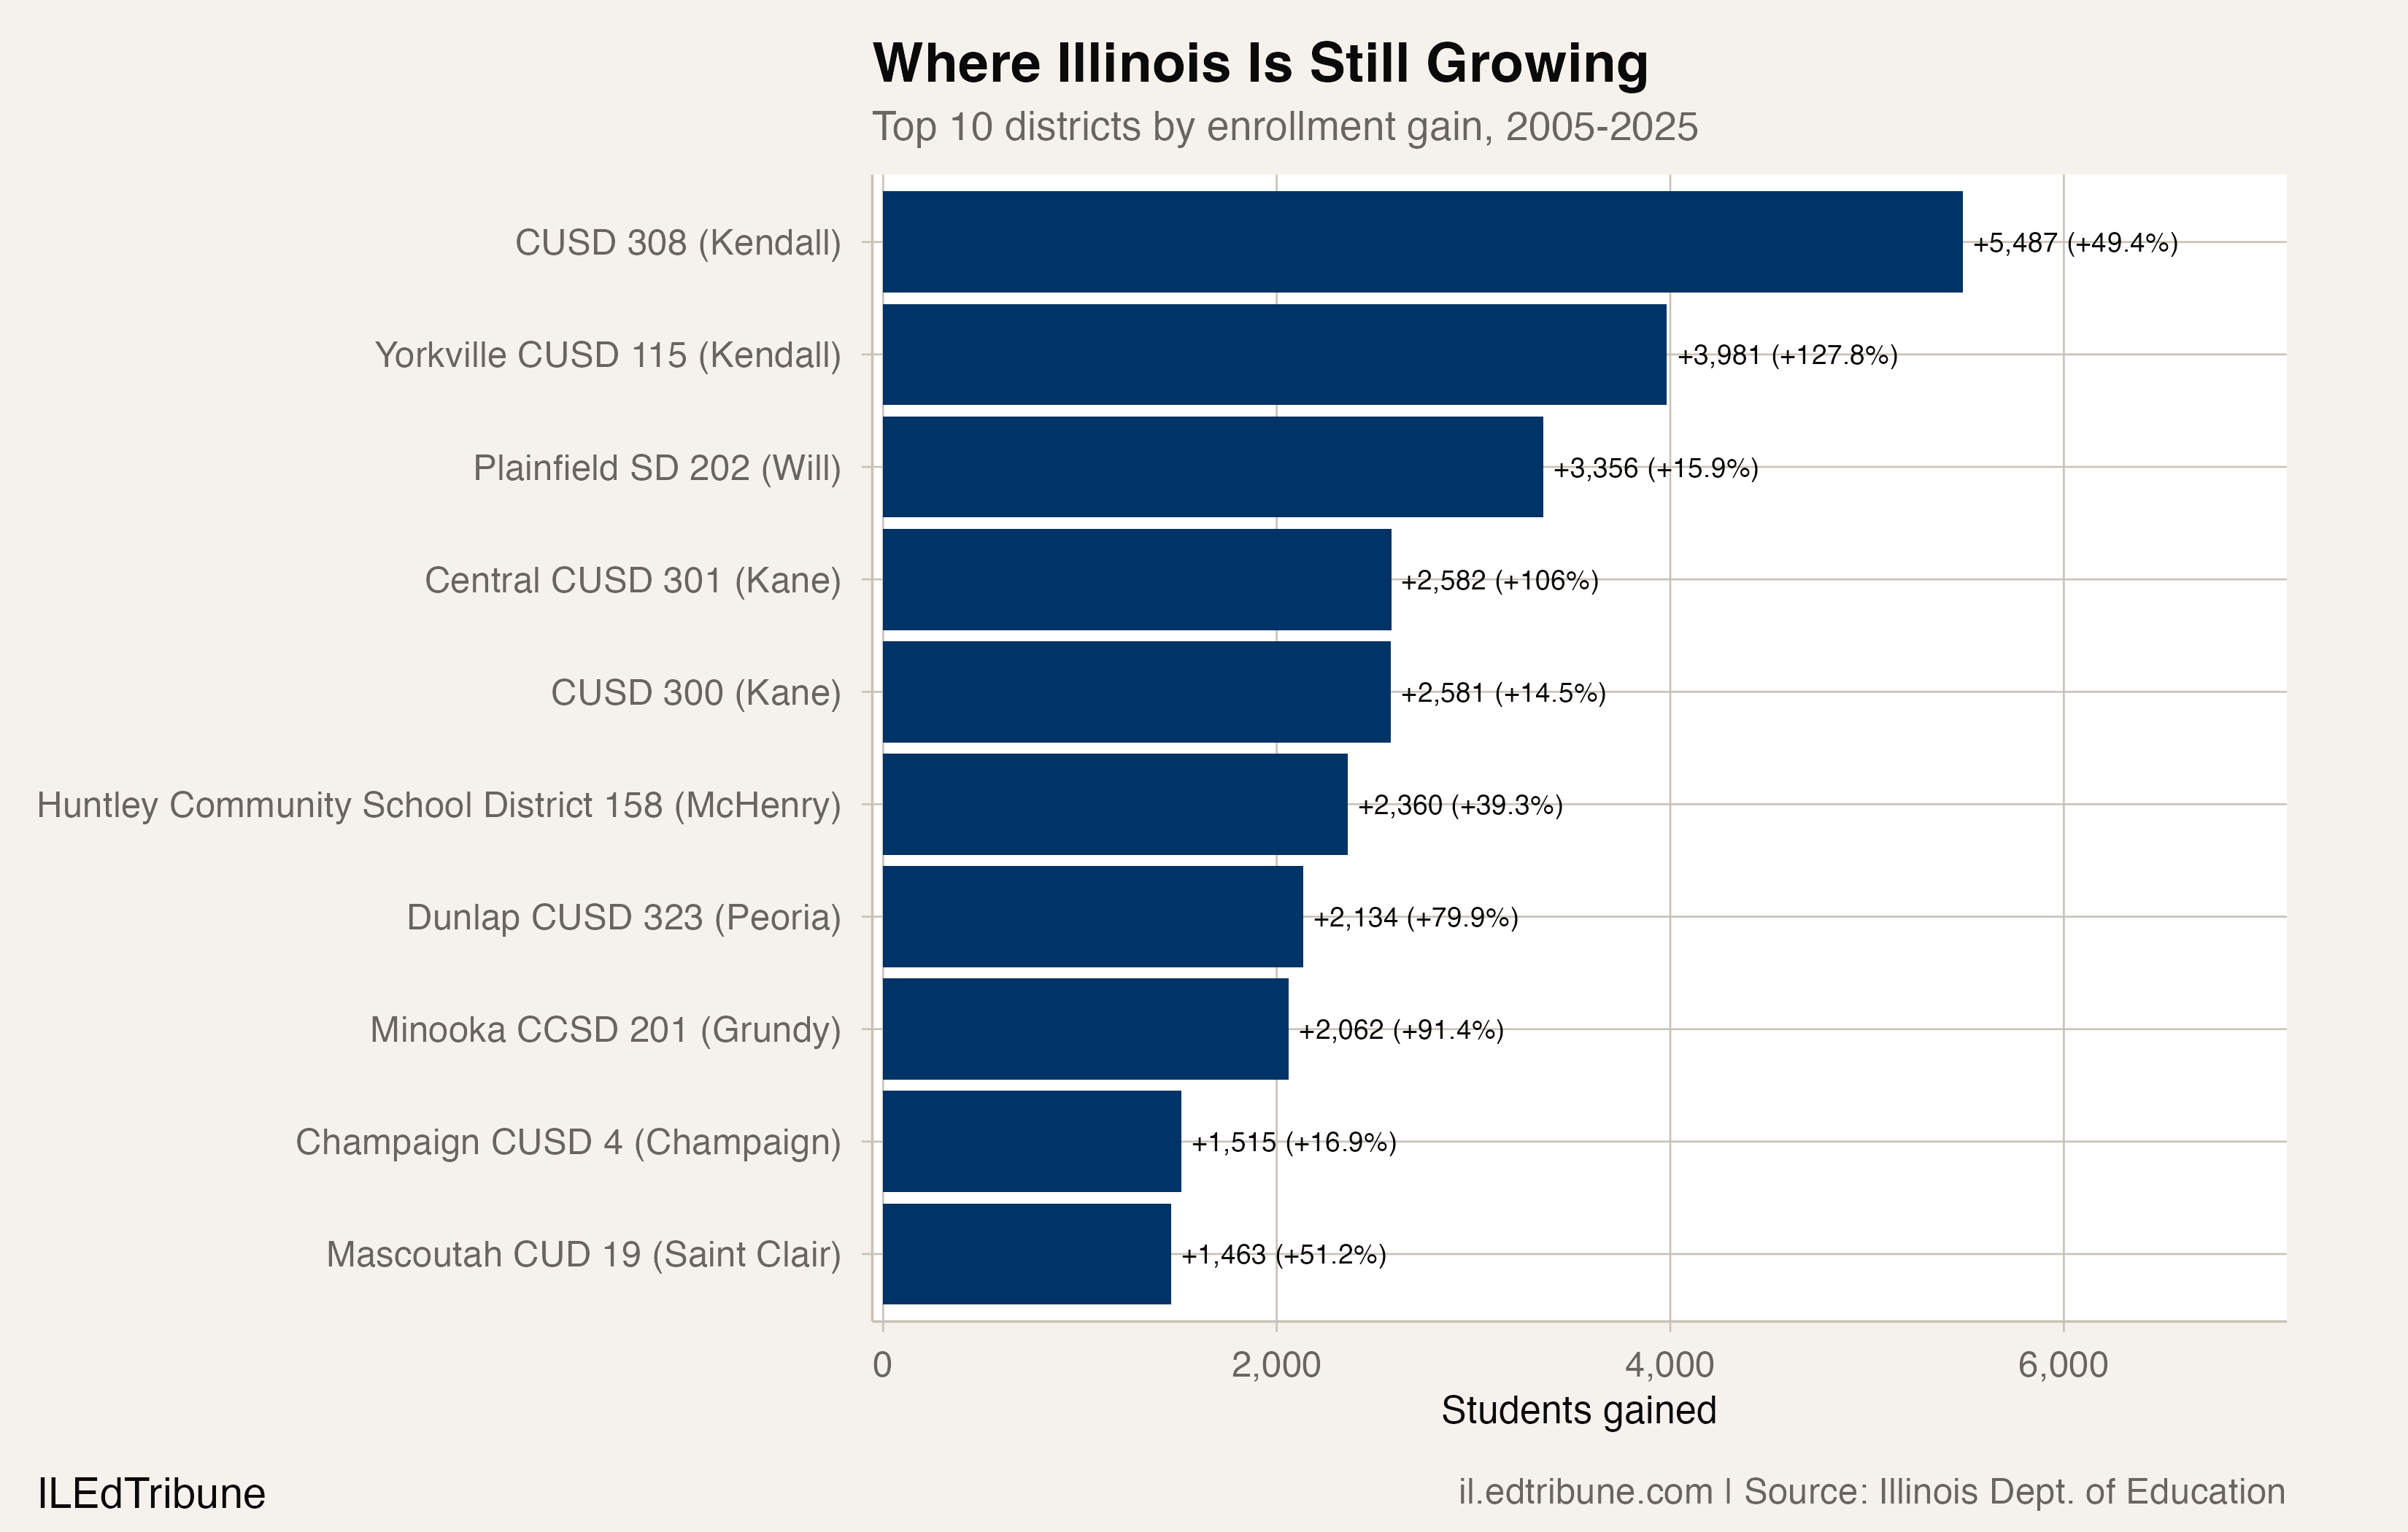
Where Illinois is still adding students
Yorkville is part of a small group. Of the 588 districts with Report Card counts in both 2004-05 and 2024-25, 105 grew, adding a combined 49,169 students. The 483 that shrank lost 226,023. Together those districts enrolled 176,854 fewer students than two decades earlier.
Four Kendall County districts, Yorkville and Oswego among them, added 10,462 students, 21.3% of all the growth in the state. The county's districts enrolled 26,564 students in 2024-25. The six collar counties (DuPage, Kane, Kendall, Lake, McHenry and Will) account for 60.4% of the growth.
That does not make the collar counties a growth region. On the Report Card count, their districts enrolled 610,582 students in 2011-12 and 543,656 in 2024-25, a loss of 66,926, or 11.0%. Cook County's districts lost 110,082 students over the same years, or 14.1%, with Chicago Public Schools falling from 400,931 to 323,047. Downstate districts lost 70,359, or 10.5%. Indexed to 2011-12, the collar counties stood at 89.0%, Cook at 85.9% and downstate at 89.5%.
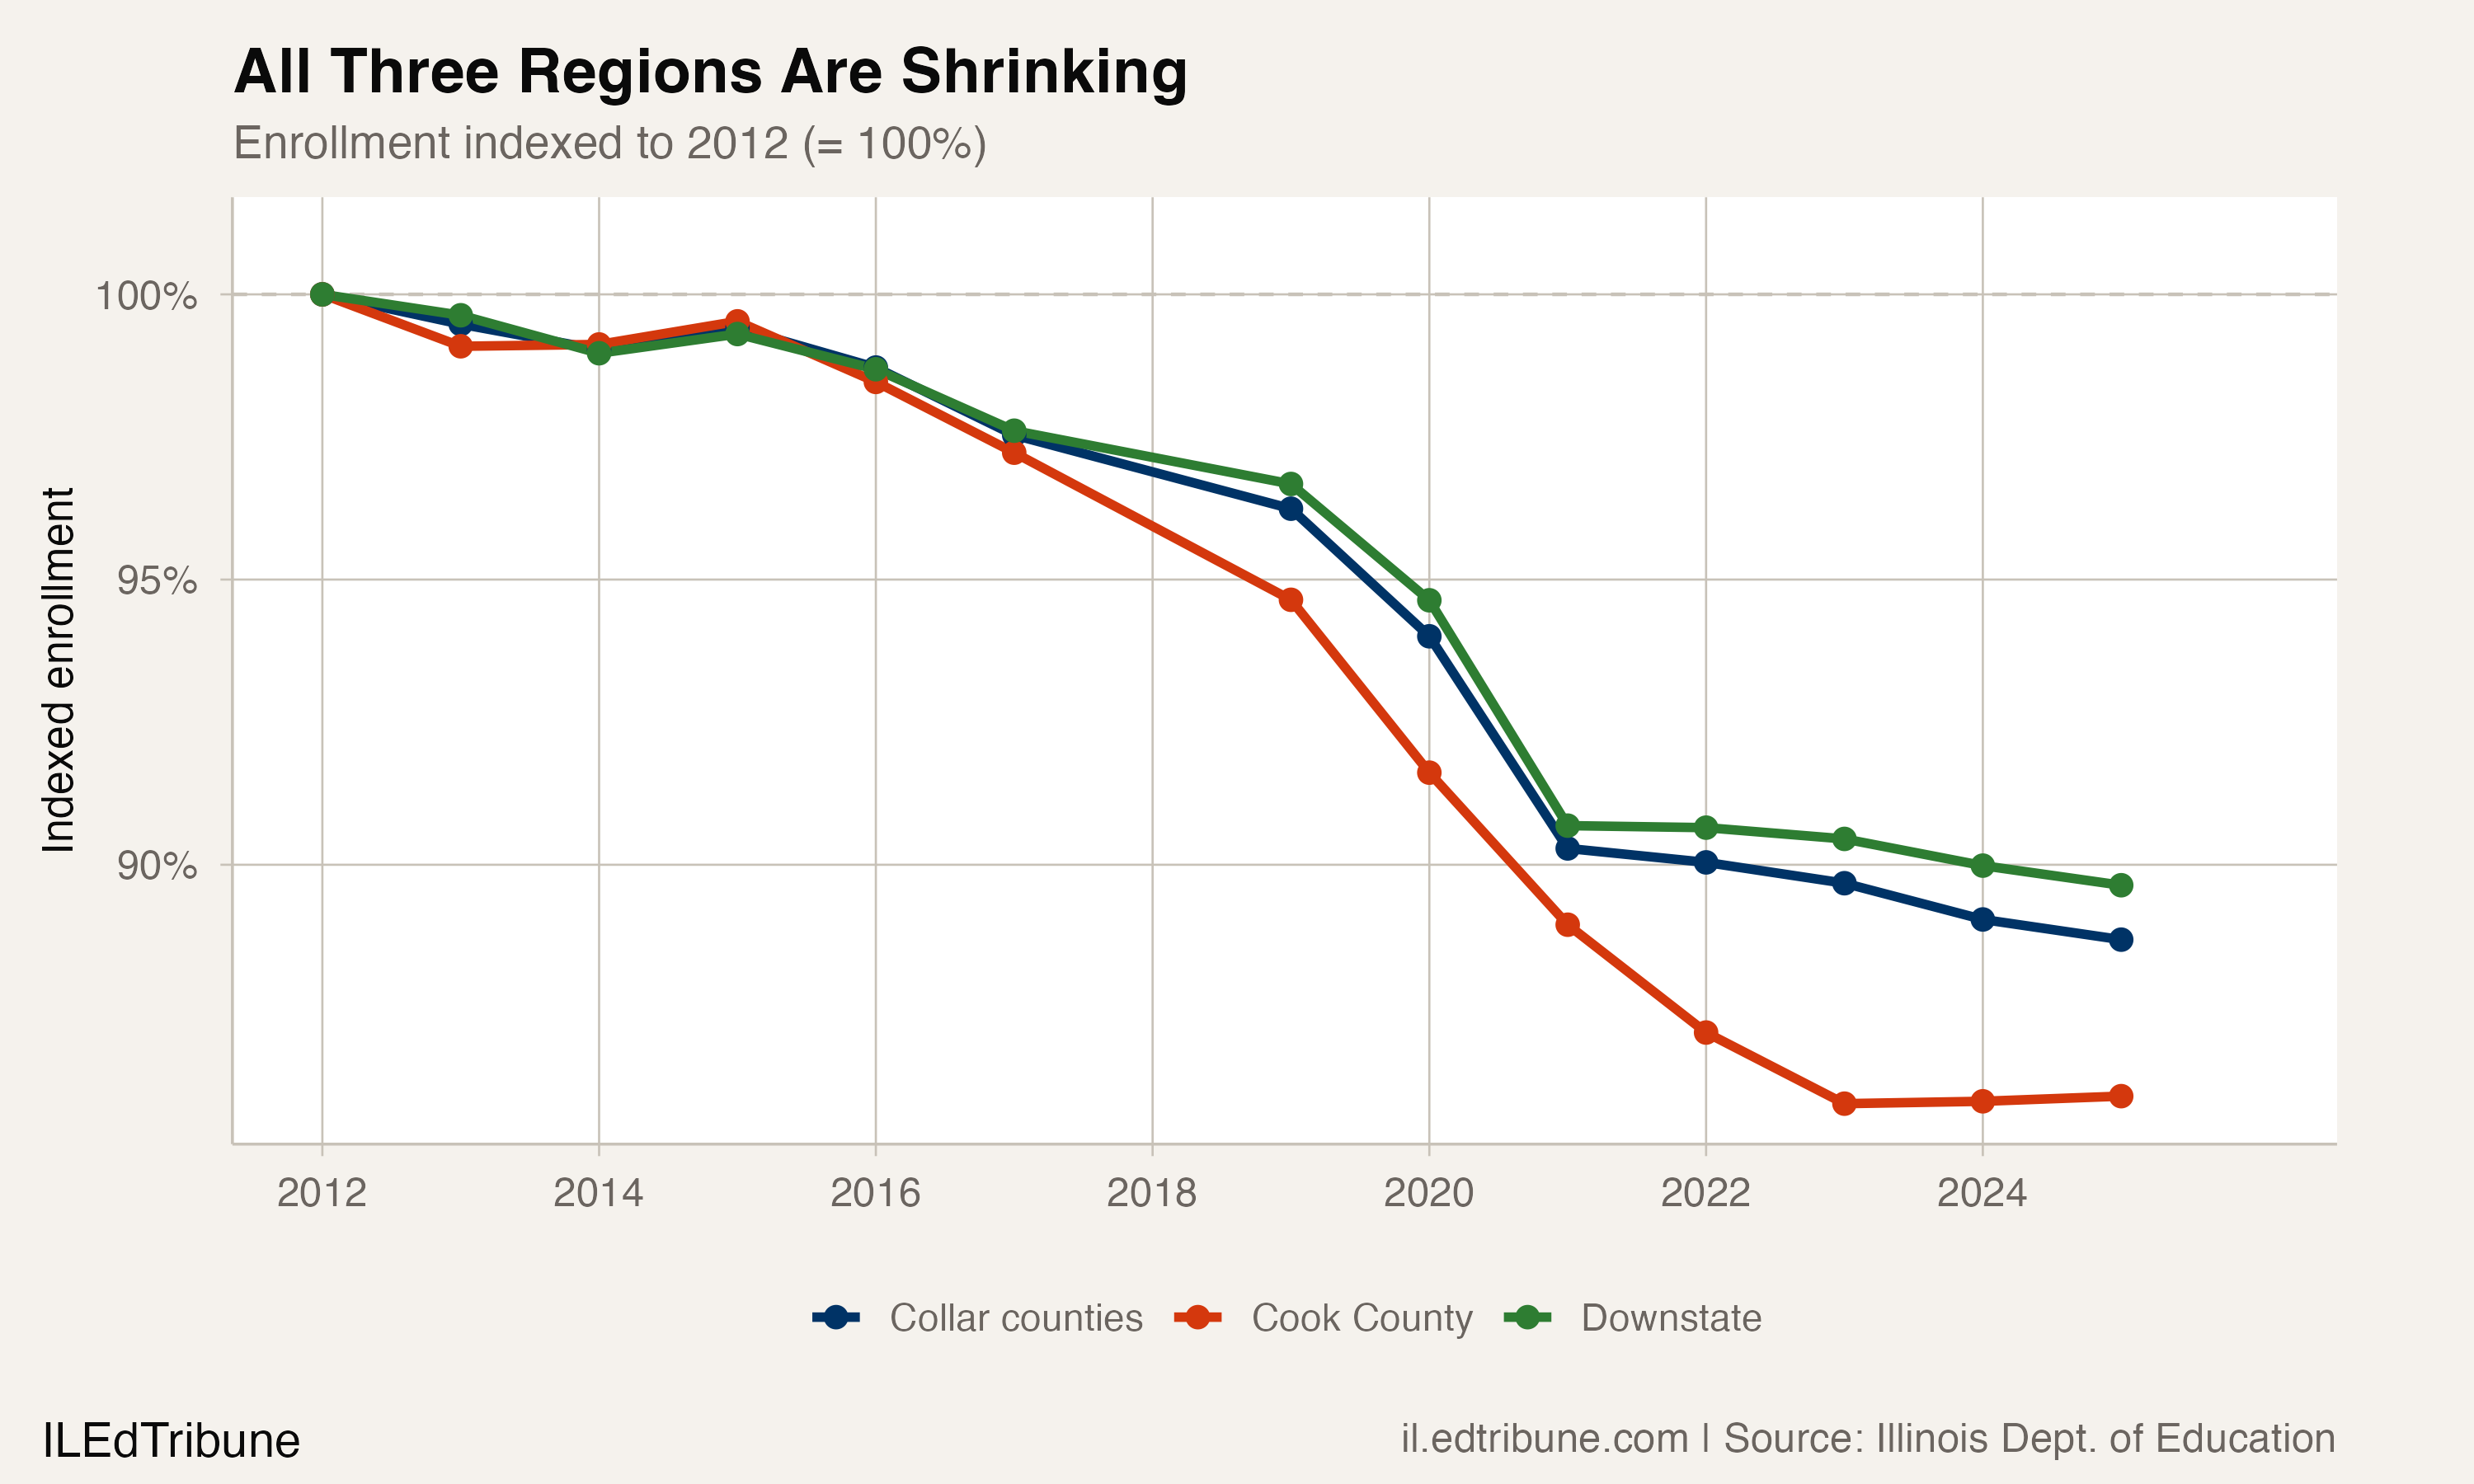
Where enrollment is still growing, it is concentrated in a small number of districts rather than spread across a region.
A more diverse student body
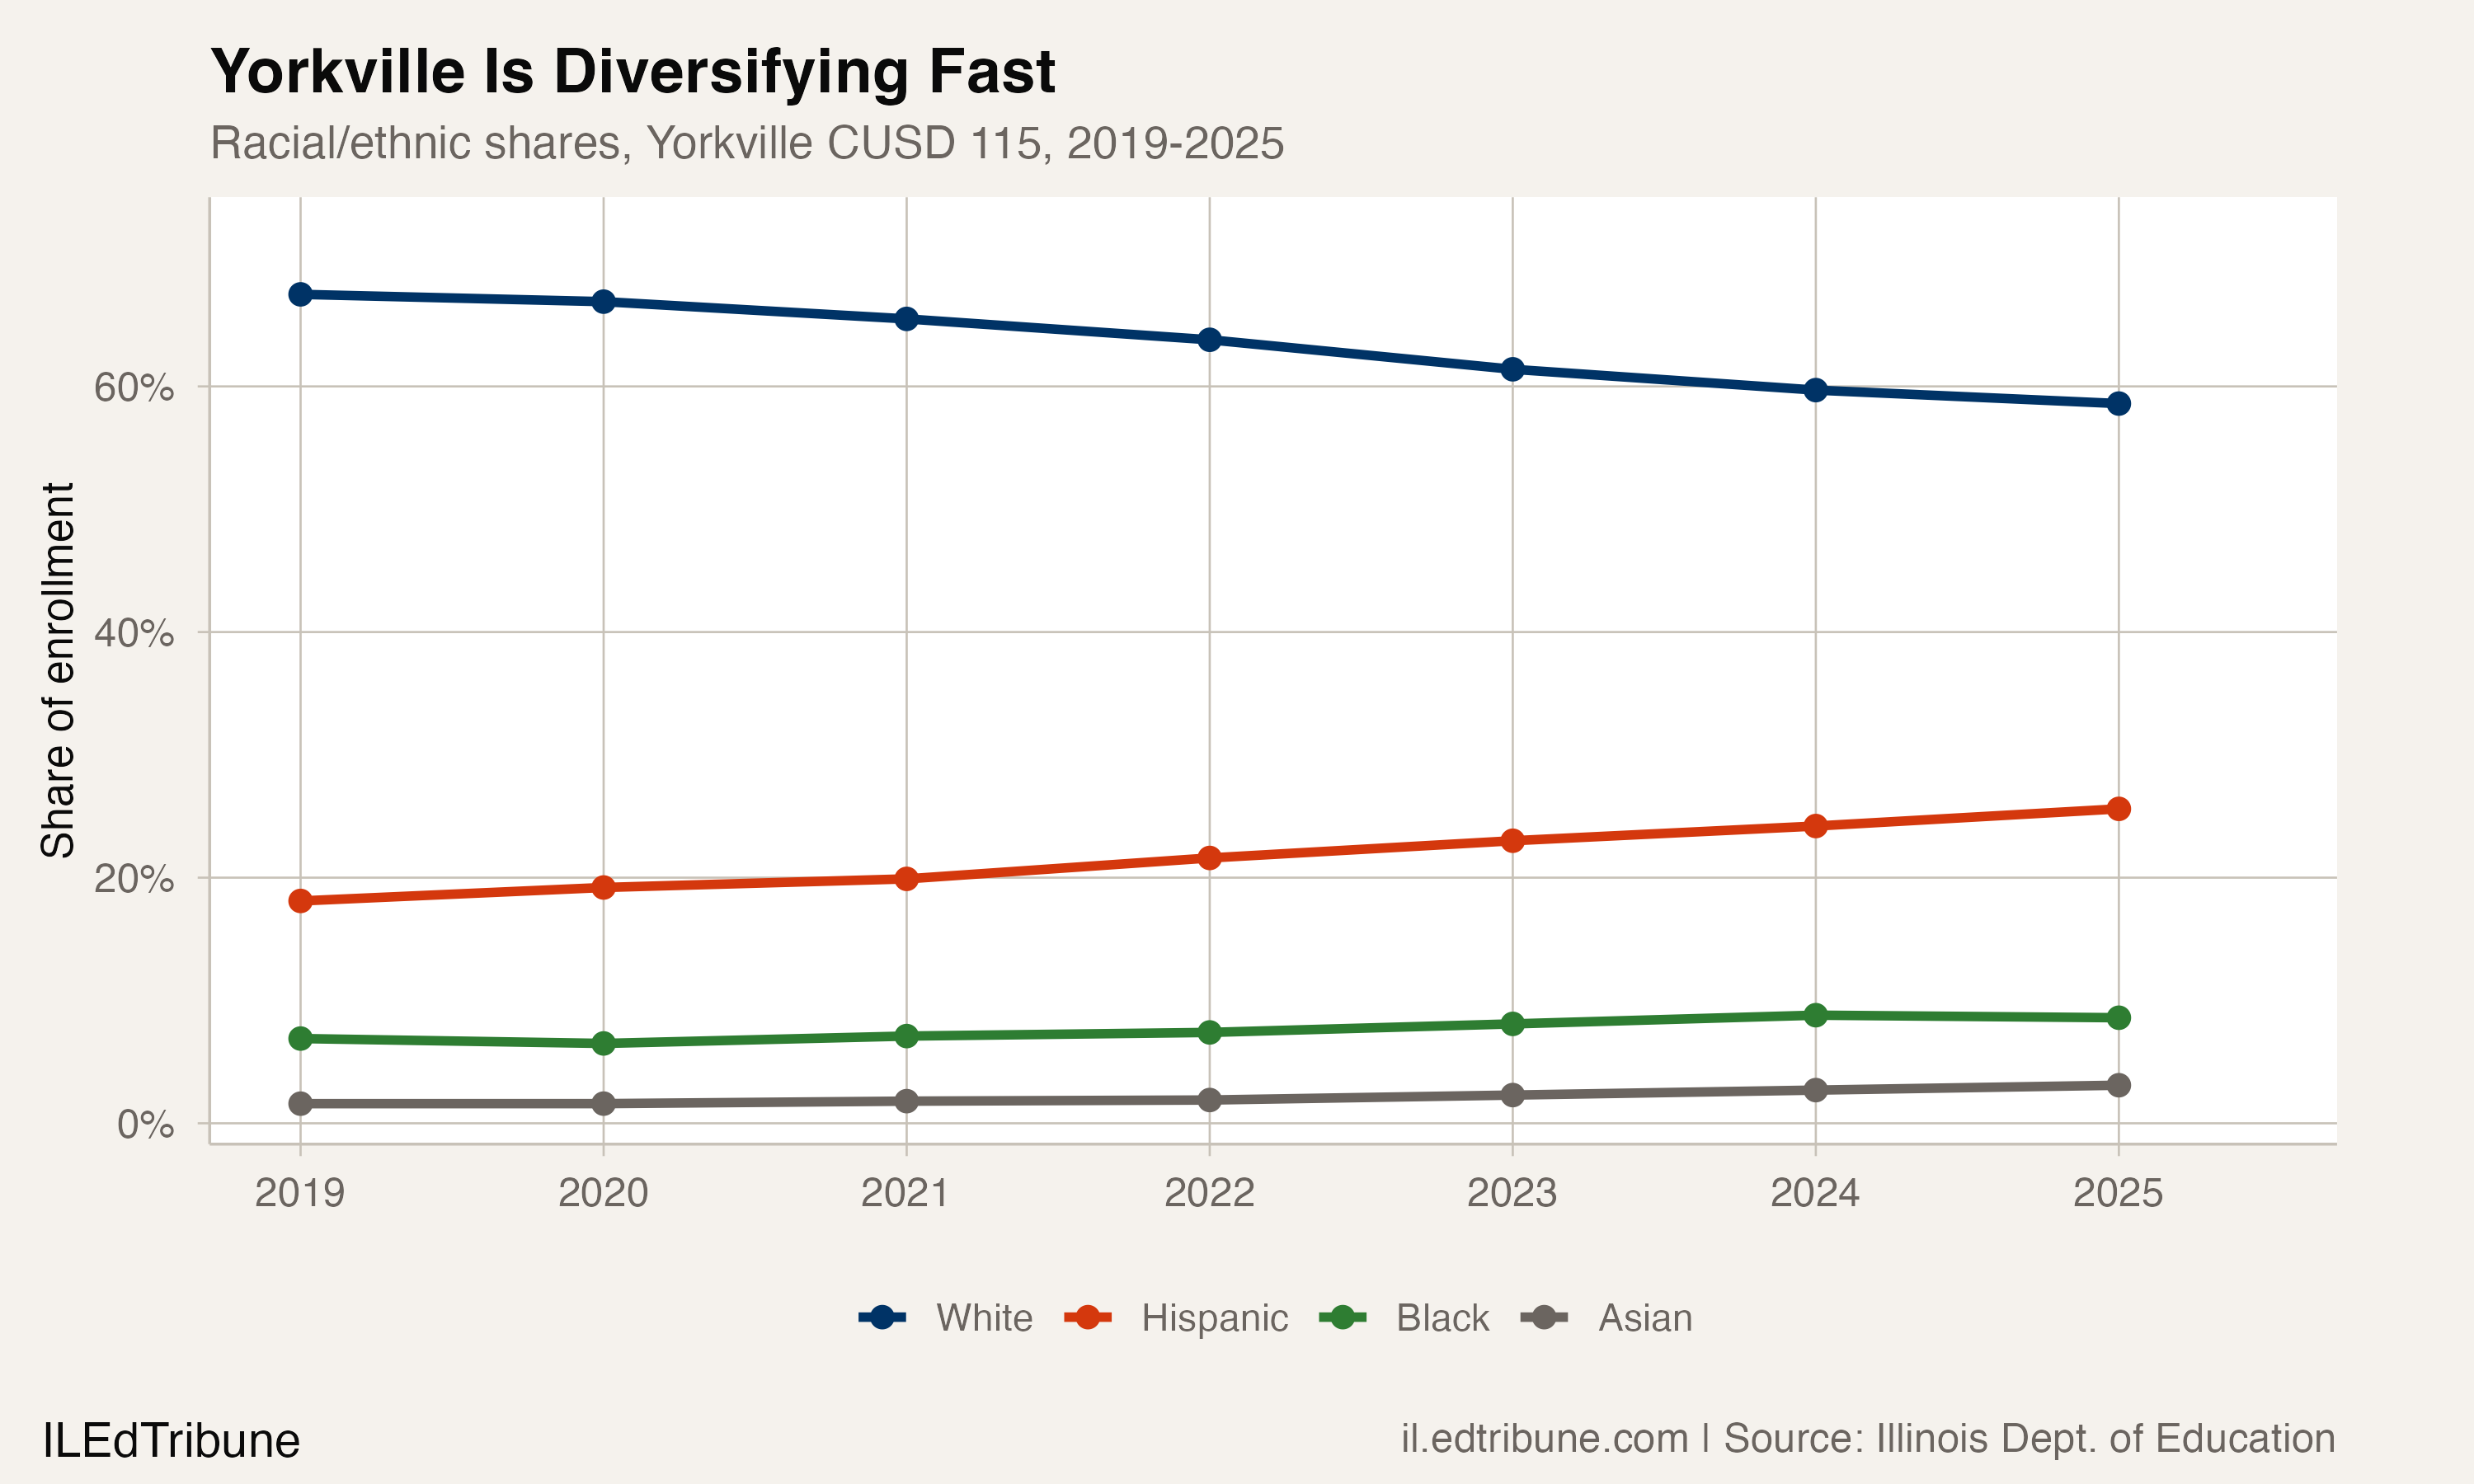
Yorkville's student body has changed as it has grown. On the state's fall count, white students made up 65.3% of enrollment in 2020-21 and 57.5% in 2025-26. Hispanic students went from 19.9% to 26.2% of the district, and Black students from 7.3% to 8.9%.
What the Nov. 3 vote will and will not settle
The numbers going into the vote cut in more than one direction. Yorkville is more than twice the size it was two decades ago, and its newest school buildings opened in 2009. In 2025-26 its enrollment fell for the first time since 2019-20. The elementary and middle grades the November plan builds for were smaller than a year earlier, and the only grades that grew were the high school grades it leaves for later. Zediker has said a district-hired demographer's reports showed the greatest enrollment growth in kindergarten through fifth grade; the state's fall count shows those grades 100 students below their 2022-23 level. If voters approve the $159 million measure, the district gets new elementary and middle school space. The high school, where the state's most recent count shows enrollment rising, would remain, in Zediker's words, a conversation for "a couple years down the road."
Enrollment counts through 2024-25 come from the Illinois State Board of Education's Report Card data. Figures for 2025-26, and every change into 2025-26, come from ISBE's Fall Enrollment Report, which assigns each student to a home district, on both ends; the two counts are never subtracted from each other. The 2025-26 school year is the most recent one the state has published; counts for the current 2026-27 school year will differ.
Detailed code that reproduces the analysis and figures in this article is available exclusively to EdTribune subscribers.
Discussion
Sign in to join the discussion.
Loading comments...