Woodland CCSD 50, a K-8 district in Gurnee, gained 15 students last fall. It was the first time the district's enrollment had ticked upward since George W. Bush was president.
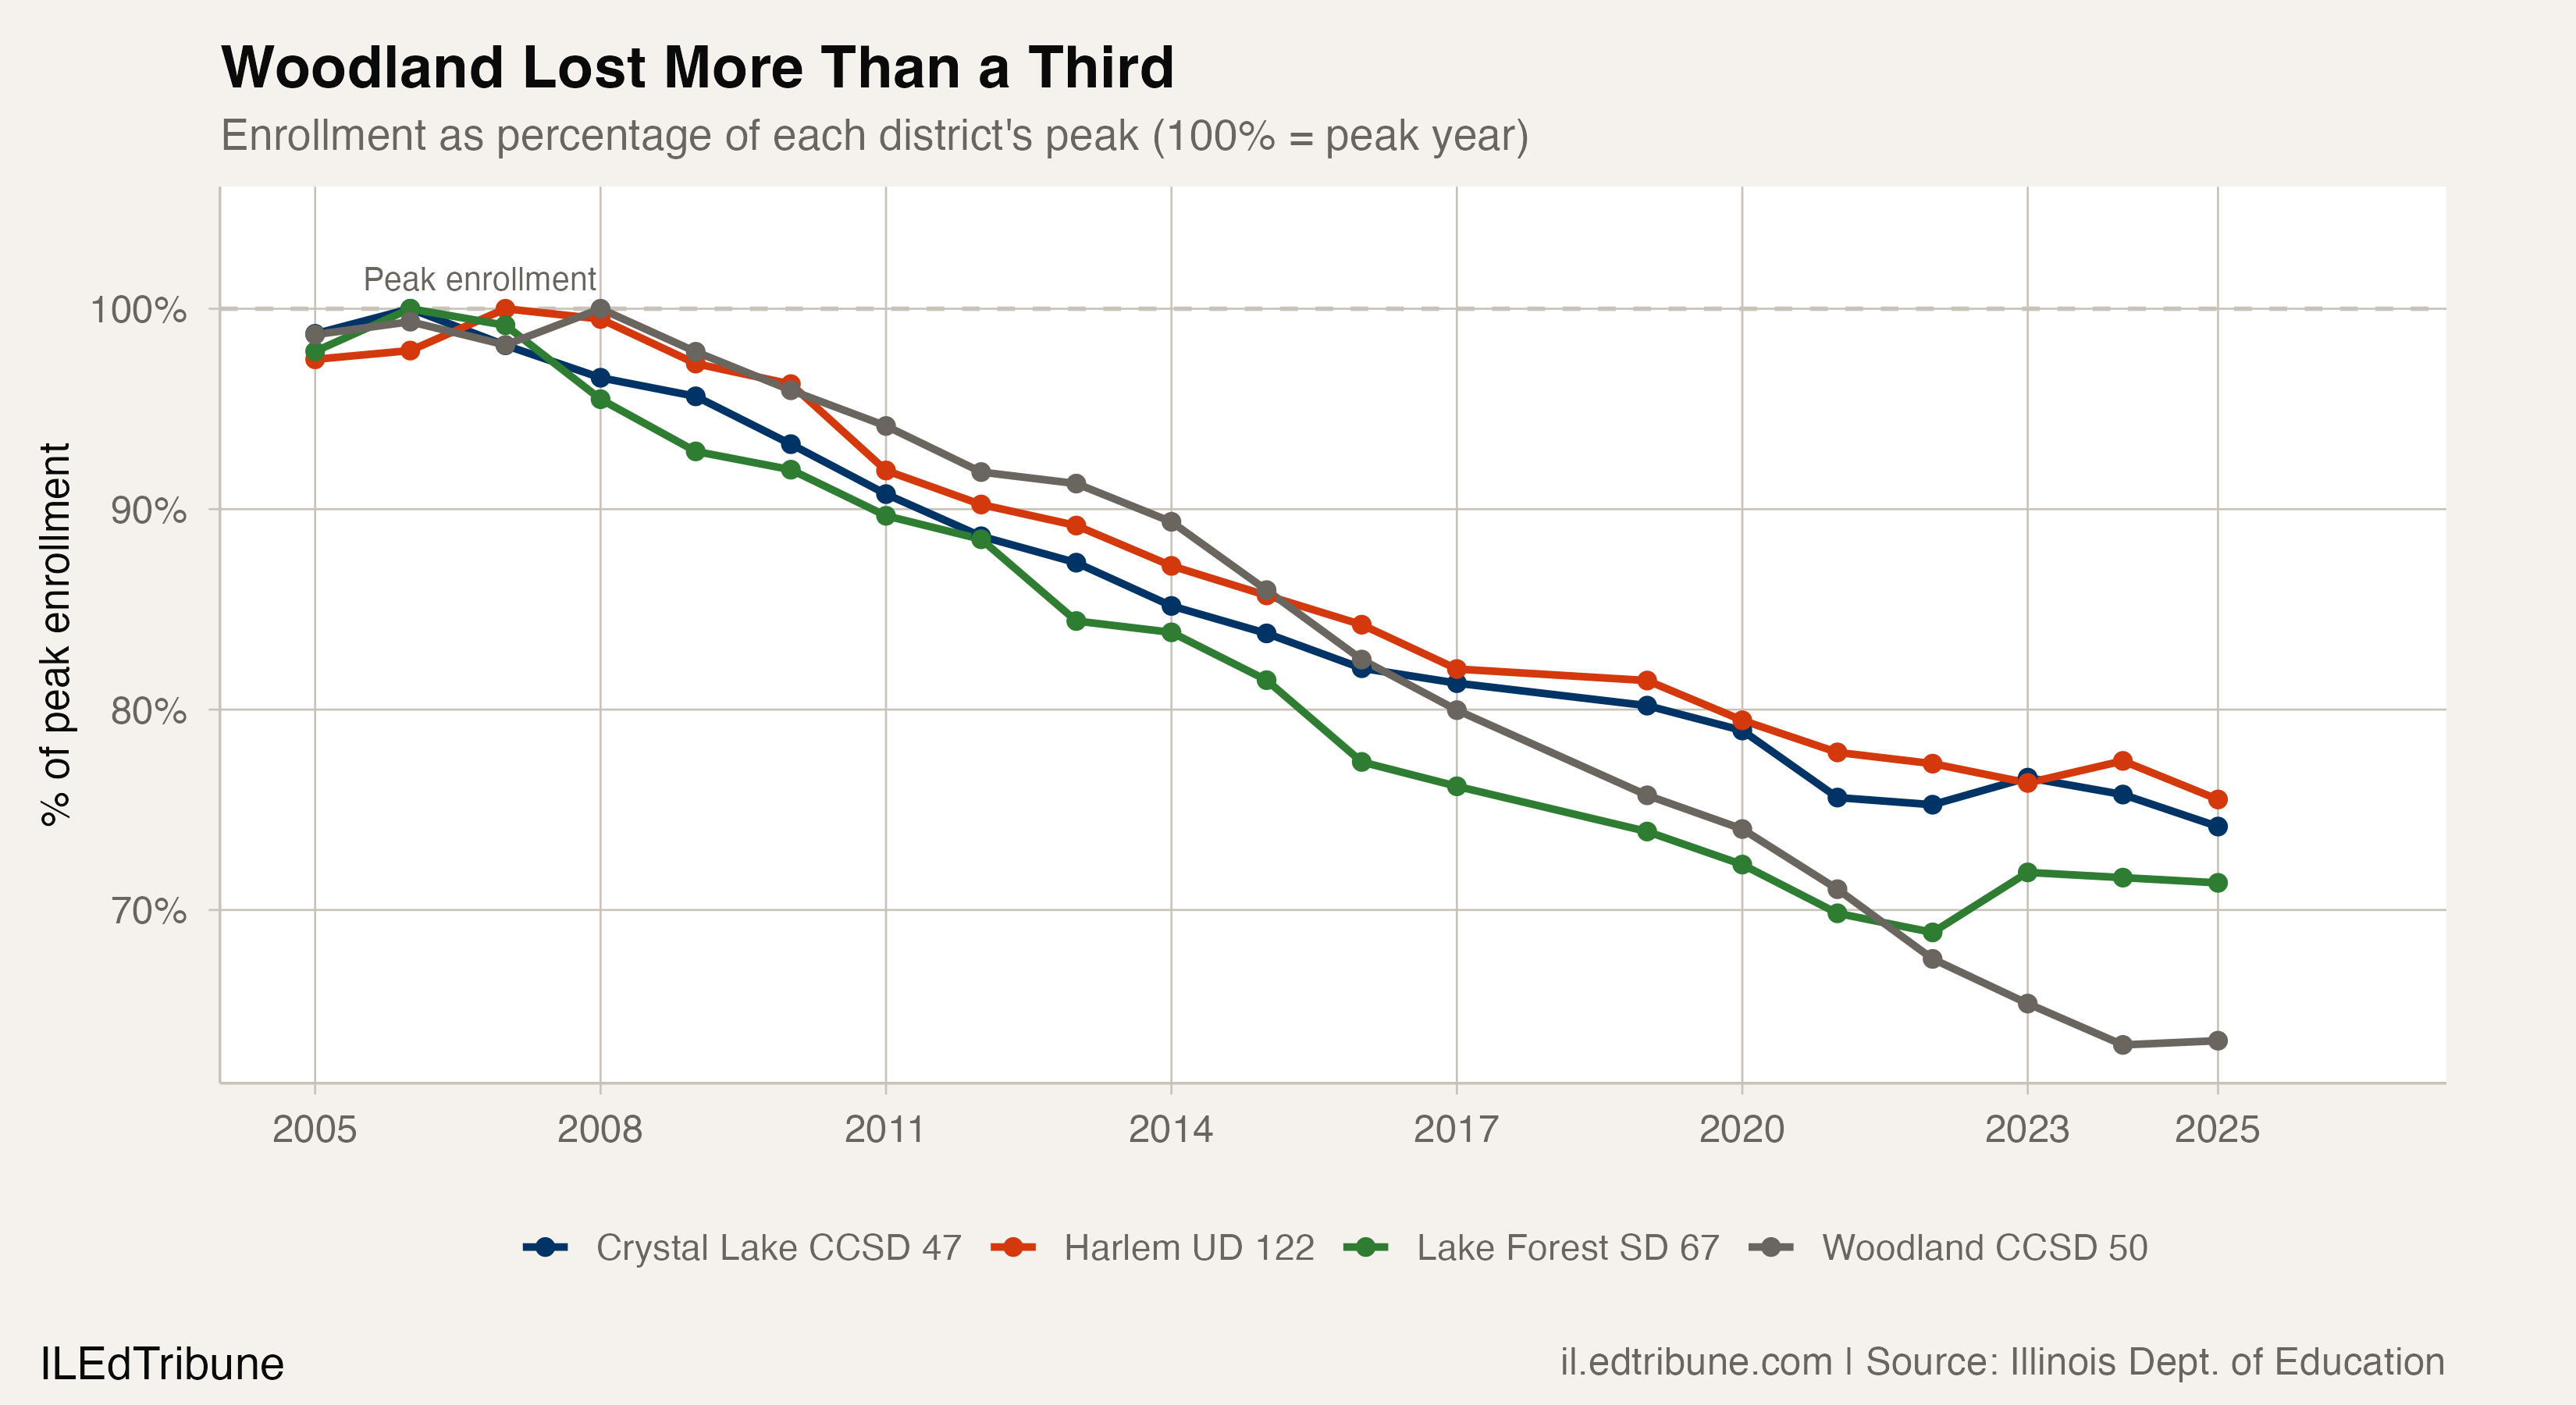
For 15 consecutive years, from the 2008-09 school year through 2023-24, Woodland lost students every single fall. The streak was, until that 15-student gain, the longest active decline run in Illinois. It was also the most destructive: Woodland enrolled 7,130 students at its peak and now serves 4,526, a loss of 36.5%. More than a third of its student body is gone.
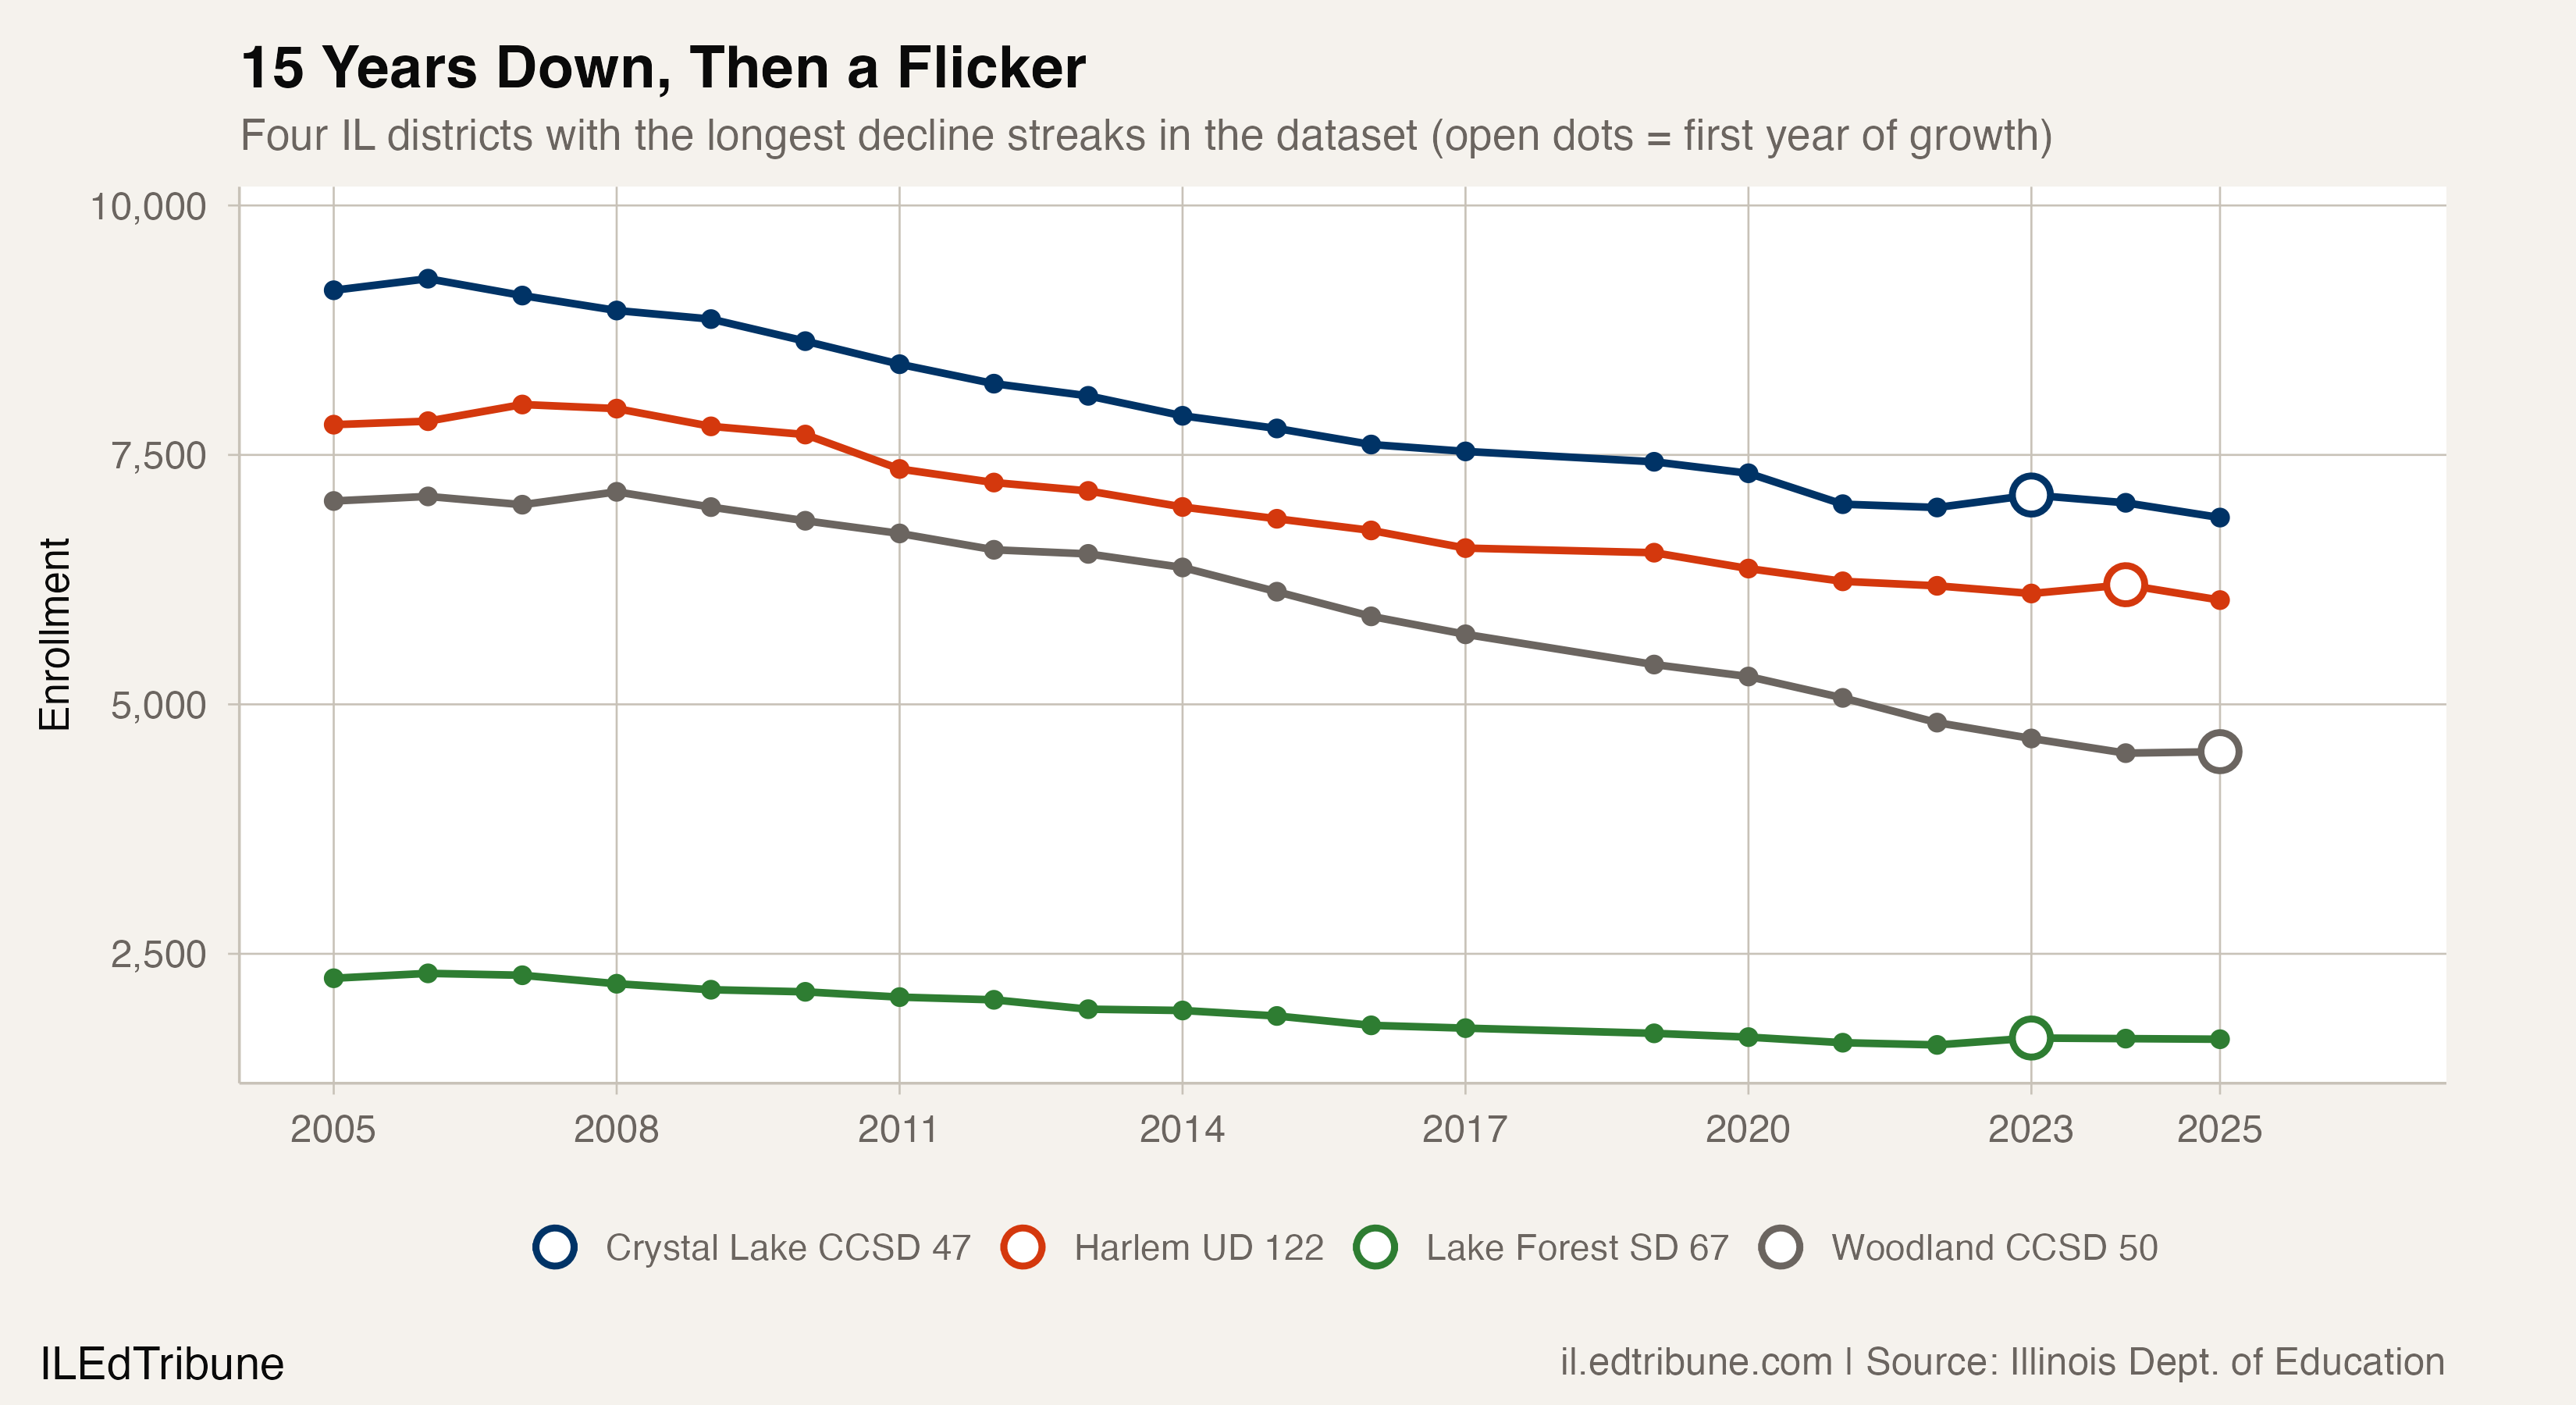
Woodland is not alone. Three other districts tied for the same record. Crystal Lake CCSD 47↗ET in McHenry County, Lake Forest SD 67↗ET on the affluent North Shore, and Harlem UD 122↗ET near Rockford each posted 15 straight years of enrollment decline. Together, the four lost 7,523 students from their respective peaks, a combined 28.2% of their enrollment. They are spread across three counties, serve different demographics, and share almost nothing in common except the relentless direction of the line on the chart.
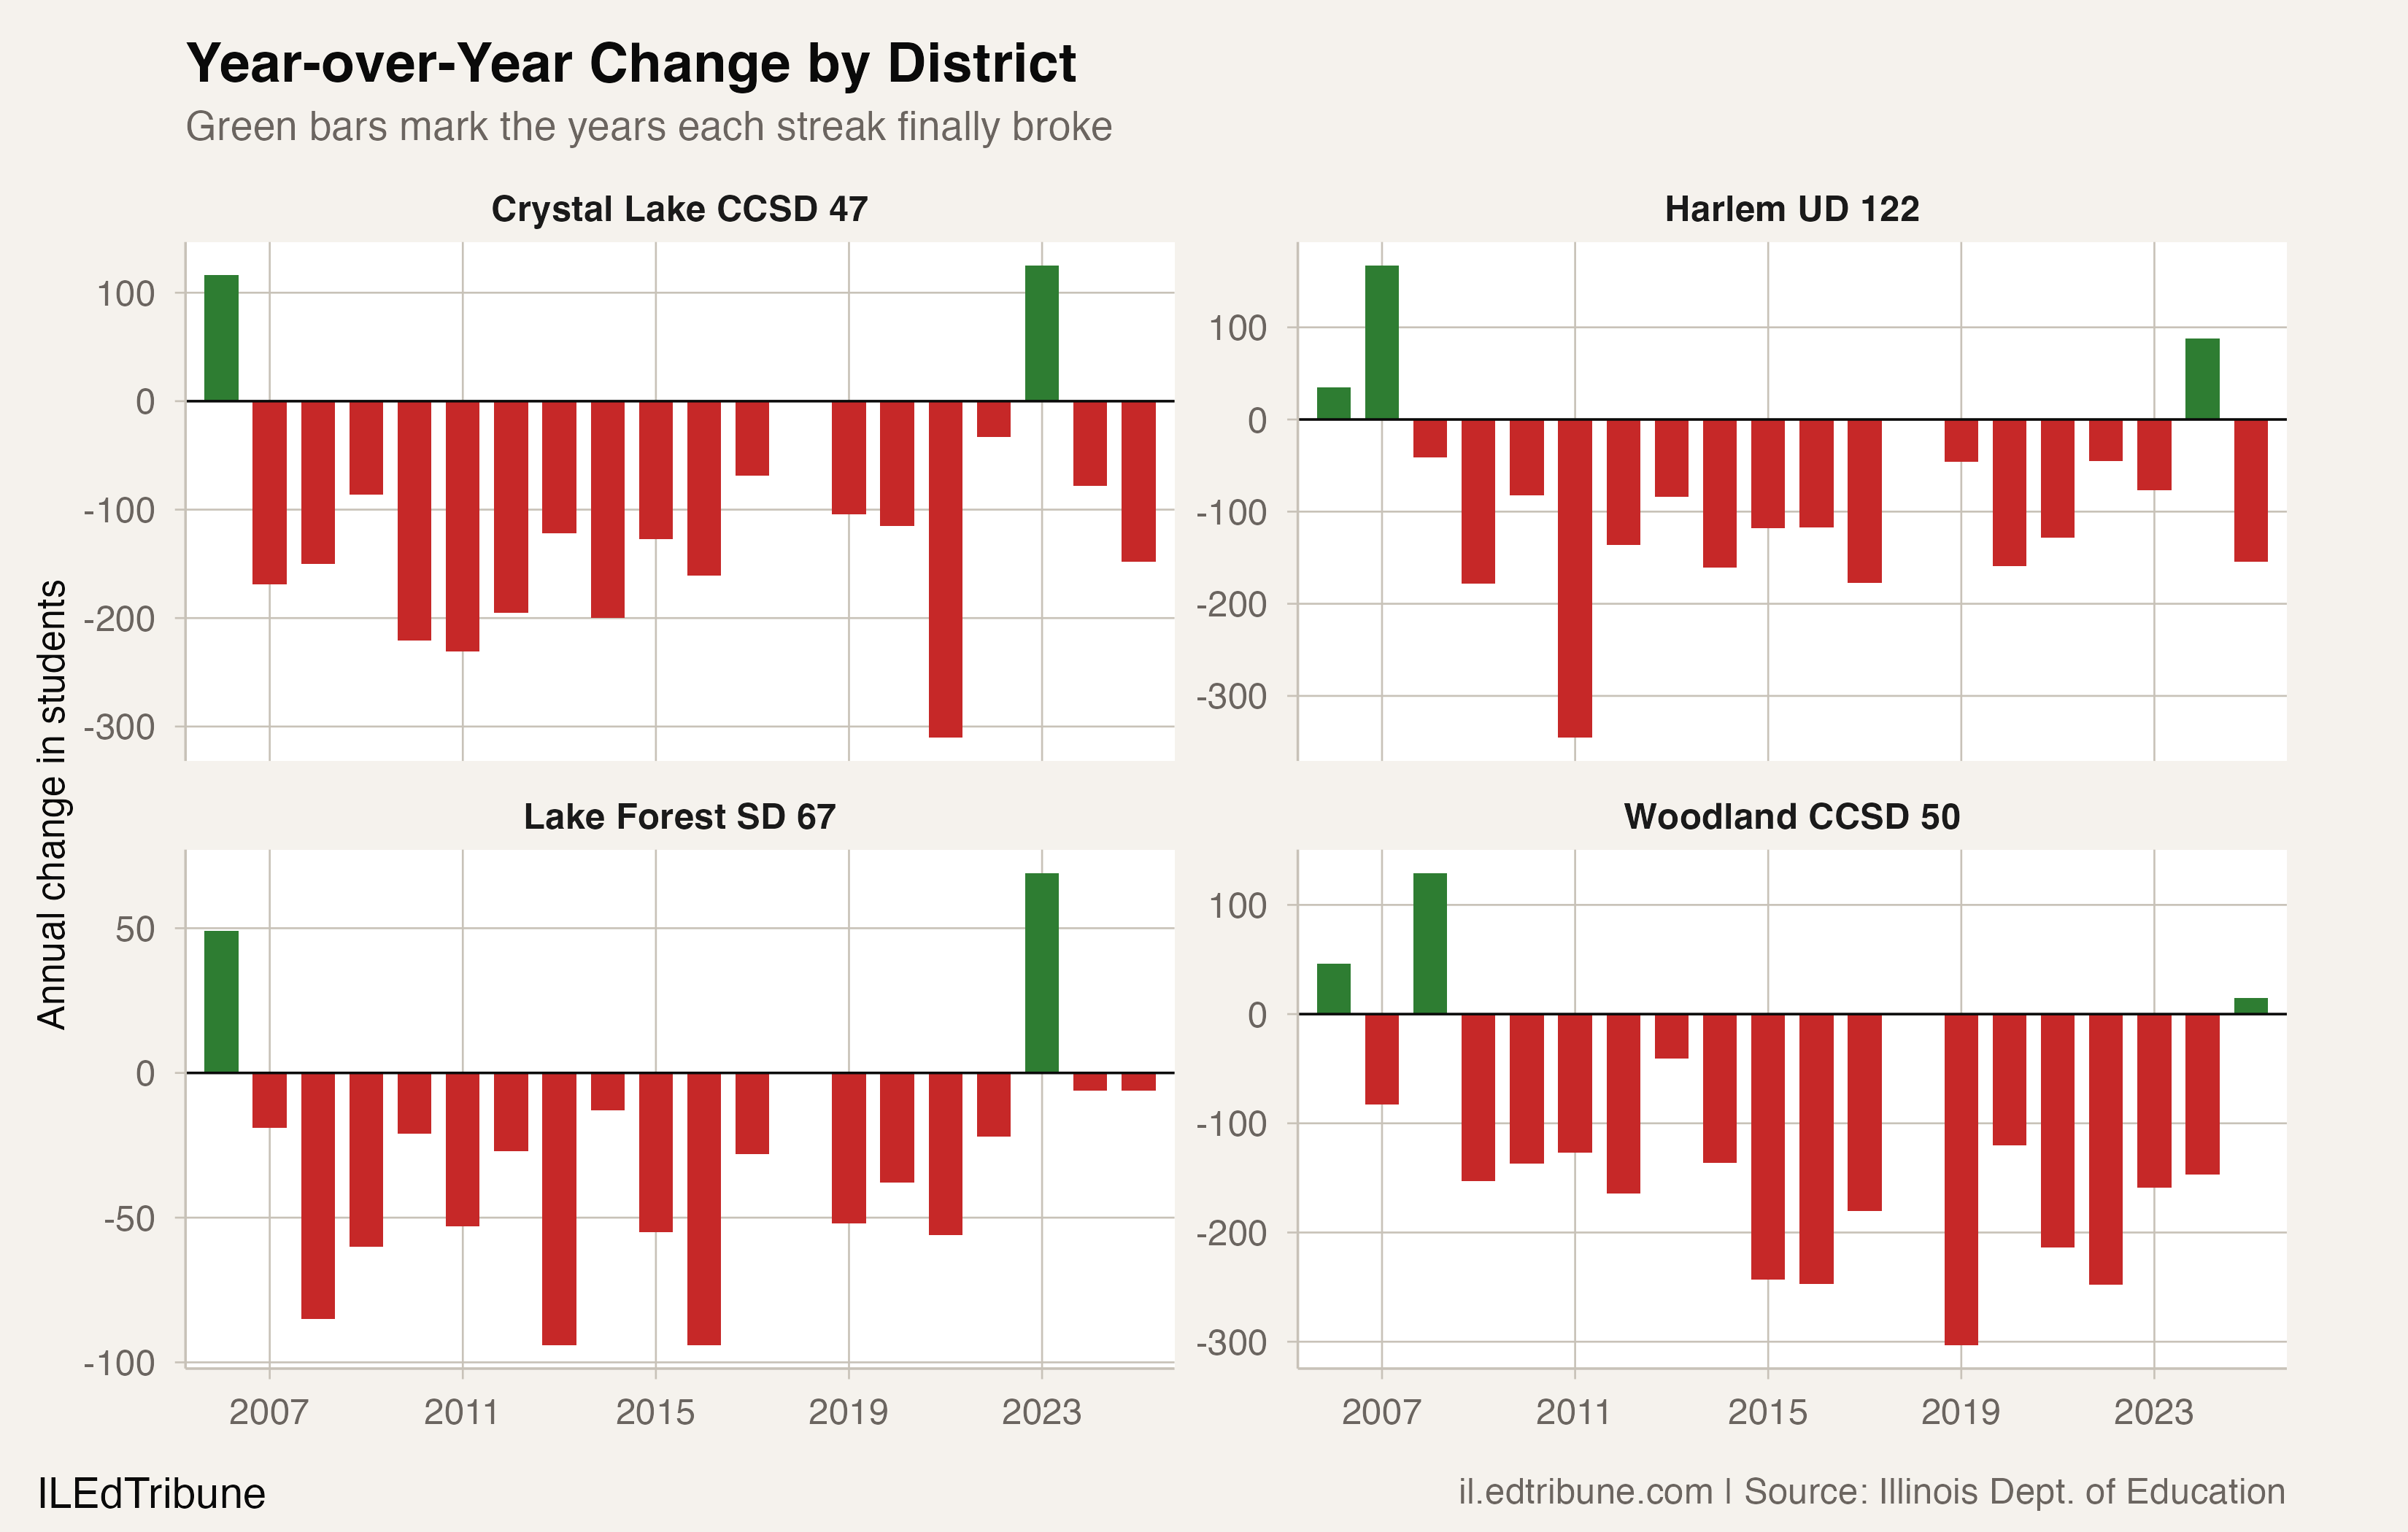
All four streaks have now broken. Crystal Lake and Lake Forest snapped theirs in 2023. Harlem followed in 2024. Woodland's ended with that 15-student gain in 2025. But the breaks have been modest, and three of the four districts have already resumed declining.
The anatomy of a 15-year streak
A note on methodology: Illinois State Board of Education data for the 2017-18 school year is unavailable due to a file error in the ISBE archive. Each of these streaks spans that gap. In all four cases, enrollment was lower in 2019 than in 2017, so the gap does not interrupt the streak. The 15 decline "steps" count the 2017-to-2019 transition as a single step covering a two-year span.
The streaks began at different times but followed a similar script. Crystal Lake and Lake Forest peaked in 2006, at the tail end of Chicago's suburban boom. Harlem peaked in 2007. Woodland held on until 2008, then joined the slide. The Great Recession froze the real estate market that had been feeding families into these communities, and the pipeline never fully reopened.
Crystal Lake fell from 9,266 to 6,973 during its 15-year streak, losing 2,293 students, a 24.7% decline. Lake Forest dropped from 2,304 to 1,587, losing 717 students, 31.1% of its enrollment. Harlem went from 8,005 to 6,111, a loss of 1,894 (23.7%). Woodland fell the hardest in both absolute and percentage terms: from 7,130 to 4,511, losing 2,619 students (36.7%).
The breaks that barely registered
The streak-breaking gains were small enough to be rounding errors. Crystal Lake added 125 students in 2023, the largest rebound of the four. Lake Forest gained 69. Harlem gained 88. Woodland gained 15.
None of the gains lasted. Crystal Lake lost 78 students the following year and 148 more in 2025, ending the year at 6,872, its lowest enrollment on record. Lake Forest lost six students in each of the two years after its break, settling at 1,644. Harlem gained 88 in 2024, then lost 154 in 2025, dropping to 6,045, also a record low.
Woodland's break came just last fall, so its durability is untested. The district has lost more than a third of its students since 2008. A gain of 15 in the context of a 2,619-student decline is not a reversal. It is a pause.
The demographic engine beneath the decline
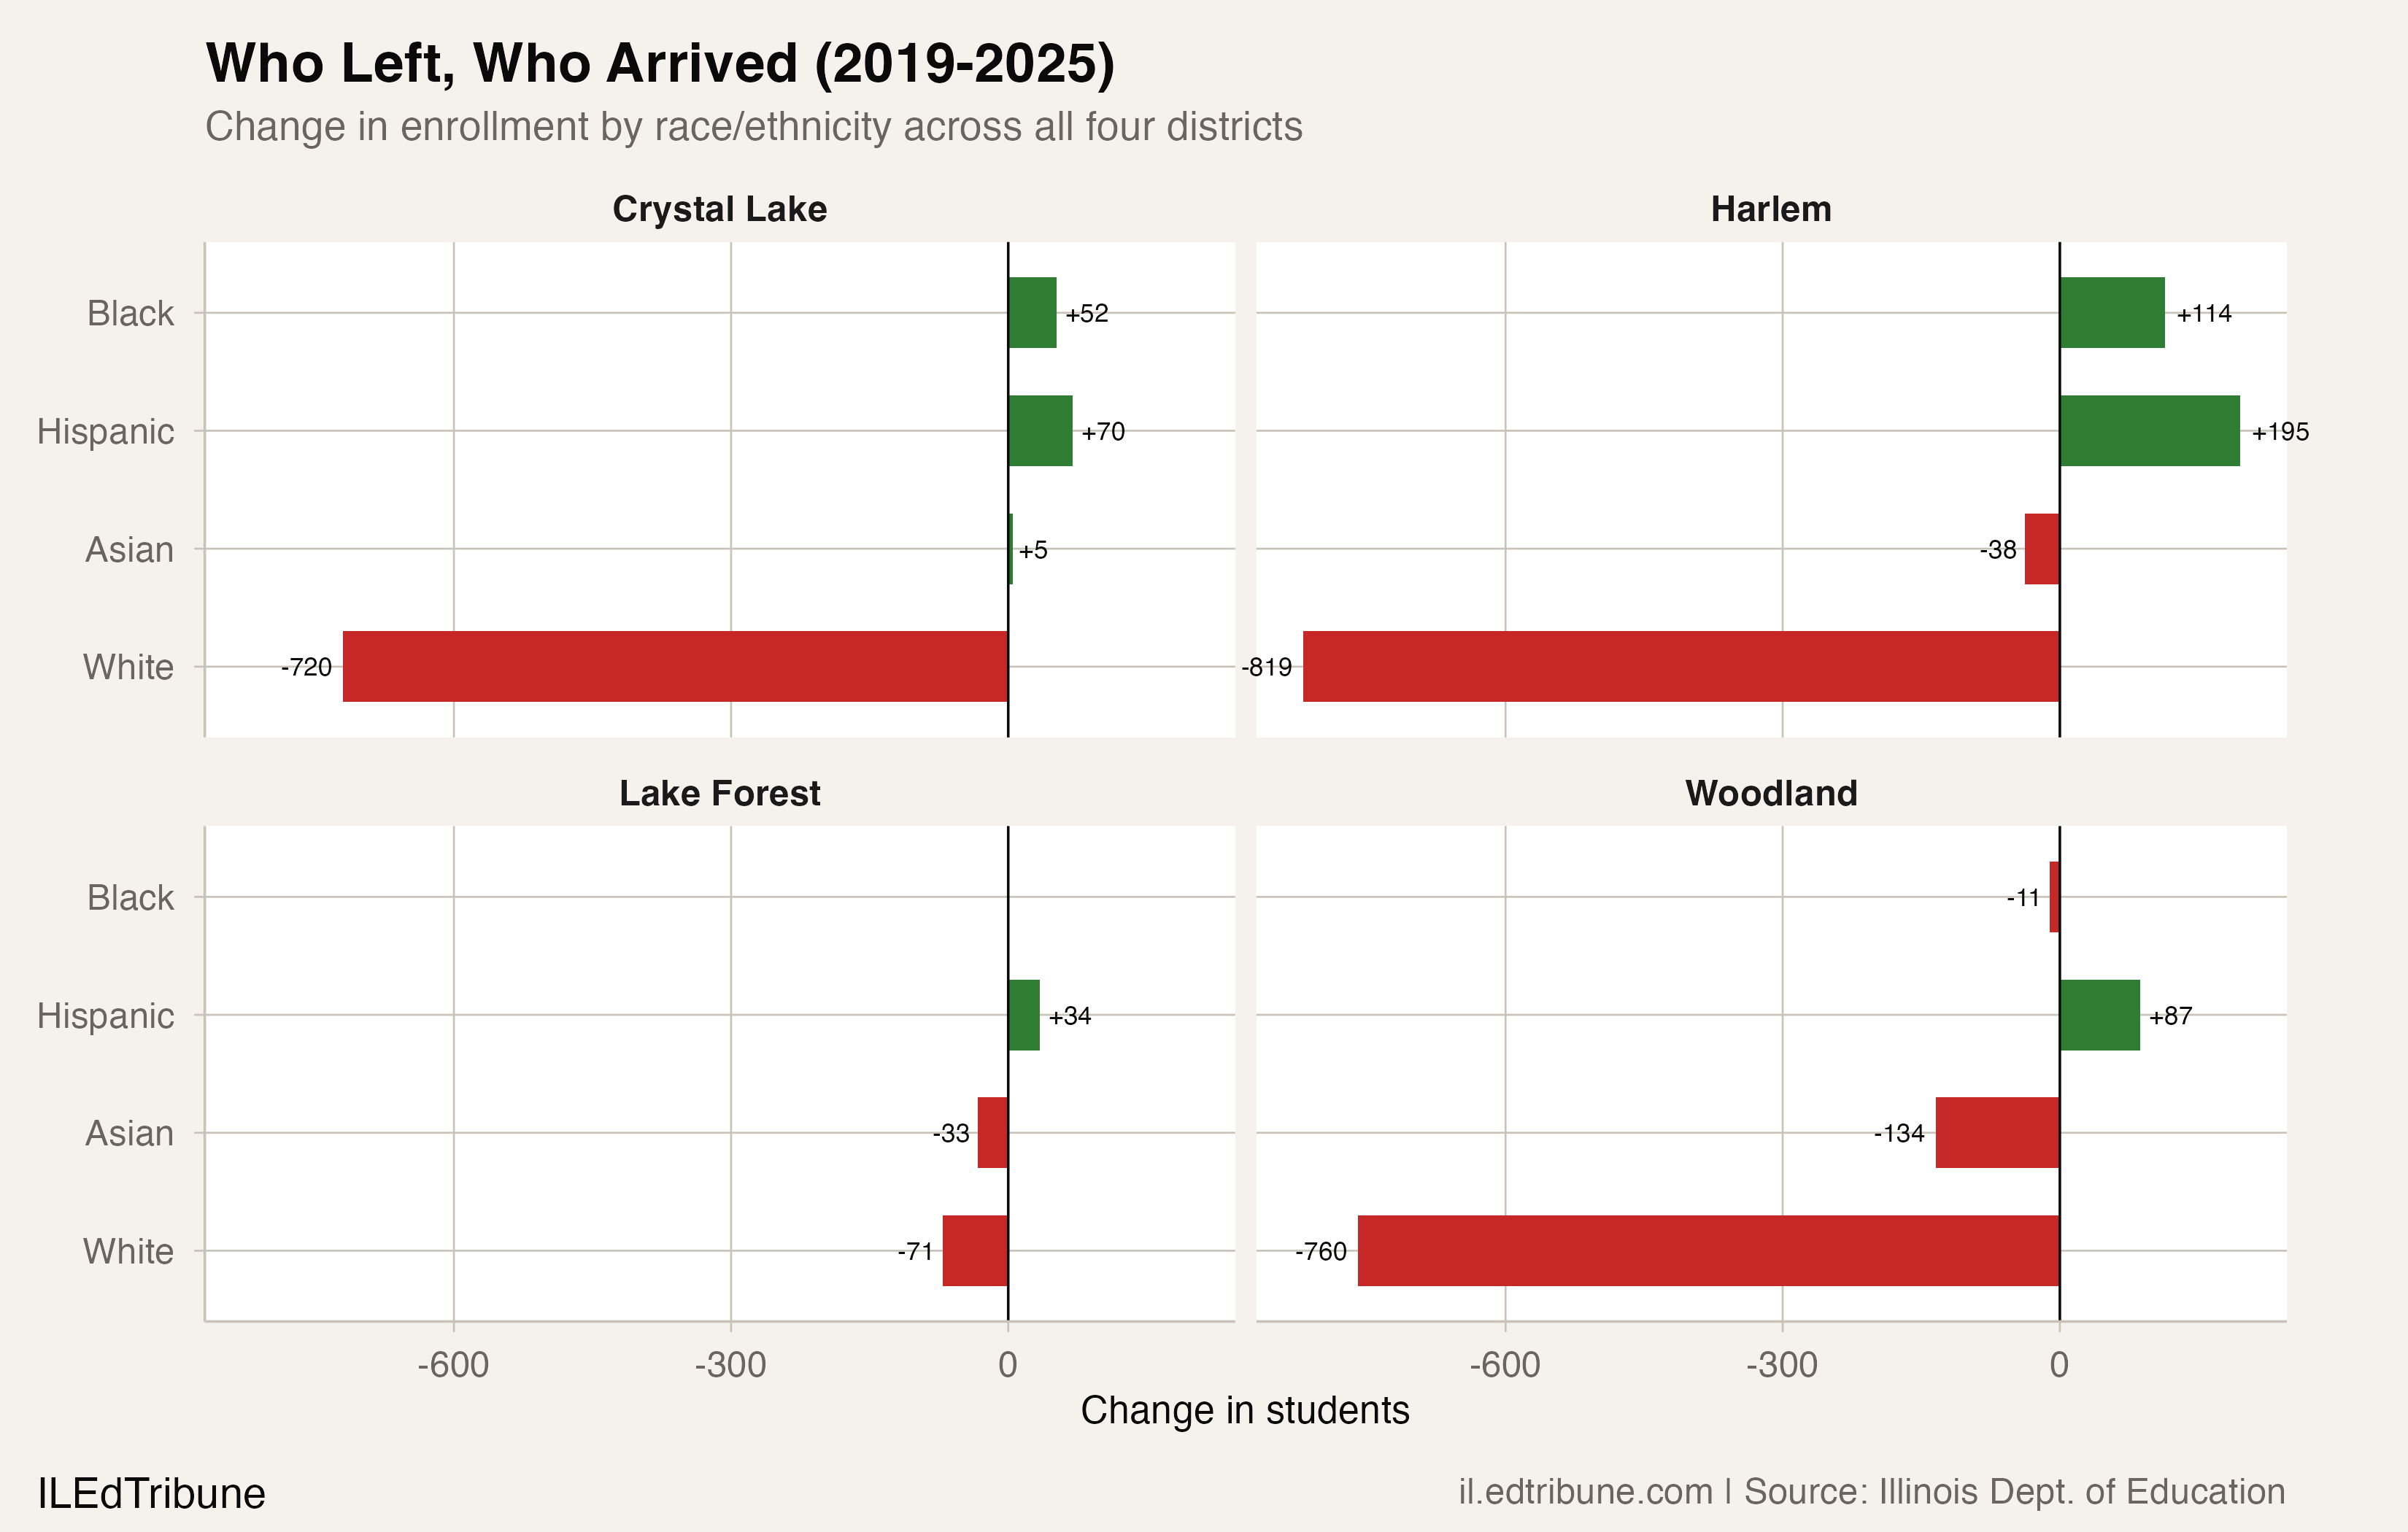
White enrollment losses drove the declines in all four districts, but the scale varied. Between 2019 and 2025, Harlem lost 819 white students while gaining 195 Hispanic students and 114 Black students. Its white share fell from 71.9% to 64.0%. Crystal Lake lost 720 white students against gains of 70 Hispanic and 52 Black students, with its white share dropping from 69.9% to 65.1%.
Woodland's shift has been the most striking. White students made up 41.4% of enrollment in 2019 and 32.6% in 2025, a near-nine-percentage-point drop in six years. Hispanic students now make up 41.4% of the district, up from 33.1%. The crossover happened around 2022, when Hispanic enrollment surpassed white enrollment for the first time. Yet total enrollment kept falling because white departures outpaced Hispanic gains by nearly nine to one: Woodland lost 760 white students while gaining 87 Hispanic students over the period.
Lake Forest, where 84.8% of students are white, has barely diversified. Its losses are overwhelmingly a story of affluent families aging in place or leaving without replacement.
Fewer families, older neighborhoods
The most likely explanation for these synchronized declines is demographic: Illinois is losing its youngest residents faster than any other state. The under-18 population fell by more than 172,000 between 2020 and 2024, a 6% decline that outpaced every state in the country by percentage. The median age in Illinois rose from 38.6 to 39.4 in the same period.
The collar counties around Chicago have not been spared. McHenry County, home to Crystal Lake, projects as much as a 12% decline in high school graduates between 2024 and 2030, according to McHenry County College's environmental scan, a consequence of shrinking K-12 feeder enrollment. Winnebago County, where Harlem is located, has lost population steadily since 2010, declining from 295,090 to roughly 286,900, a 2.8% drop over 16 years.
An alternative factor is school choice. Illinois public schools have lost roughly 136,000 students since before the pandemic, and while most of that loss is concentrated in Chicago, suburban districts in the collar counties have not been immune. The now-expired Invest in Kids scholarship program funded private school tuition for more than 15,000 students in its final year.
For Lake Forest specifically, the connection between housing markets and enrollment is unusually direct. When the 2008 recession froze the Chicago condo market, families who would have sold and moved to affluent North Shore suburbs stopped arriving. The district's kindergarten enrollment cratered, and the pipeline never fully recovered.
Composition is changing even as totals fall
The enrollment declines mask a compositional shift that compounds the operational challenge. In all four districts, the share of students receiving specialized services has grown even as total enrollment contracted.
At Harlem, special education enrollment rose from 1,434 to 1,693 between 2019 and 2025, pushing the special education rate from 22.0% to 28.0%. One in four Harlem students is now entitled to an IEP. Woodland's special education count grew from 740 to 1,050, a 41.9% increase, even as total enrollment fell 16.2%. Its English learner population grew from 1,182 to 1,435, and EL students now make up 31.7% of the district.
Crystal Lake's English learner count rose from 832 to 1,086, with EL students now accounting for 15.8% of enrollment. Its economically disadvantaged share climbed from 28.0% to 33.8%.
These shifts create a structural mismatch: districts with fewer students overall face growing demand for instructional programs that carry higher per-pupil costs. The funding formula allocates based on headcount, but the cost of educating the remaining students is rising.
Eleven districts still falling
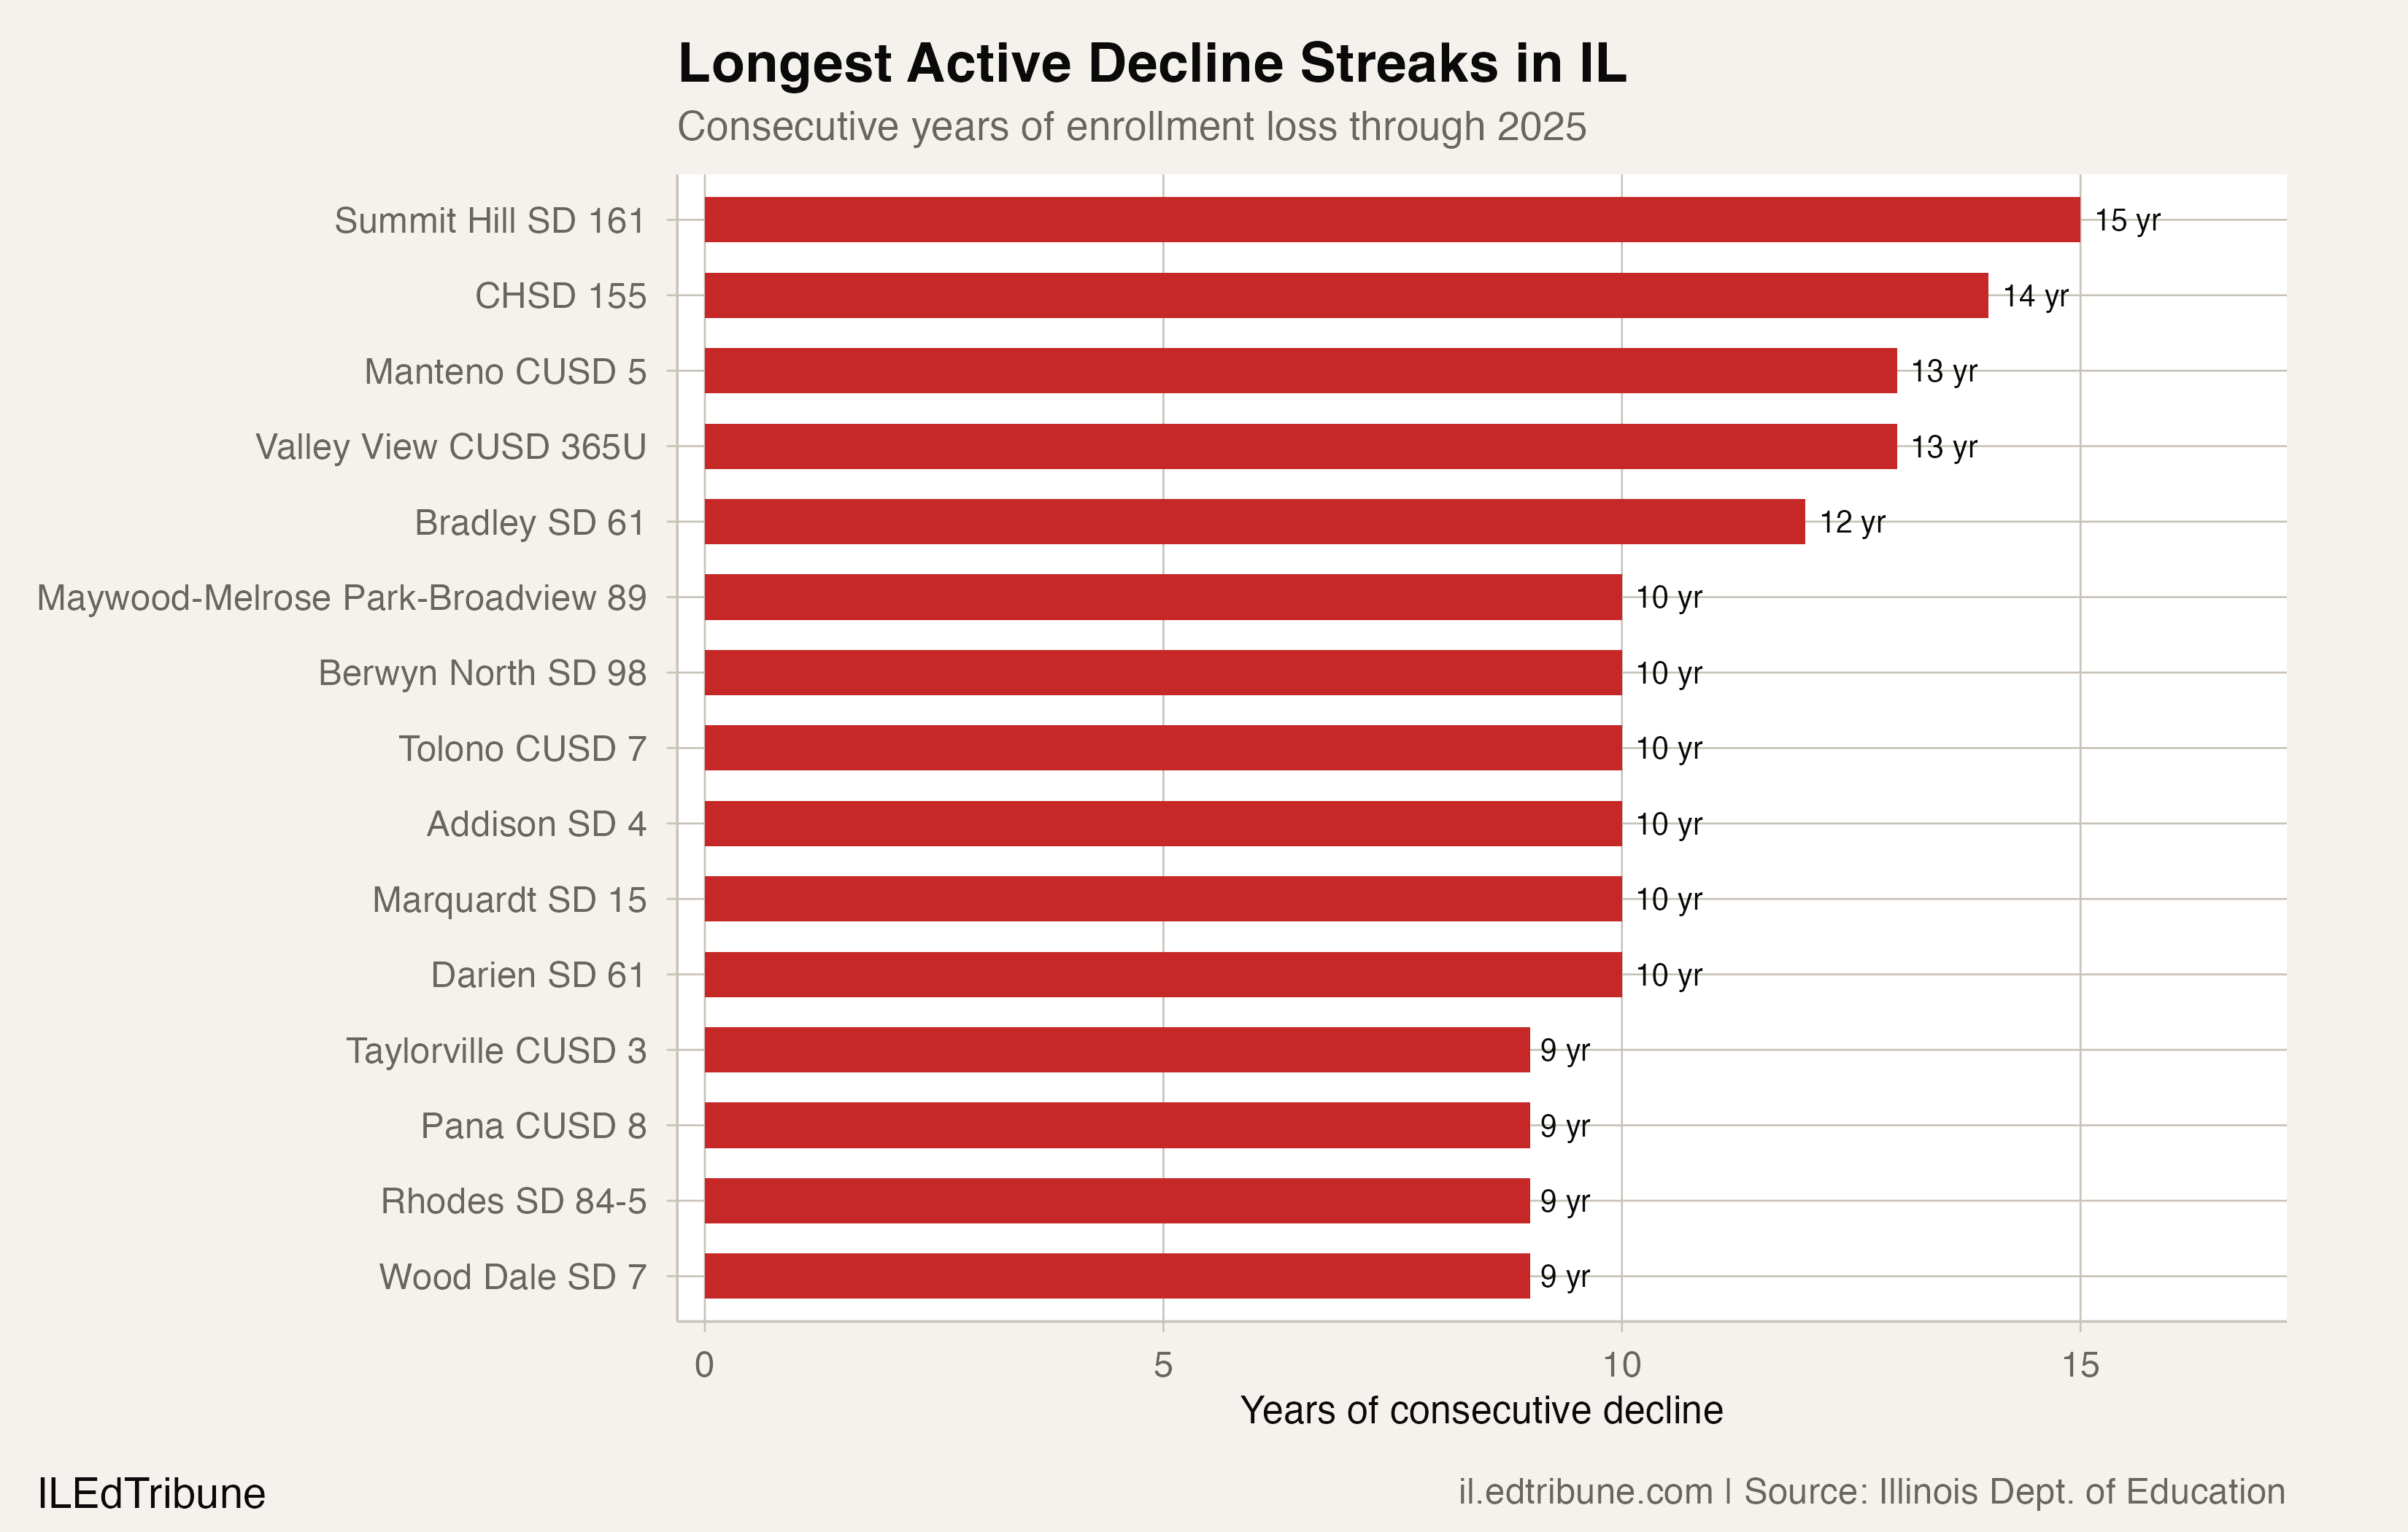
The four 15-year streaks are now broken, but other Illinois districts have taken their place. Summit Hill SD 161 in Frankfort, a Will County suburb south of Chicago, has been declining for 15 consecutive years and shows no sign of stopping: it lost 60 more students in 2025, falling to 2,309 from a peak of 3,698. CHSD 155, the high school district that serves Crystal Lake's feeder area, has declined for 14 straight years. Manteno CUSD 5 and Valley View CUSD 365U have each declined for 13.
In all, 11 Illinois districts have current decline streaks of 10 years or longer. Another 80 have streaks of five to nine years. Of the state's roughly 955 districts with at least a decade of enrollment history, 564, or 59%, lost students in the most recent year.
What a 15-student gain does not fix
Woodland's 15-student rebound does not undo the 2,619 students it lost during the streak. It does not reopen closed classrooms or restore eliminated positions. A district that has shrunk by more than a third operates on a fundamentally different scale than the one that existed when the decline began.
The question now is whether the streak breaks signal the beginning of stabilization or just statistical noise, a single year's blip before the trend resumes. For Crystal Lake, Lake Forest, and Harlem, the early evidence is discouraging: all three resumed declining within a year of their breaks. For Woodland, the answer depends on whether the small Hispanic enrollment gains that drove the 2025 uptick can overcome the ongoing white enrollment losses.
Illinois lost another 26,800 residents under 18 last year. The demographic forces that powered these 15-year streaks have not reversed. They have merely, in four districts, paused long enough to register a single green bar on the chart.
Detailed code that reproduces the analysis and figures in this article is available exclusively to EdTribune subscribers.
Discussion
Sign in to join the discussion.
Loading comments...