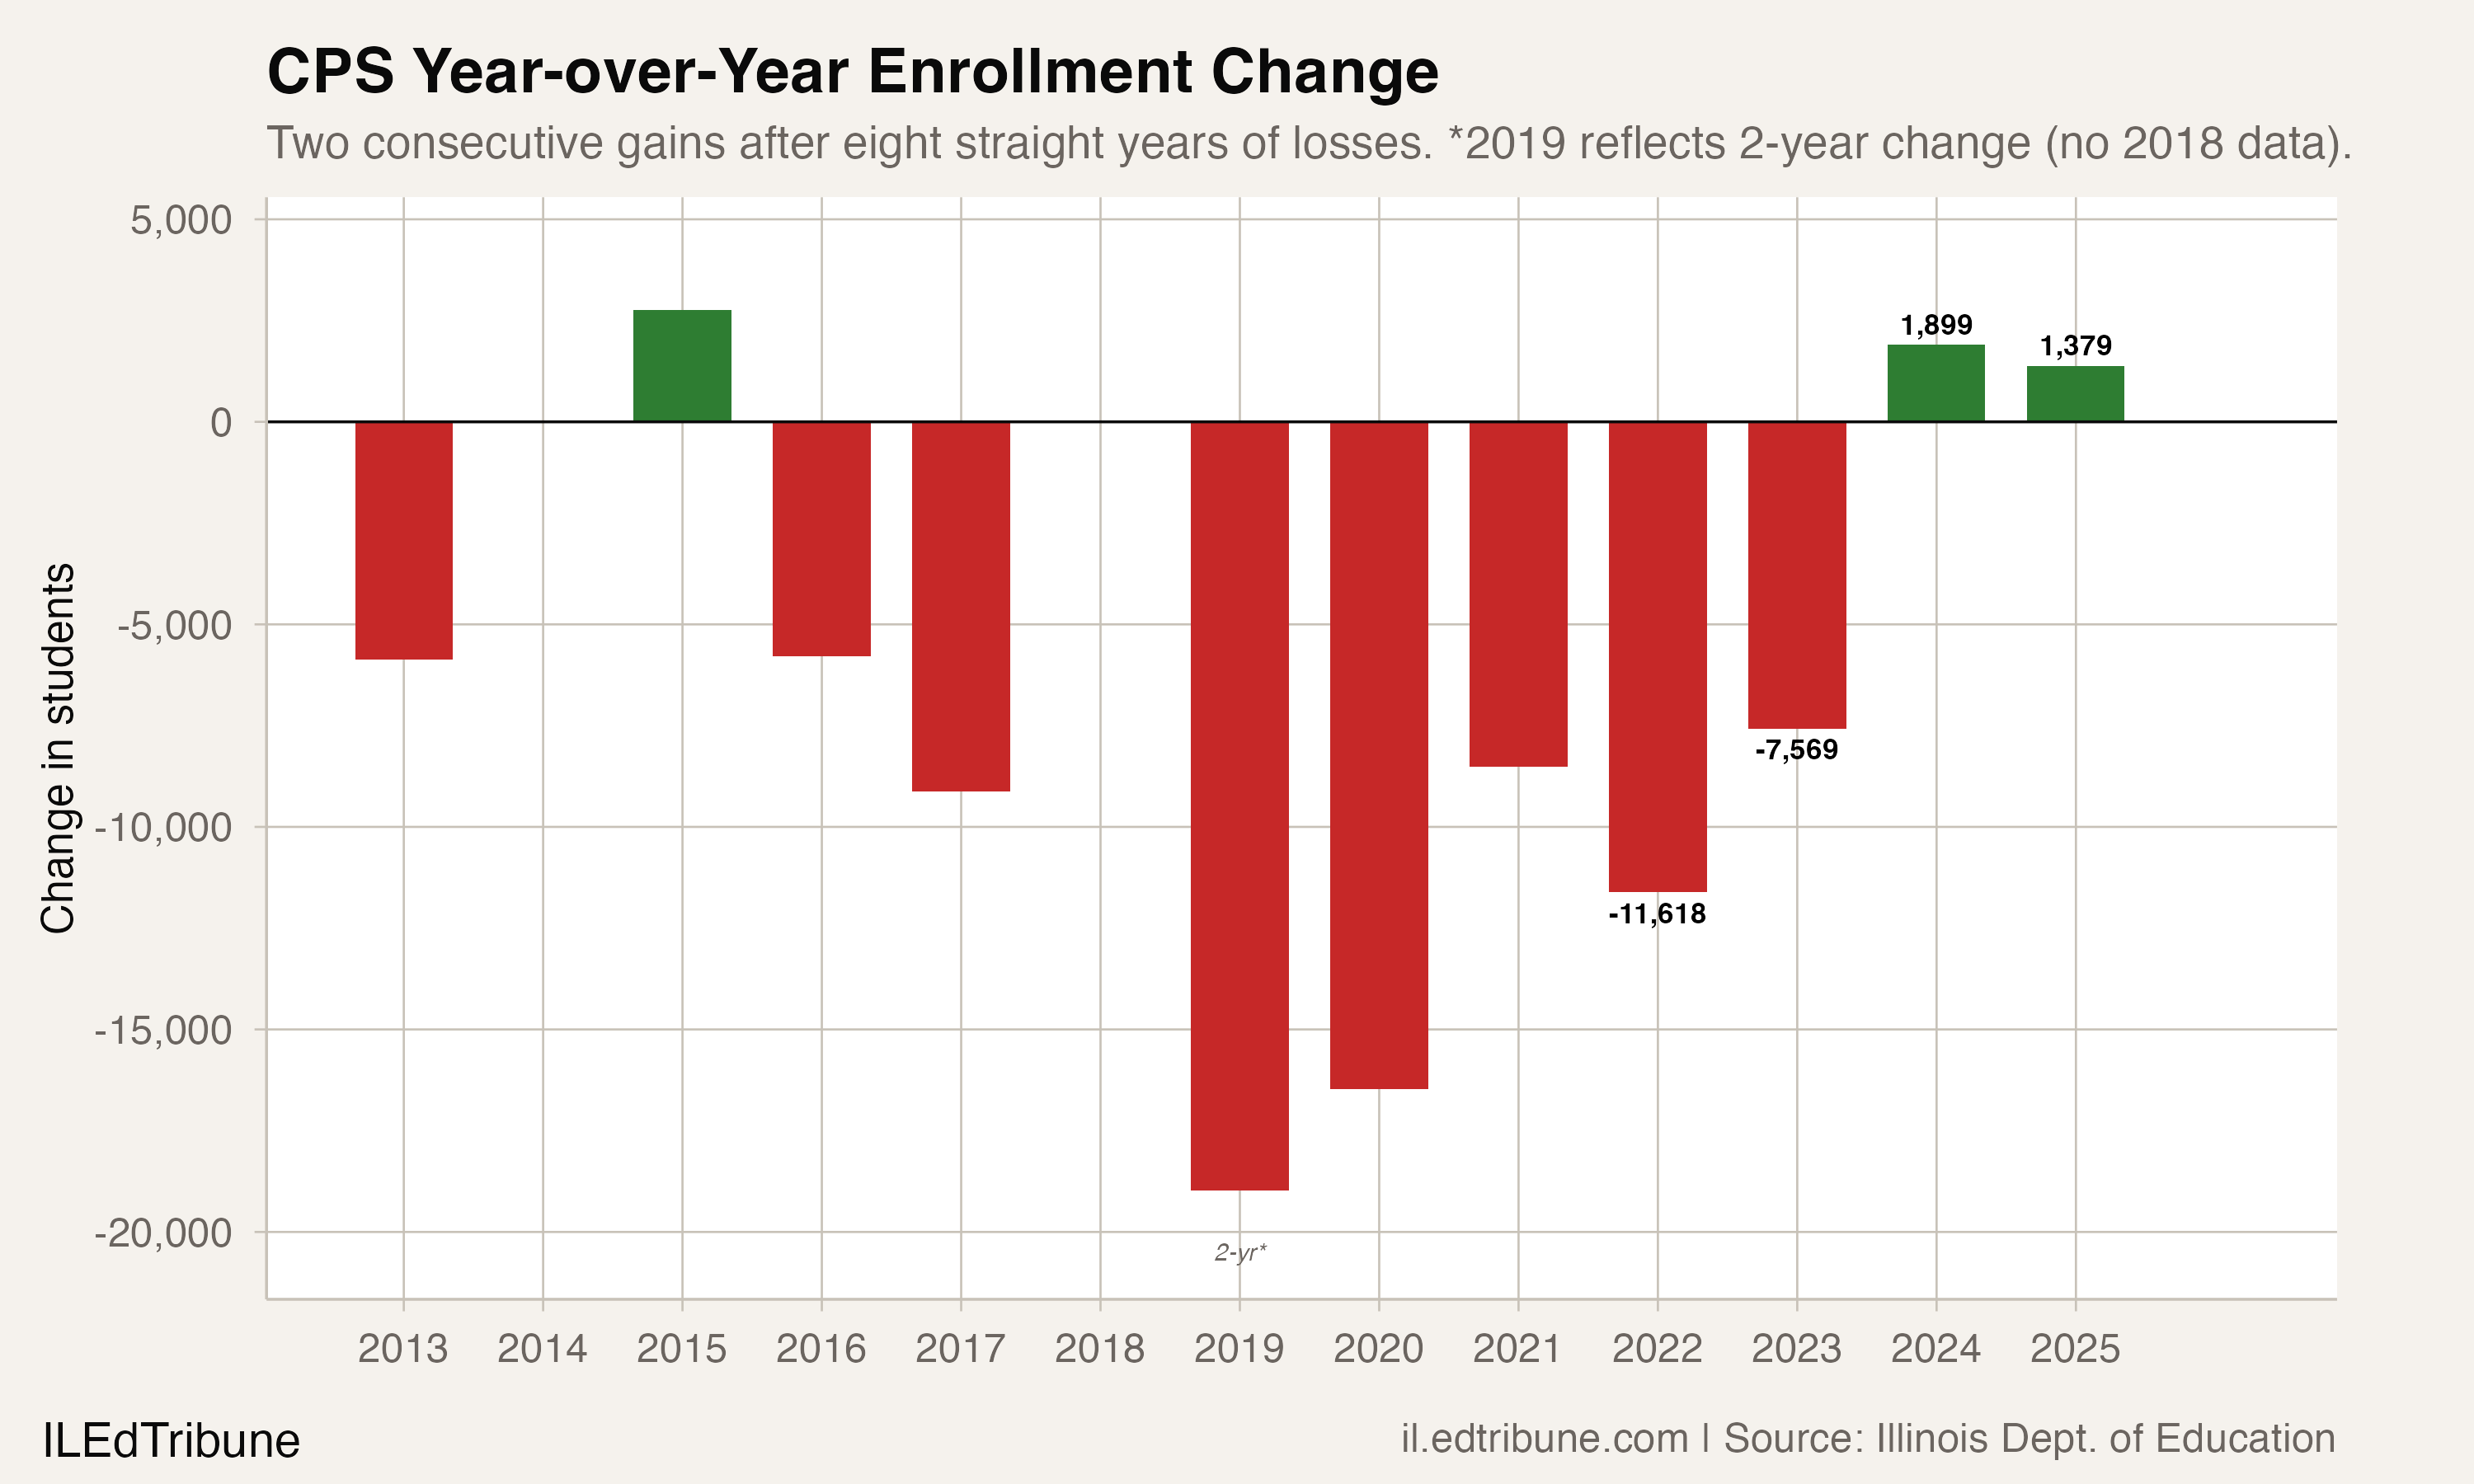
Chicago Public Schools↗ET added 1,379 students in 2024-25. The year before, it added 1,899. Those two numbers, modest in isolation, represent something the district has not done since 2014-15: grow in consecutive years.
The reversal snaps an eight-year run of losses that erased more than 72,000 students from the district's rolls between 2016 and 2023. But celebrating a 3,278-student rebound requires ignoring the 87,827 students CPS has lost since 2005, a 21.4% decline that has left 35% of the district's seats empty.
The enrollment gains and the enrollment hole are not contradictions. They are the same story, told at different zoom levels.
Two gains, one engine
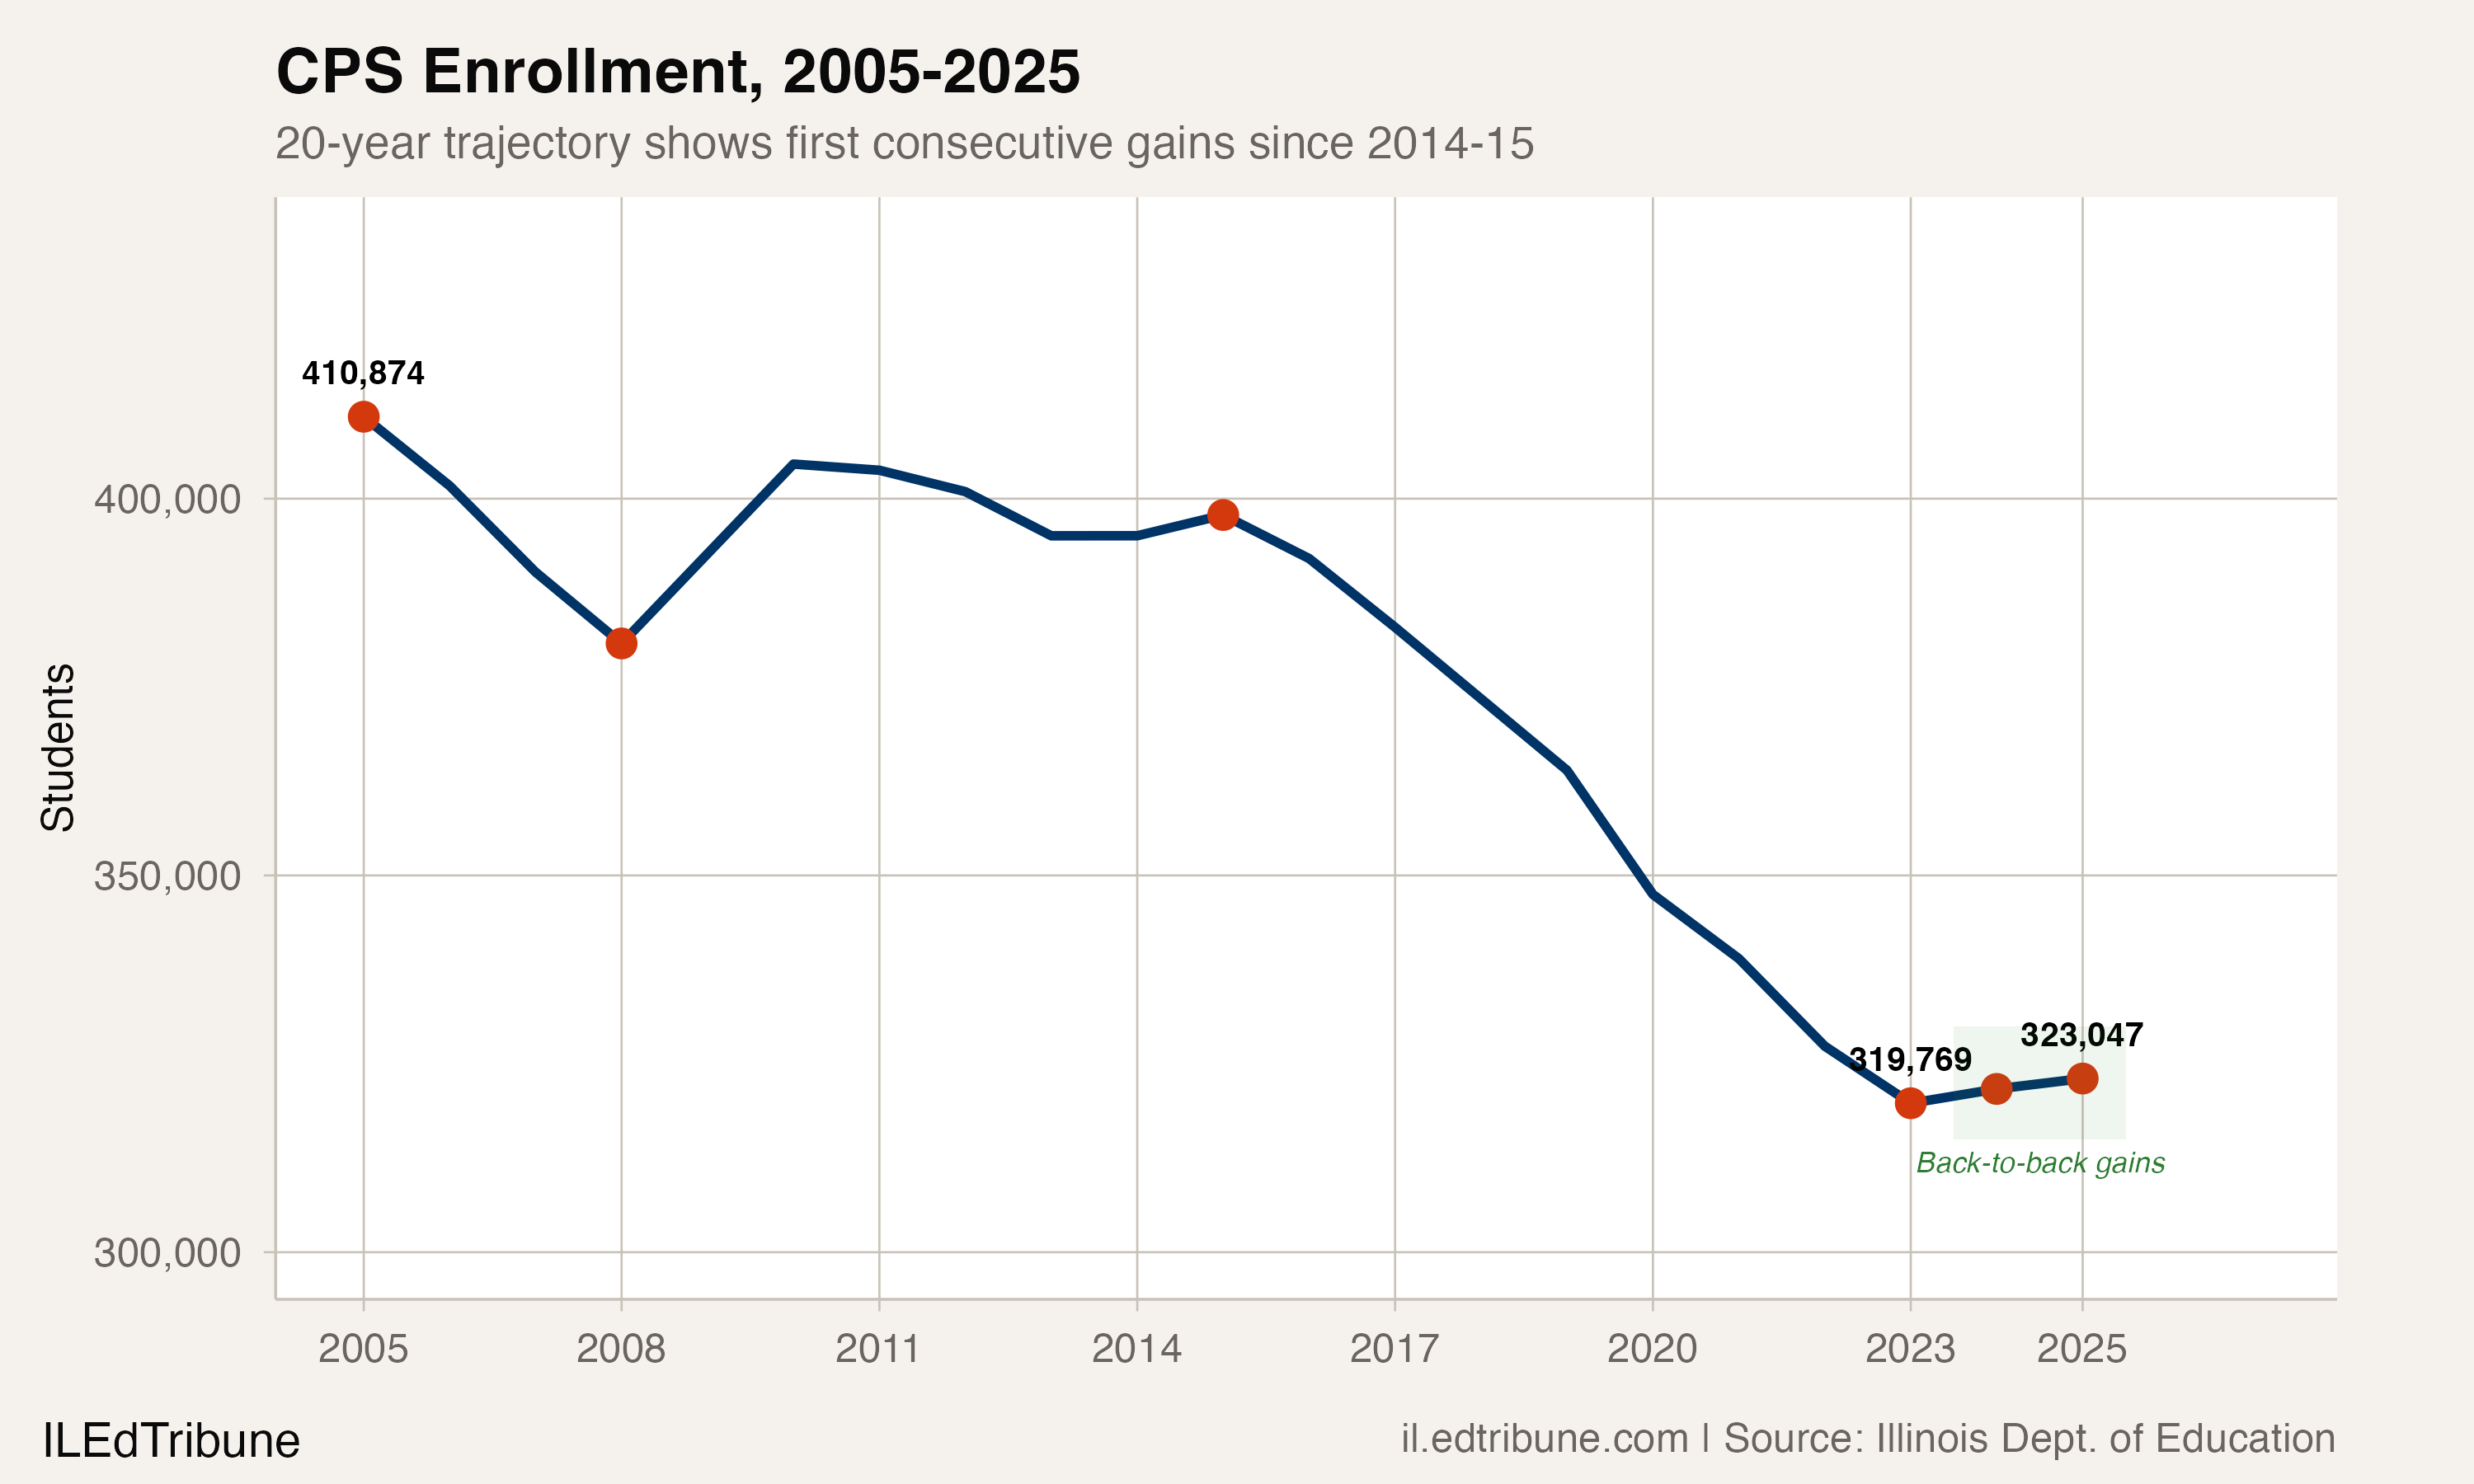
Between 2005 and 2023, CPS enrollment fell from 410,874 to 319,769. The decline was not steady. The worst stretch came during and after the pandemic: the district lost 44,185 students in the four years from 2019 to 2023, a 12.1% collapse that nearly matched the decline of the entire 2005-2019 period.
Then, in 2024, the line turned. CPS gained 1,899 students. In 2025, it gained another 1,379, bringing enrollment to 323,047.
The source of that growth is concentrated. English learner enrollment at CPS jumped from 73,227 in 2023 to 83,634 in 2024 to 91,422 in 2025, a 24.8% increase in two years. EL students now account for 28.3% of all CPS enrollment, up from 19.4% in 2019. More than one in four CPS students is classified as an English learner.
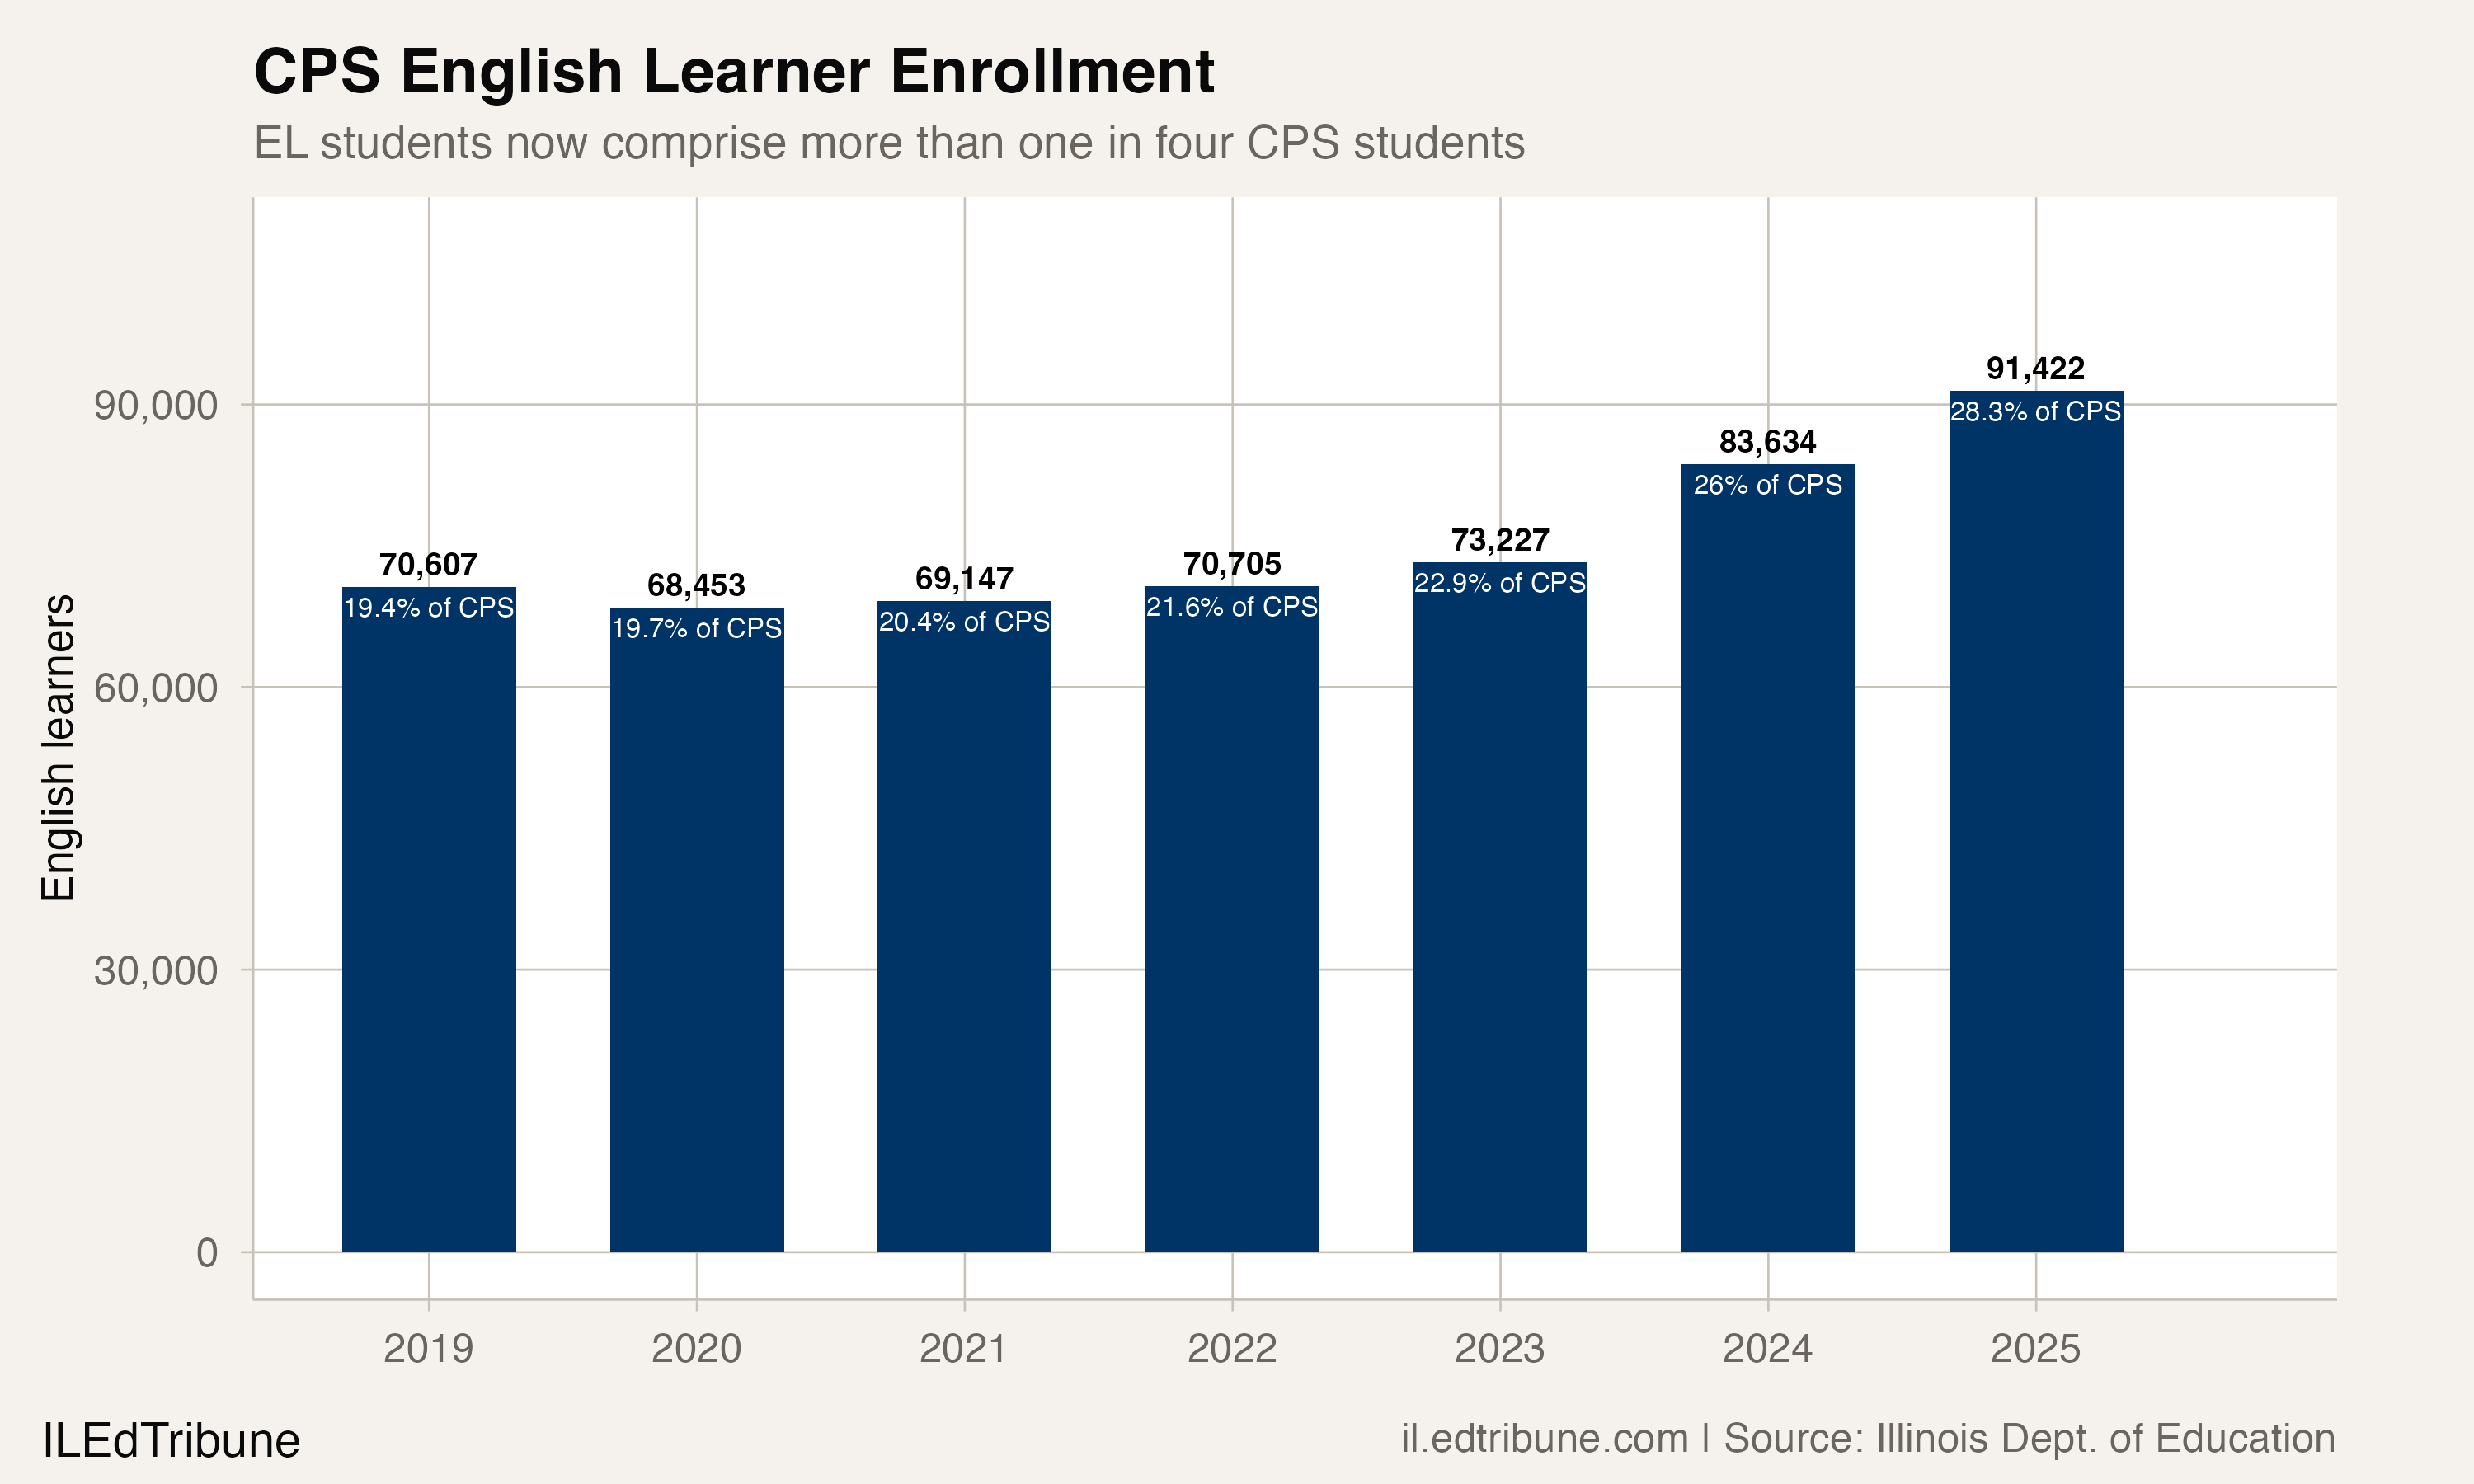
The math is straightforward: CPS gained 3,278 students overall between 2023 and 2025. In the same period, EL enrollment grew by 18,195. Without the EL surge, the district would still be shrinking.
New arrivals, old infrastructure
The most likely driver of CPS's EL enrollment surge is new migrant arrivals from Central and South American countries. Beginning in late 2022, buses carrying migrants from the southern border brought thousands of families to Chicago. CPS enrolled nearly 9,000 new migrant students in the 2023-24 school year alone. English learner enrollment, which overlaps heavily with but is not identical to the migrant population, grew in lockstep.
The distinction between new arrivals and expanded identification matters. Some portion of the EL increase could reflect improved screening of students who were already enrolled. CPS and the Illinois State Board of Education count migrant students differently: the district reported about 8,900 migrant students as of spring 2024, while ISBE's broader definition captured roughly 17,000. The true number depends on who counts and what they count.
The enrollment data cannot separate these two dynamics, but the scale of the increase, 18,195 EL students in two years, strongly suggests actual new arrivals rather than reclassification alone. A reclassification-driven shift of that magnitude would be historically unprecedented.
The bilingual staffing gap
New students need bilingual teachers. CPS does not have enough.
"They were dropped at our doorstep, and we're supposed to keep it moving, accept these children, educate them and keep it moving." — Dewanda Watt, first-grade teacher, Chalkbeat/Block Club Chicago, May 2024
A Chalkbeat investigation found that as of spring 2024, 72 CPS schools had open positions for staff certified to teach ESL or bilingual classes. More than 40% of those vacancies were in majority-Black, low-income South and West Side neighborhoods where migrant families were settling through state rental assistance programs but where schools had no history of bilingual programming.
The district has responded with money. Allocations for the Office of Multilingual and Multicultural Education rose from $54.5 million in 2023 to $77 million in the 2024-25 school year, and bilingual-certified staff grew from 415 to 541 positions. CPS reported roughly 2,000 more teachers with bilingual or ESL credentials compared to five years ago. Whether those teachers are in the right buildings is a separate question.
A different district underneath
The students arriving at CPS are not the same students who left.
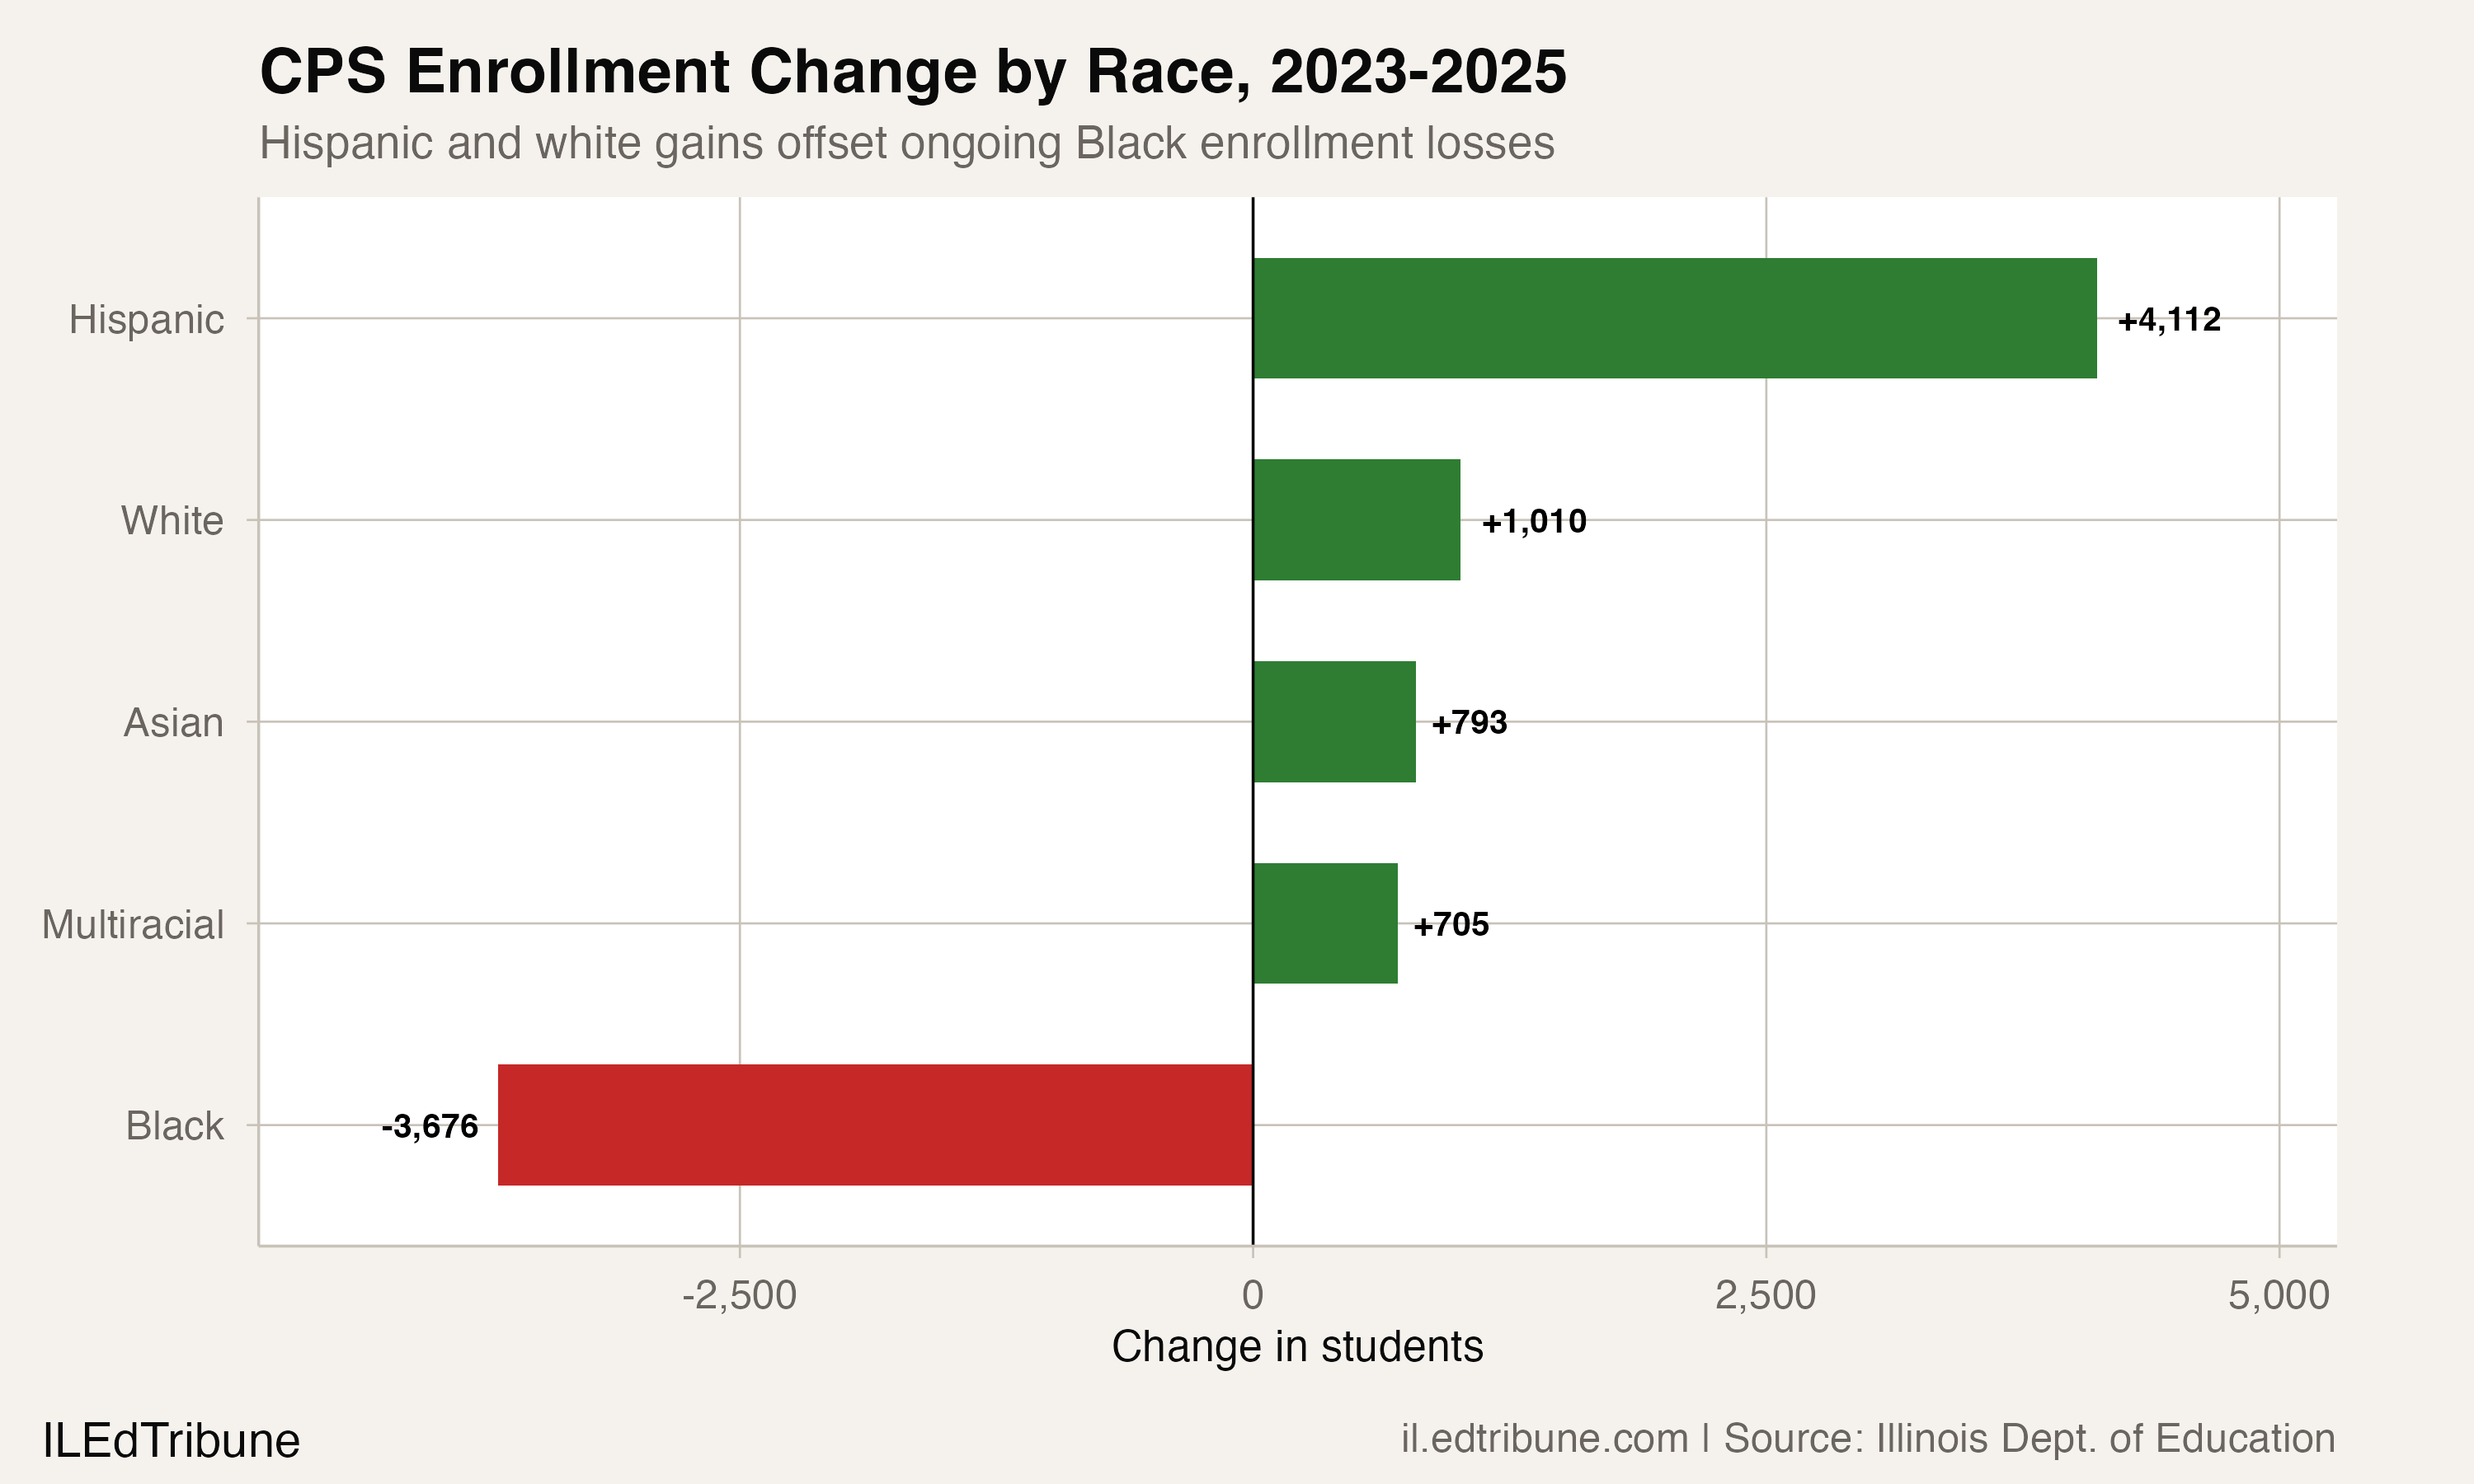
Between 2023 and 2025, Hispanic enrollment grew by 4,112 students (+2.8%), white enrollment grew by 1,010 (+2.8%), and Asian enrollment grew by 793 (+5.5%). Black enrollment fell by 3,676 (-3.2%), continuing a decline that has been continuous for at least a decade.
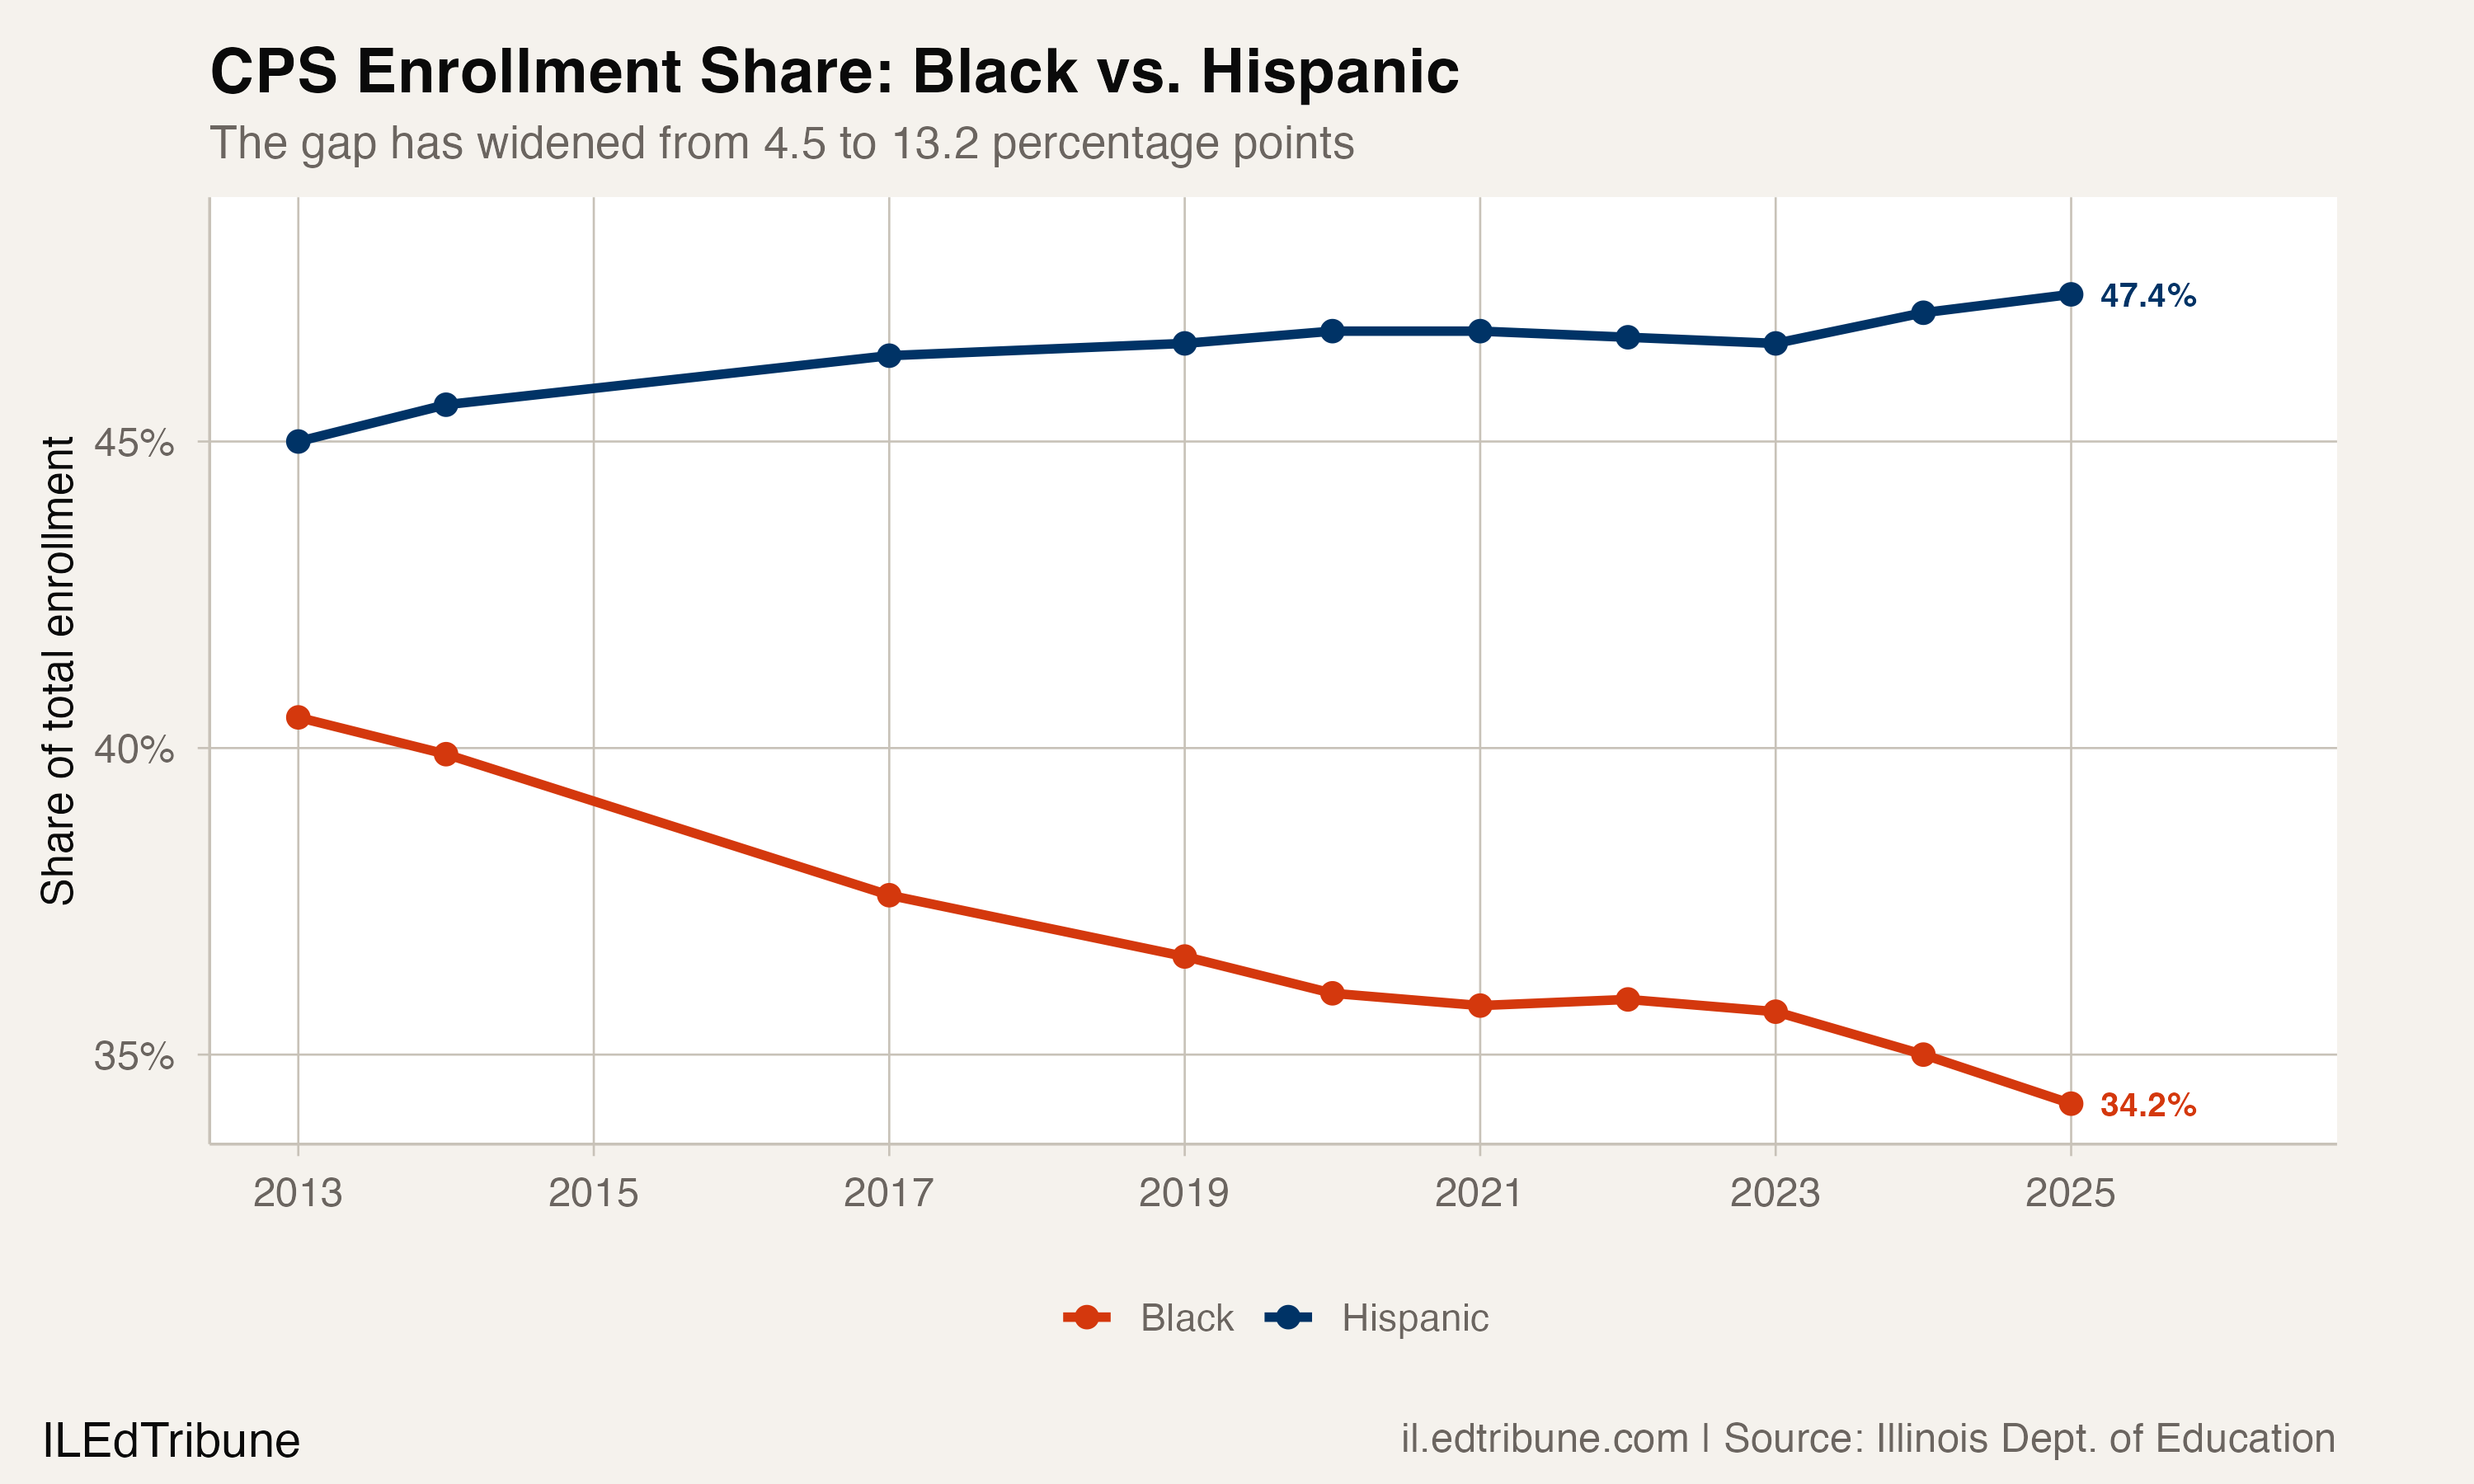
In 2013, Black students made up 40.5% of CPS enrollment and Hispanic students 45.0%, a 4.5-point gap. By 2025, Black enrollment has fallen to 34.2% while Hispanic enrollment has risen to 47.4%, widening the gap to 13.2 percentage points. Since 2019, CPS has lost 22,725 Black students (-17.1%) while Hispanic enrollment fell by 16,479 (-9.7%) over the same period before reversing in 2024.
The decline in Black student enrollment mirrors a broader population exodus. Chicago's Black population has fallen by more than 85,000 since 2010 according to census data, driven by housing costs, public housing demolitions, school closures, and economic disinvestment, according to researchers at UIC.
Separately, CPS students experiencing homelessness rose from 12,738 in 2019 to 17,445 in 2025, a 37.0% increase. Much of that growth aligns with the timeline of migrant arrivals, though the data does not distinguish between migrant and non-migrant students who are currently homeless.
35% of desks sit empty
The enrollment reversal has not solved CPS's capacity problem. According to an Illinois Policy Institute analysis of district data, the average space utilization rate across 474 CPS schools was 65% in 2024-25. That means the average school has 35% of its seats unfilled. Of those 474 buildings, 275 (58%) were classified as underutilized. CPS's own benchmarks call for 77% utilization at elementary schools and 80% at high schools.
Empty seats are not free. Every underutilized building still needs heat, maintenance, security, and a principal. The district's overall enrollment gain of 3,278 students, spread across 474 schools, averages fewer than seven additional students per building, nowhere close to changing the utilization picture.
The funding formula follows the students
Illinois's evidence-based funding formula calculates what each district needs for an adequate education based on student population and characteristics. CPS's growing EL population has made the formula's math more expensive. State calculations released in August 2024 showed CPS needed $1.2 billion more to reach full adequacy, a $93 million increase from the prior year's projection. The district sat at 79% of its adequacy target.
By 2025, that gap had grown to $1.6 billion, with CPS falling to 73% adequacy, an eight-point drop in two years. Two-thirds of the $600 million increase in the statewide adequacy gap was attributable to CPS alone, driven largely by the cost of bilingual and newcomer programming that EL students are entitled to receive.
CPS's new hybrid elected-appointed school board, which began its first term in January 2025 with 10 elected members, 10 mayoral appointees, and an appointed president, inherits a district that is simultaneously growing and underfunded. The enrollment rebound makes CPS look healthier on paper. The composition of that enrollment, heavily weighted toward students whose instructional programs carry higher per-pupil costs, means the rebound makes the budget harder, not easier.
Trend or blip
The question is whether CPS's enrollment reversal is a trend or a one-time demographic event. If migrant arrivals stabilize or slow, the district's EL growth rate will too, and the underlying pattern of Black enrollment decline will reassert itself. CPS still lost 3,676 Black students in two years while gaining overall. If those departures continue and migrant inflows plateau, the gains evaporate.
The harder question is operational. CPS has 87,827 fewer students than it did in 2005 but is adding students who need bilingual instruction in buildings that were never staffed for it, in neighborhoods where the schools have the most empty seats. Whether the district can match resources to this new reality, building by building, will determine whether the enrollment reversal translates into something students actually experience as improvement.
Detailed code that reproduces the analysis and figures in this article is available exclusively to EdTribune subscribers.
Discussion
Sign in to join the discussion.
Loading comments...