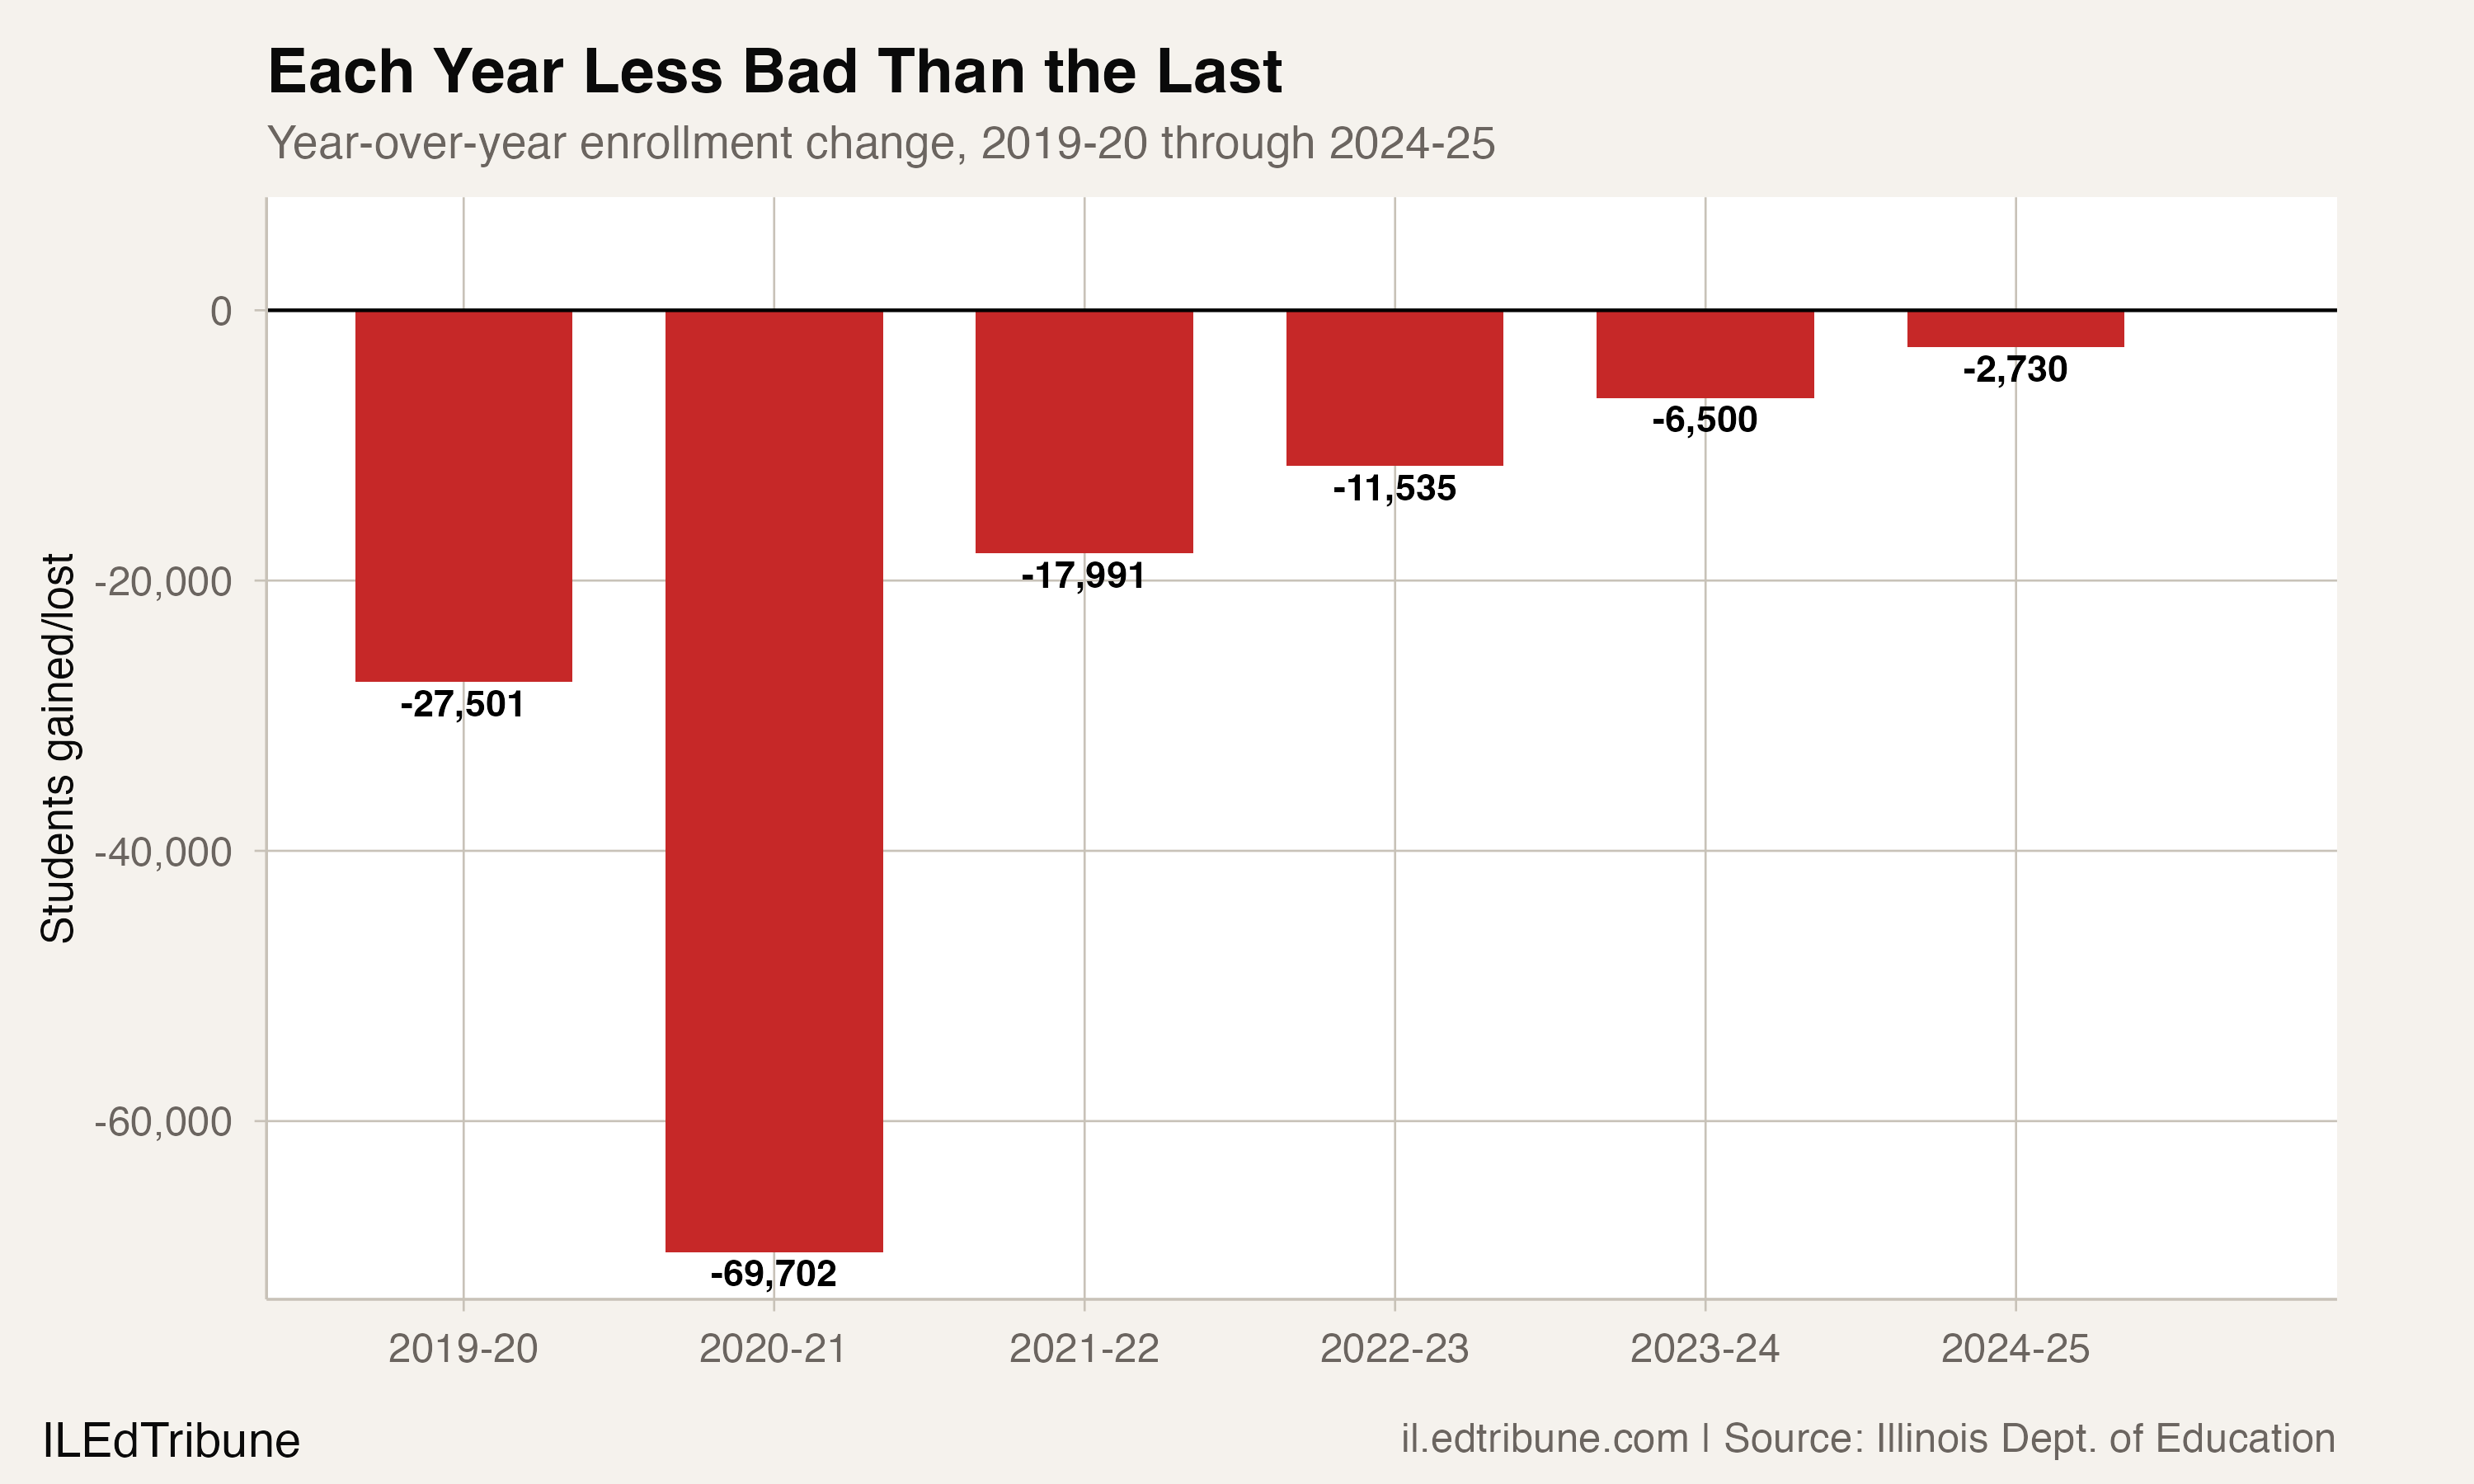
Illinois lost just 2,730 students in 2024-25, a 0.15% decline. That is the smallest annual loss since 2008, when the state's enrollment was still near its peak. Four years after the pandemic erased nearly 70,000 students in a single year, the topline number looks like a system approaching equilibrium.
It is not. Strip out the growth in English learner enrollment and the picture changes: non-EL students fell by 22,616 in 2024-25, roughly in line with the 30,000-per-year average that has held since 2019-20. The deceleration is real at the headline level. Underneath it, the state is running two enrollment stories simultaneously, and they are moving in opposite directions.
Halving the losses, year after year
The post-COVID deceleration has been unusually consistent. Each year's loss has been roughly half the prior year's:
| Year | Enrollment | Change | Pct Change |
|---|---|---|---|
| 2020-21 | 1,887,316 | -69,702 | -3.6% |
| 2021-22 | 1,869,325 | -17,991 | -0.95% |
| 2022-23 | 1,857,790 | -11,535 | -0.62% |
| 2023-24 | 1,851,290 | -6,500 | -0.35% |
| 2024-25 | 1,848,560 | -2,730 | -0.15% |
The ratio of each year's loss to the prior year's has tightened from 0.64 in 2022-23 to 0.42 in 2024-25. At the district level, 351 of 863 matched districts grew in 2024-25, with 500 declining and 12 flat. The state is not uniformly shrinking anymore. Chicago Public Schools gained 1,379 students, Rockford added 894, and a cluster of suburban districts posted triple-digit gains.
The EL counterweight
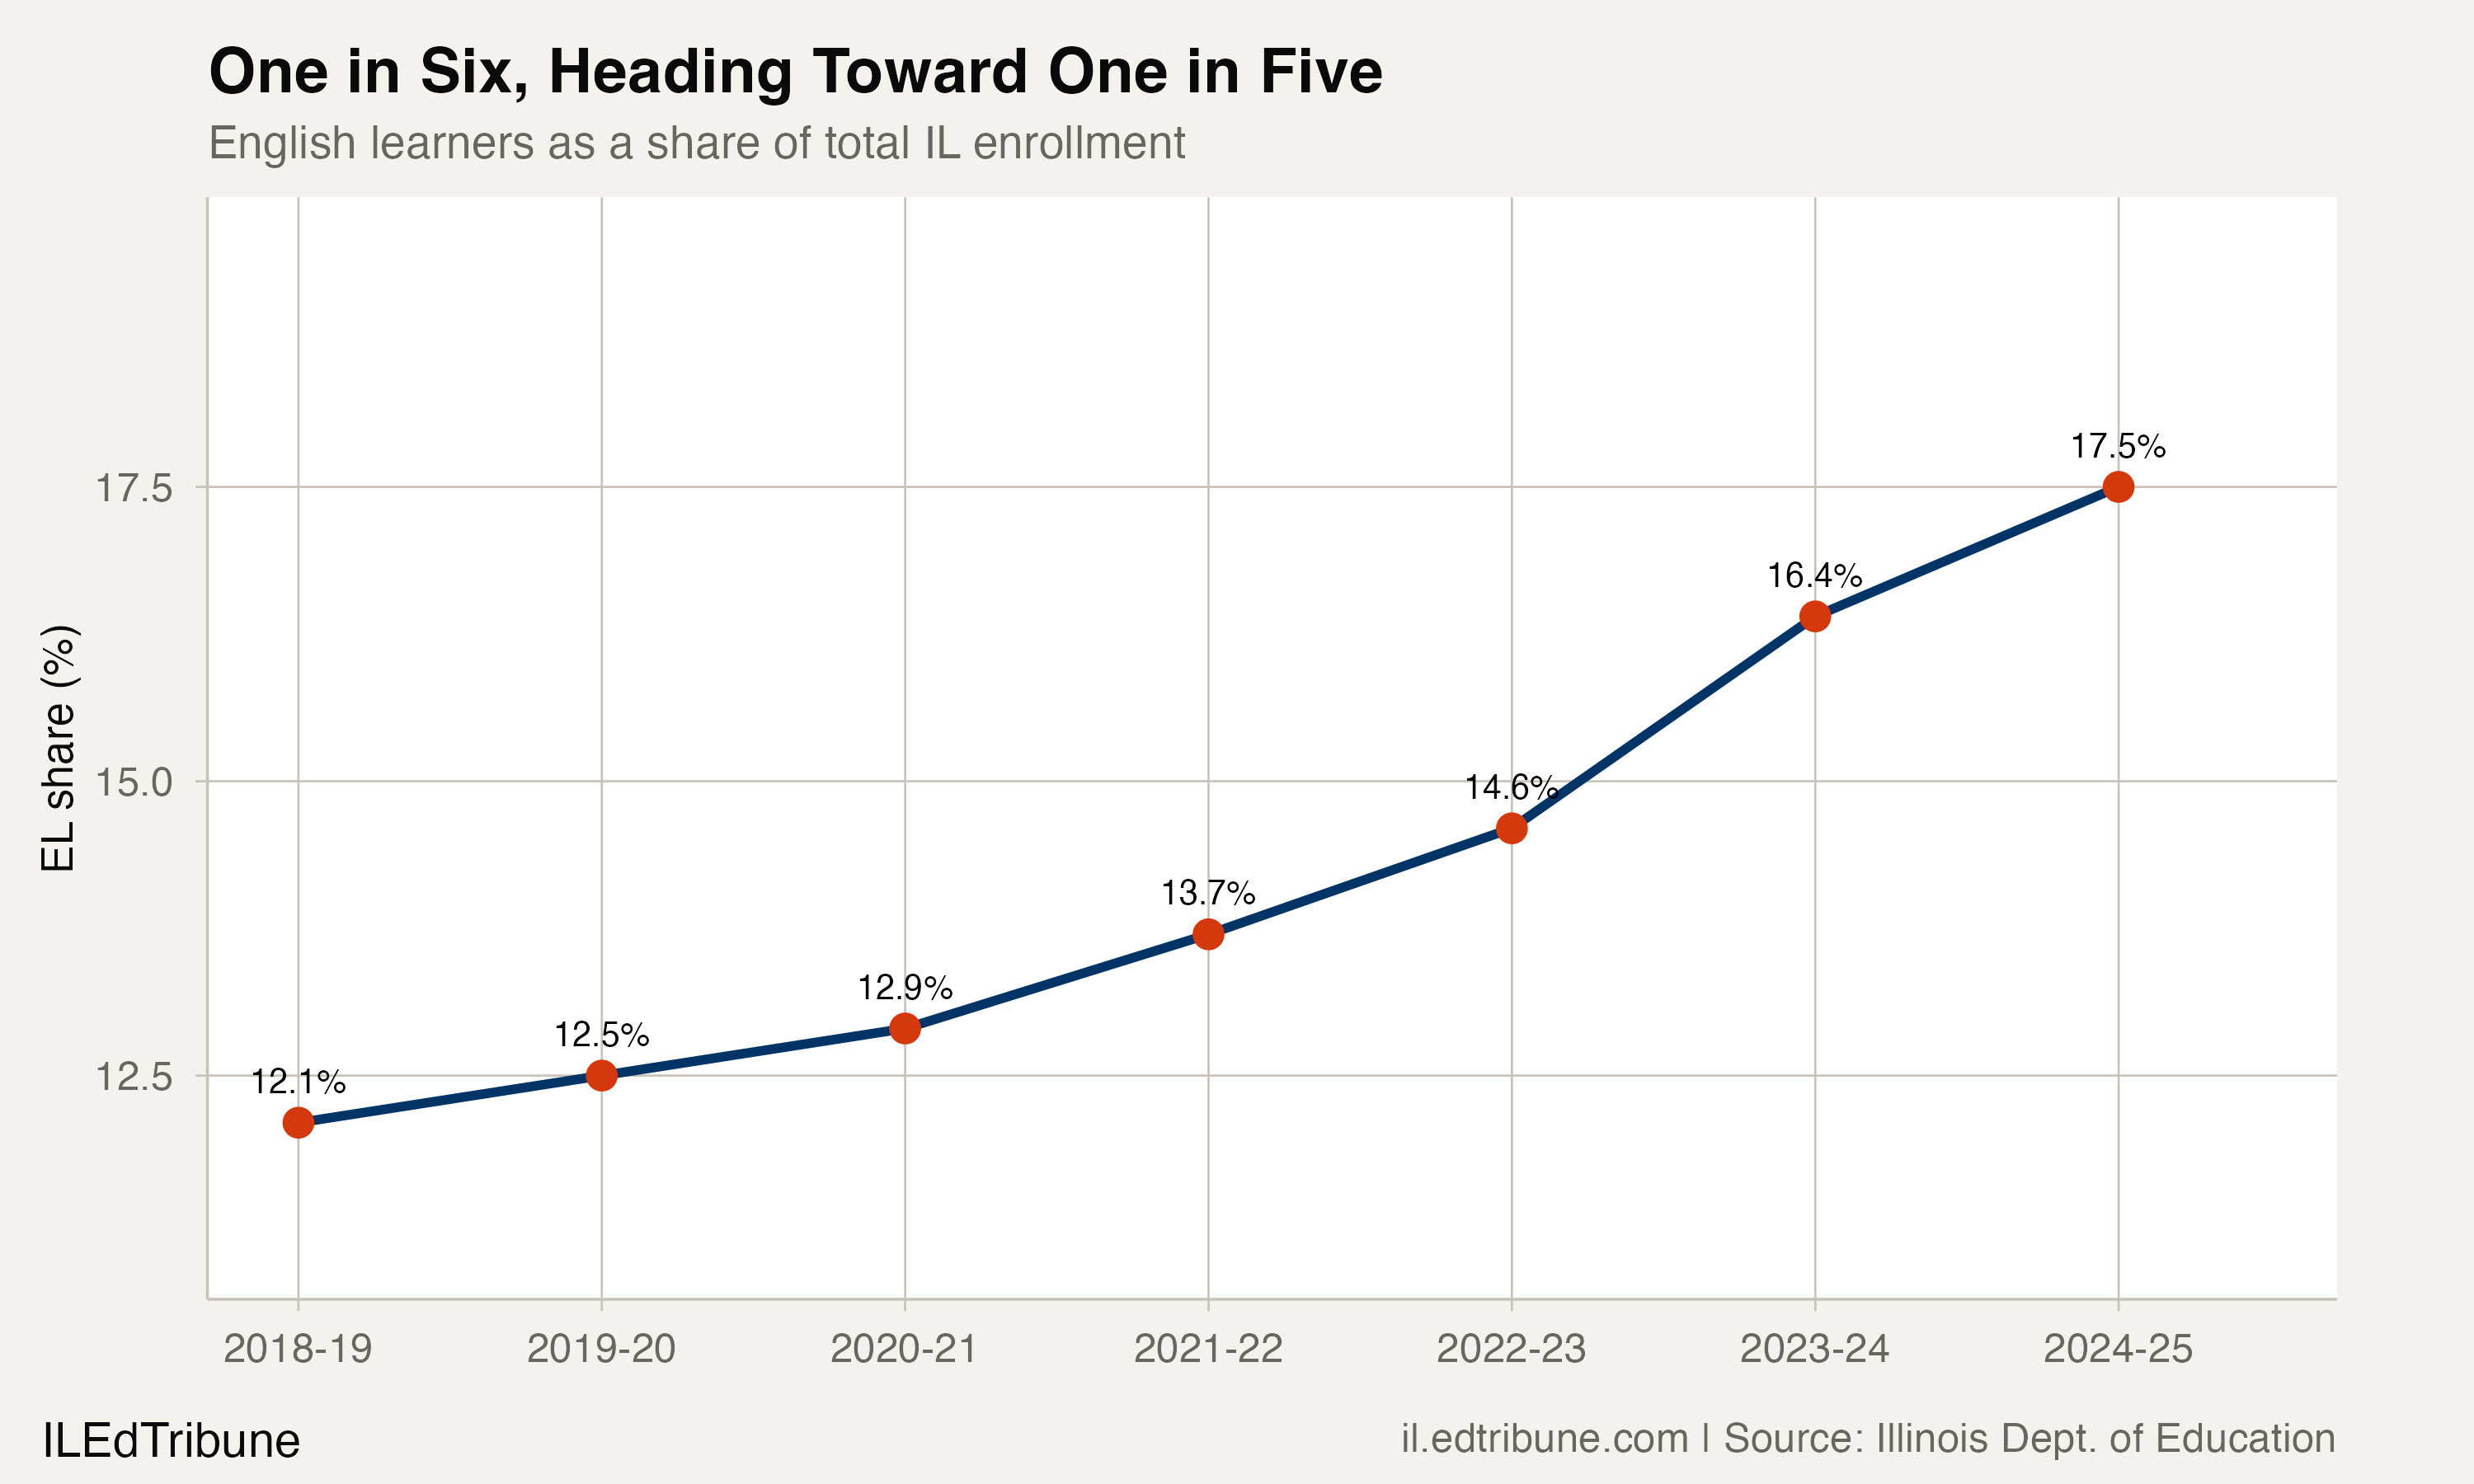
The deceleration is almost entirely a product of English learner enrollment running against the broader current. Since 2018-19, the state added 83,371 English learners, from 240,127 to 323,498, a 34.7% increase. Over the same span, total enrollment fell by 135,959.
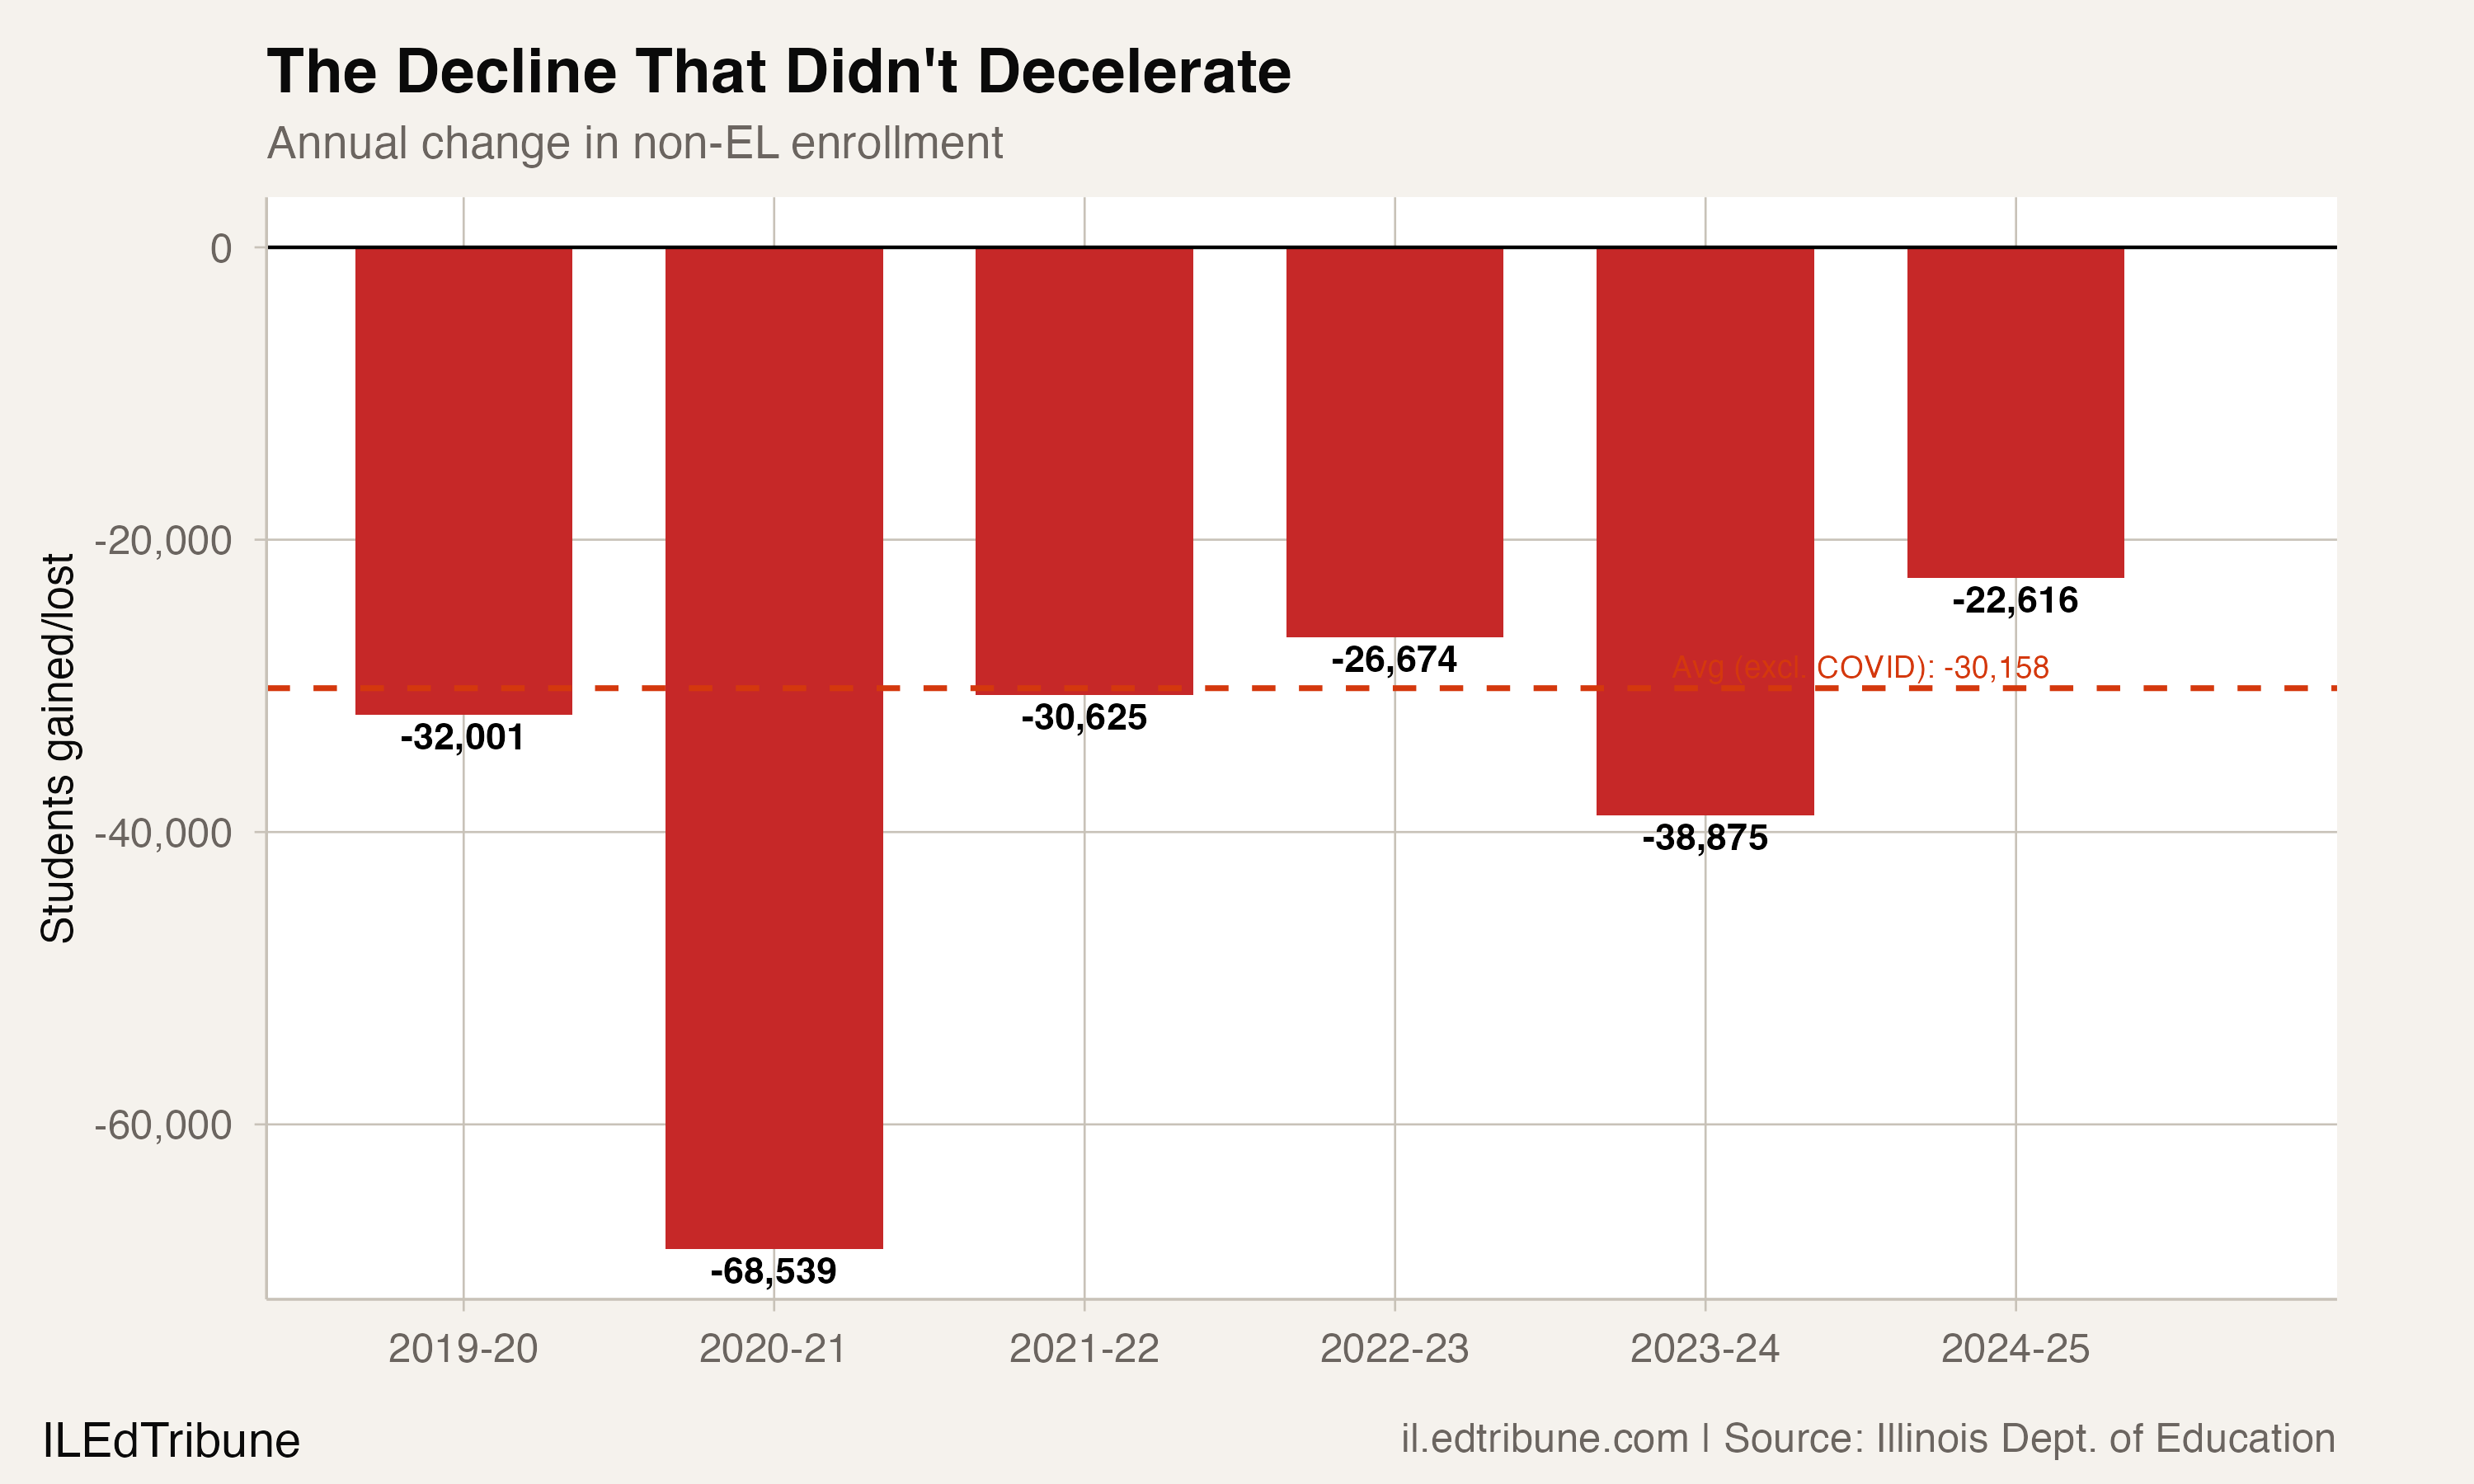
The decomposition tells the story more precisely. In every year since 2019-20, non-EL enrollment has declined by between 22,000 and 39,000 students, excluding the pandemic outlier of 68,539 in 2020-21. The non-COVID average is roughly 30,000 per year. That rate has not decelerated.
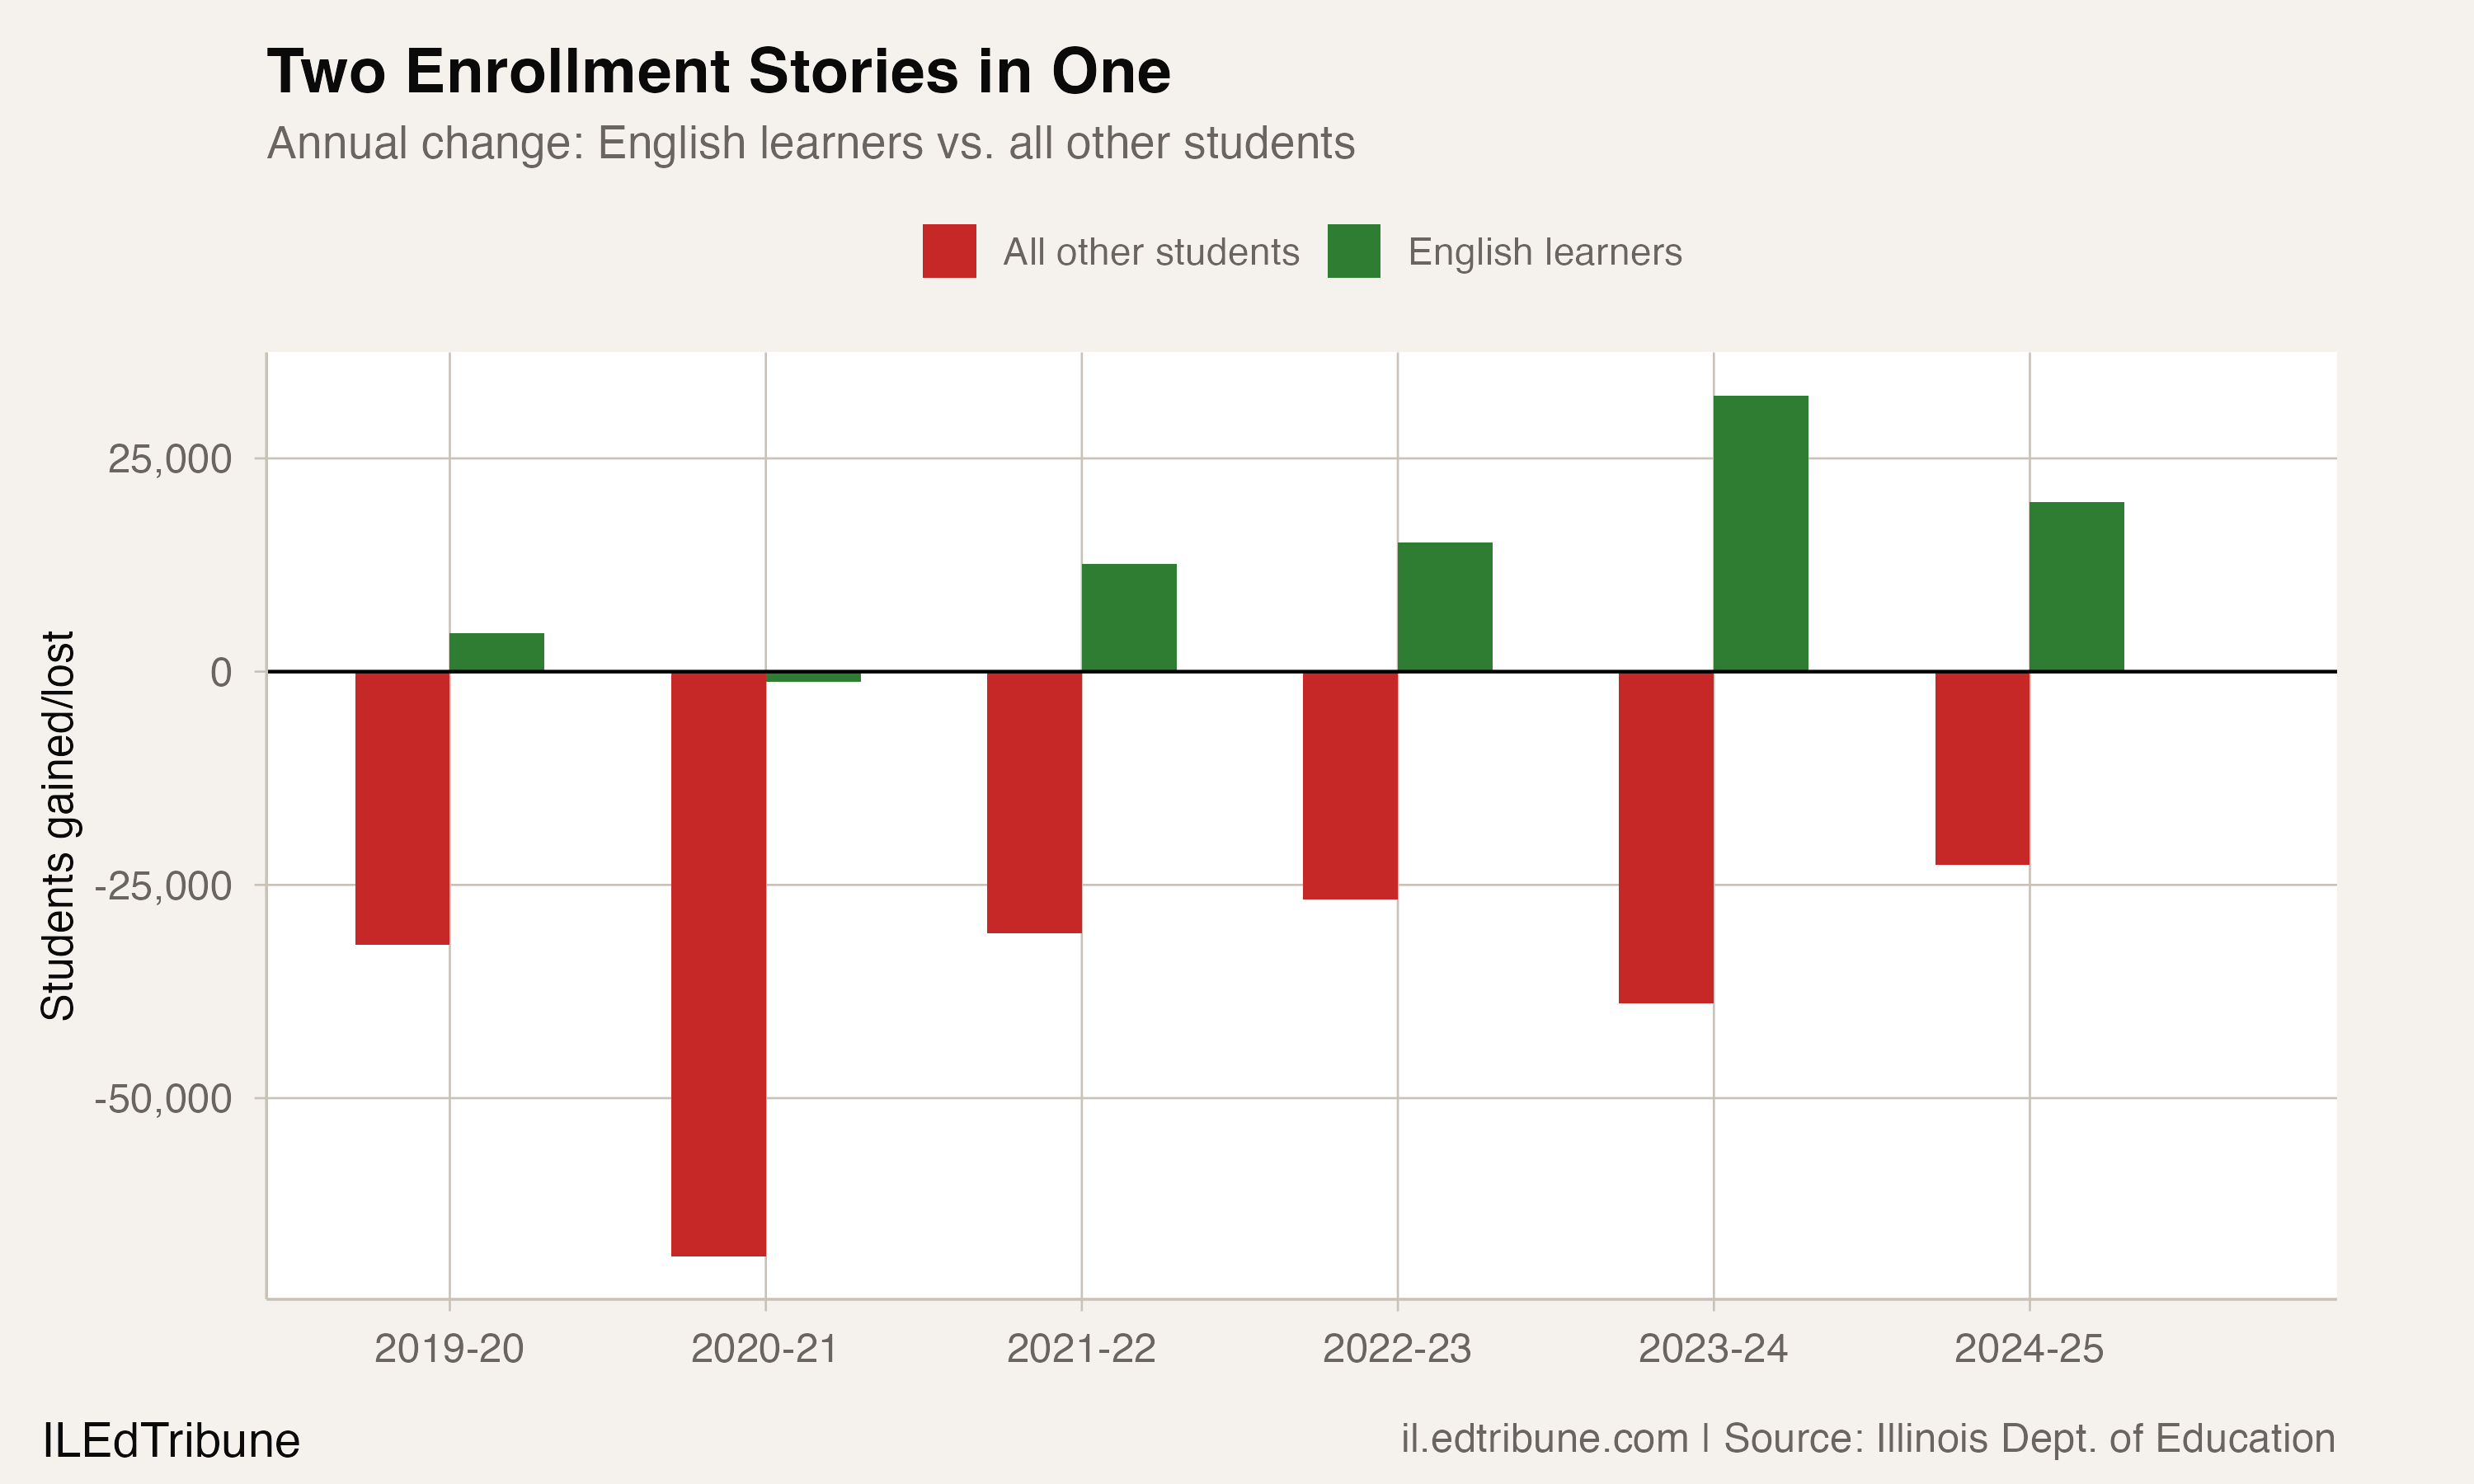
What changed is the counterweight. EL enrollment grew by 4,500 in 2019-20, dipped during COVID, then accelerated: 12,634 in 2021-22, 15,139 in 2022-23, 32,375 in 2023-24, and 19,886 in 2024-25. In 2023-24, when the state lost only 6,500 students total, EL growth of 32,375 was absorbing a non-EL decline of 38,875.
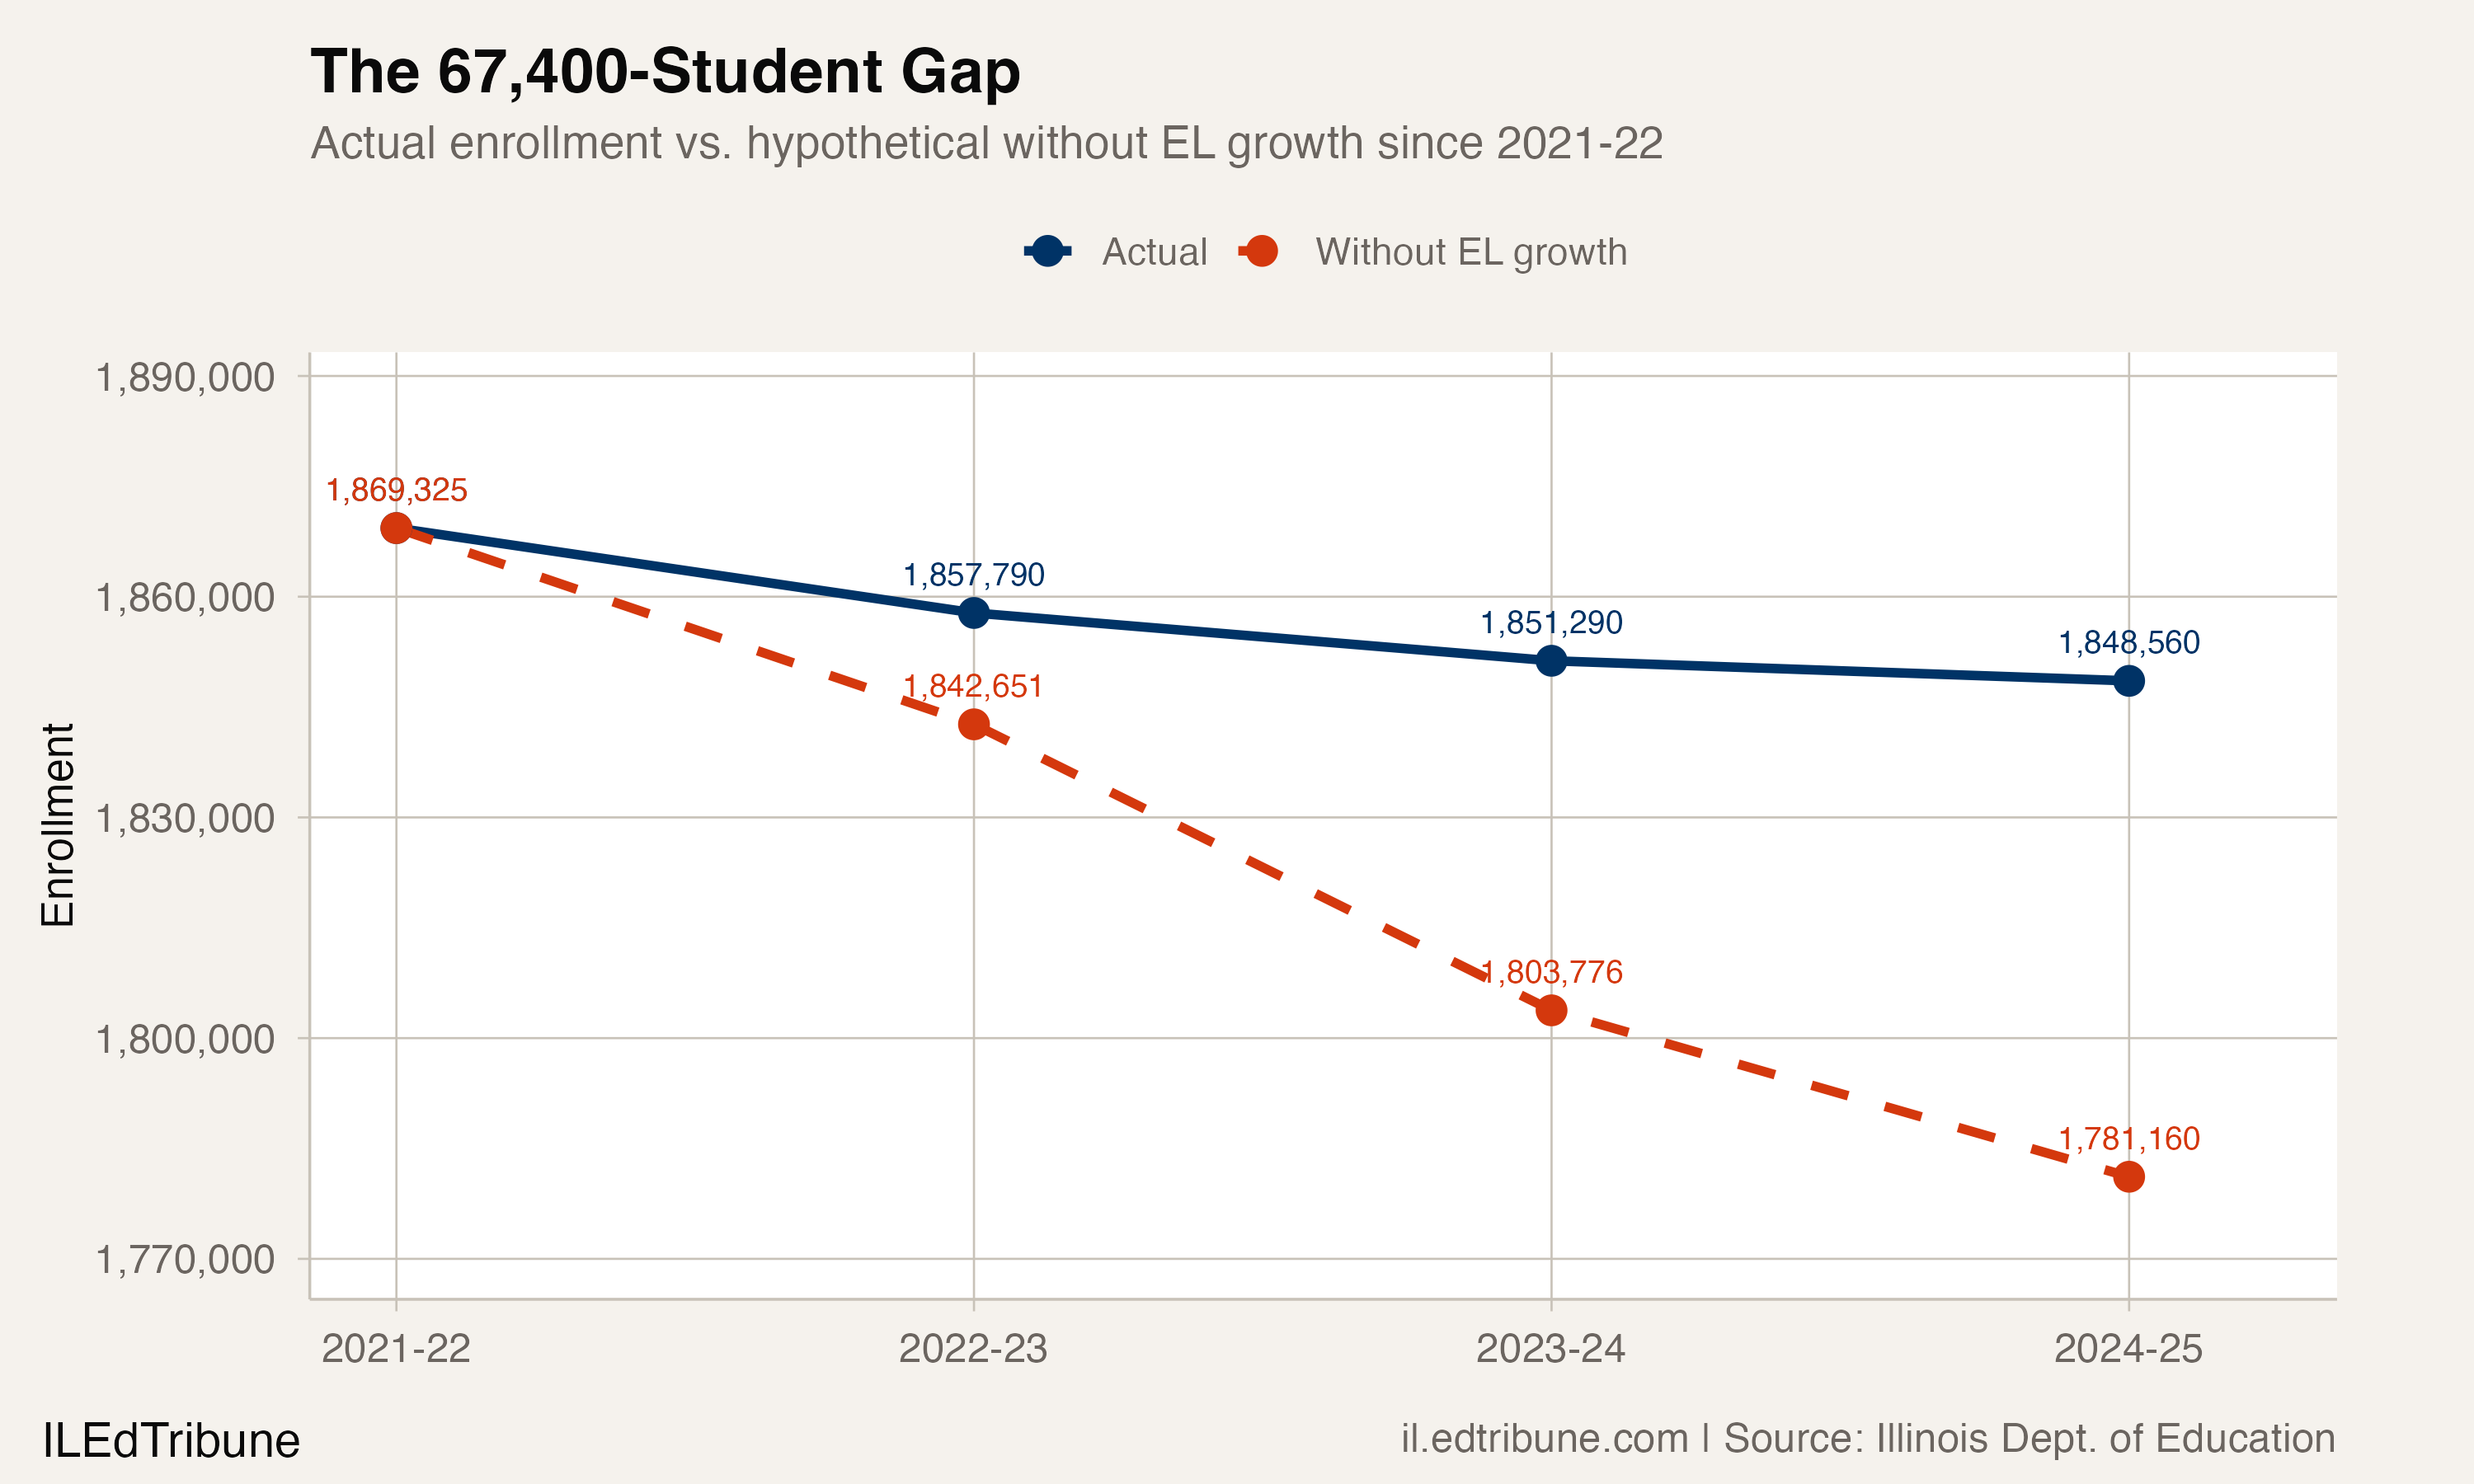
Without the EL growth that occurred after 2021-22, Illinois enrollment in 2024-25 would stand at approximately 1,781,160, not 1,848,560. The gap between actual enrollment and the no-EL-growth counterfactual is 67,400 students.
Where the EL growth is concentrated
Chicago Public Schools accounts for a disproportionate share. CPS English learner enrollment grew from 73,227 in 2022-23 to 91,422 in 2024-25, a gain of 18,195 students. That is 34.8% of the statewide EL growth over the same period, from a district that enrolls about 17% of Illinois students.
The growth extends beyond Chicago. Between 2018-19 and 2024-25, SD U-46 (Elgin) added 2,526 English learners, Waukegan added 1,972, Rockford added 1,966, and Township HSD 214 (Arlington Heights) added 1,584. Suburban Cook County and the collar counties saw EL growth rates exceeding 40% in several districts.
The most likely driver is the arrival of immigrant and asylum-seeking families. Chicago has received over 37,000 asylum seekers since 2022, many from Venezuela and Central American countries. Separately, Illinois's evidence-based funding model has expanded bilingual program infrastructure: the state reported 637 school districts operating Transitional Bilingual Education programs as of 2021-22, up from prior years. Expanded identification of existing students who qualify for EL services is a competing explanation. The data cannot distinguish newly arrived students from students who were already enrolled but are newly classified as English learners.
The non-EL decline: steady, structural, statewide
The other half of the story has no silver lining. Non-EL enrollment has fallen by roughly 30,000 students per year since 2019-20 (excluding the COVID year), a rate that has remained stubbornly flat even as the headline number improved.
The demographic arithmetic is straightforward. White enrollment fell by 125,719 from 2018-19 to 2024-25, a 13.3% decline. Black enrollment fell by 30,100, or 9.1%. Together, those two groups account for 155,819 lost students. Hispanic enrollment grew by a modest 4,775 over the same span, Asian enrollment by 4,158, and multiracial enrollment by 7,773.
Illinois's under-18 population has shrunk by more than 172,000 since 2020, a 6% decline that ranks among the steepest in the country. The state continues to lose residents to domestic outmigration. International immigration has partially offset the departures at the population level, but the school-age cohort entering kindergarten each year is smaller than the cohort graduating out.
The fragility question
"When families are afraid to be seen, or when they cannot afford to remain in their communities, they are less likely to enroll, reenroll, or stay in public schools." -- LAUSD Superintendent Alberto M. Carvalho, ABC News, Dec. 2025
Carvalho was describing Los Angeles, but the dynamic applies wherever EL enrollment growth depends on continued immigration. In Chicago, early indicators from fall 2025-26 suggest the counterweight may already be weakening. CPS enrollment dropped to roughly 313,000, a decrease of about 12,000 students from the prior year, erasing two years of gains.
Federal immigration enforcement has intensified in Chicago specifically. After the Trump administration launched Operation Midway Blitz in fall 2025, attendance dropped in 38 of Chicago's 77 community areas, with roughly 40% of the affected neighborhoods home to large immigrant or Latino populations. English learner attendance fell 1.3 percentage points compared to the prior year. Schools in Belmont Cragin, Albany Park, Pilsen, Little Village, and Back of the Yards were hit hardest.
The mechanism is not complicated: families who fear deportation keep children home or leave the district entirely. The enrollment data from 2024-25 predates the enforcement escalation. Whatever the 2025-26 ISBE data eventually shows, the conditions that produced Illinois's deceleration have changed.
The counterweight's shelf life
The deceleration hinges primarily on one variable: whether EL enrollment continues to grow fast enough to offset the structural decline in the rest of the student body. In 2023-24, the EL counterweight absorbed all but 6,500 of a 38,875-student non-EL loss. In 2024-25, it absorbed all but 2,730 of a 22,616-student loss.
If EL growth stalls or reverses, Illinois returns to visible annual losses of 20,000 to 30,000 students, a pace that would push enrollment below 1.8 million by the early 2030s. Chalkbeat's reporting from fall 2025, showing a 12,000-student drop in CPS alone, suggests that scenario is not hypothetical. The deceleration was real. Whether it continues is no longer a question the enrollment data can answer on its own.
Detailed code that reproduces the analysis and figures in this article is available exclusively to EdTribune subscribers.
Discussion
Sign in to join the discussion.
Loading comments...