Correction: This prepublication draft now aligns five-year rates to the prior year's four-year cohort and removes unsupported program and causal claims.
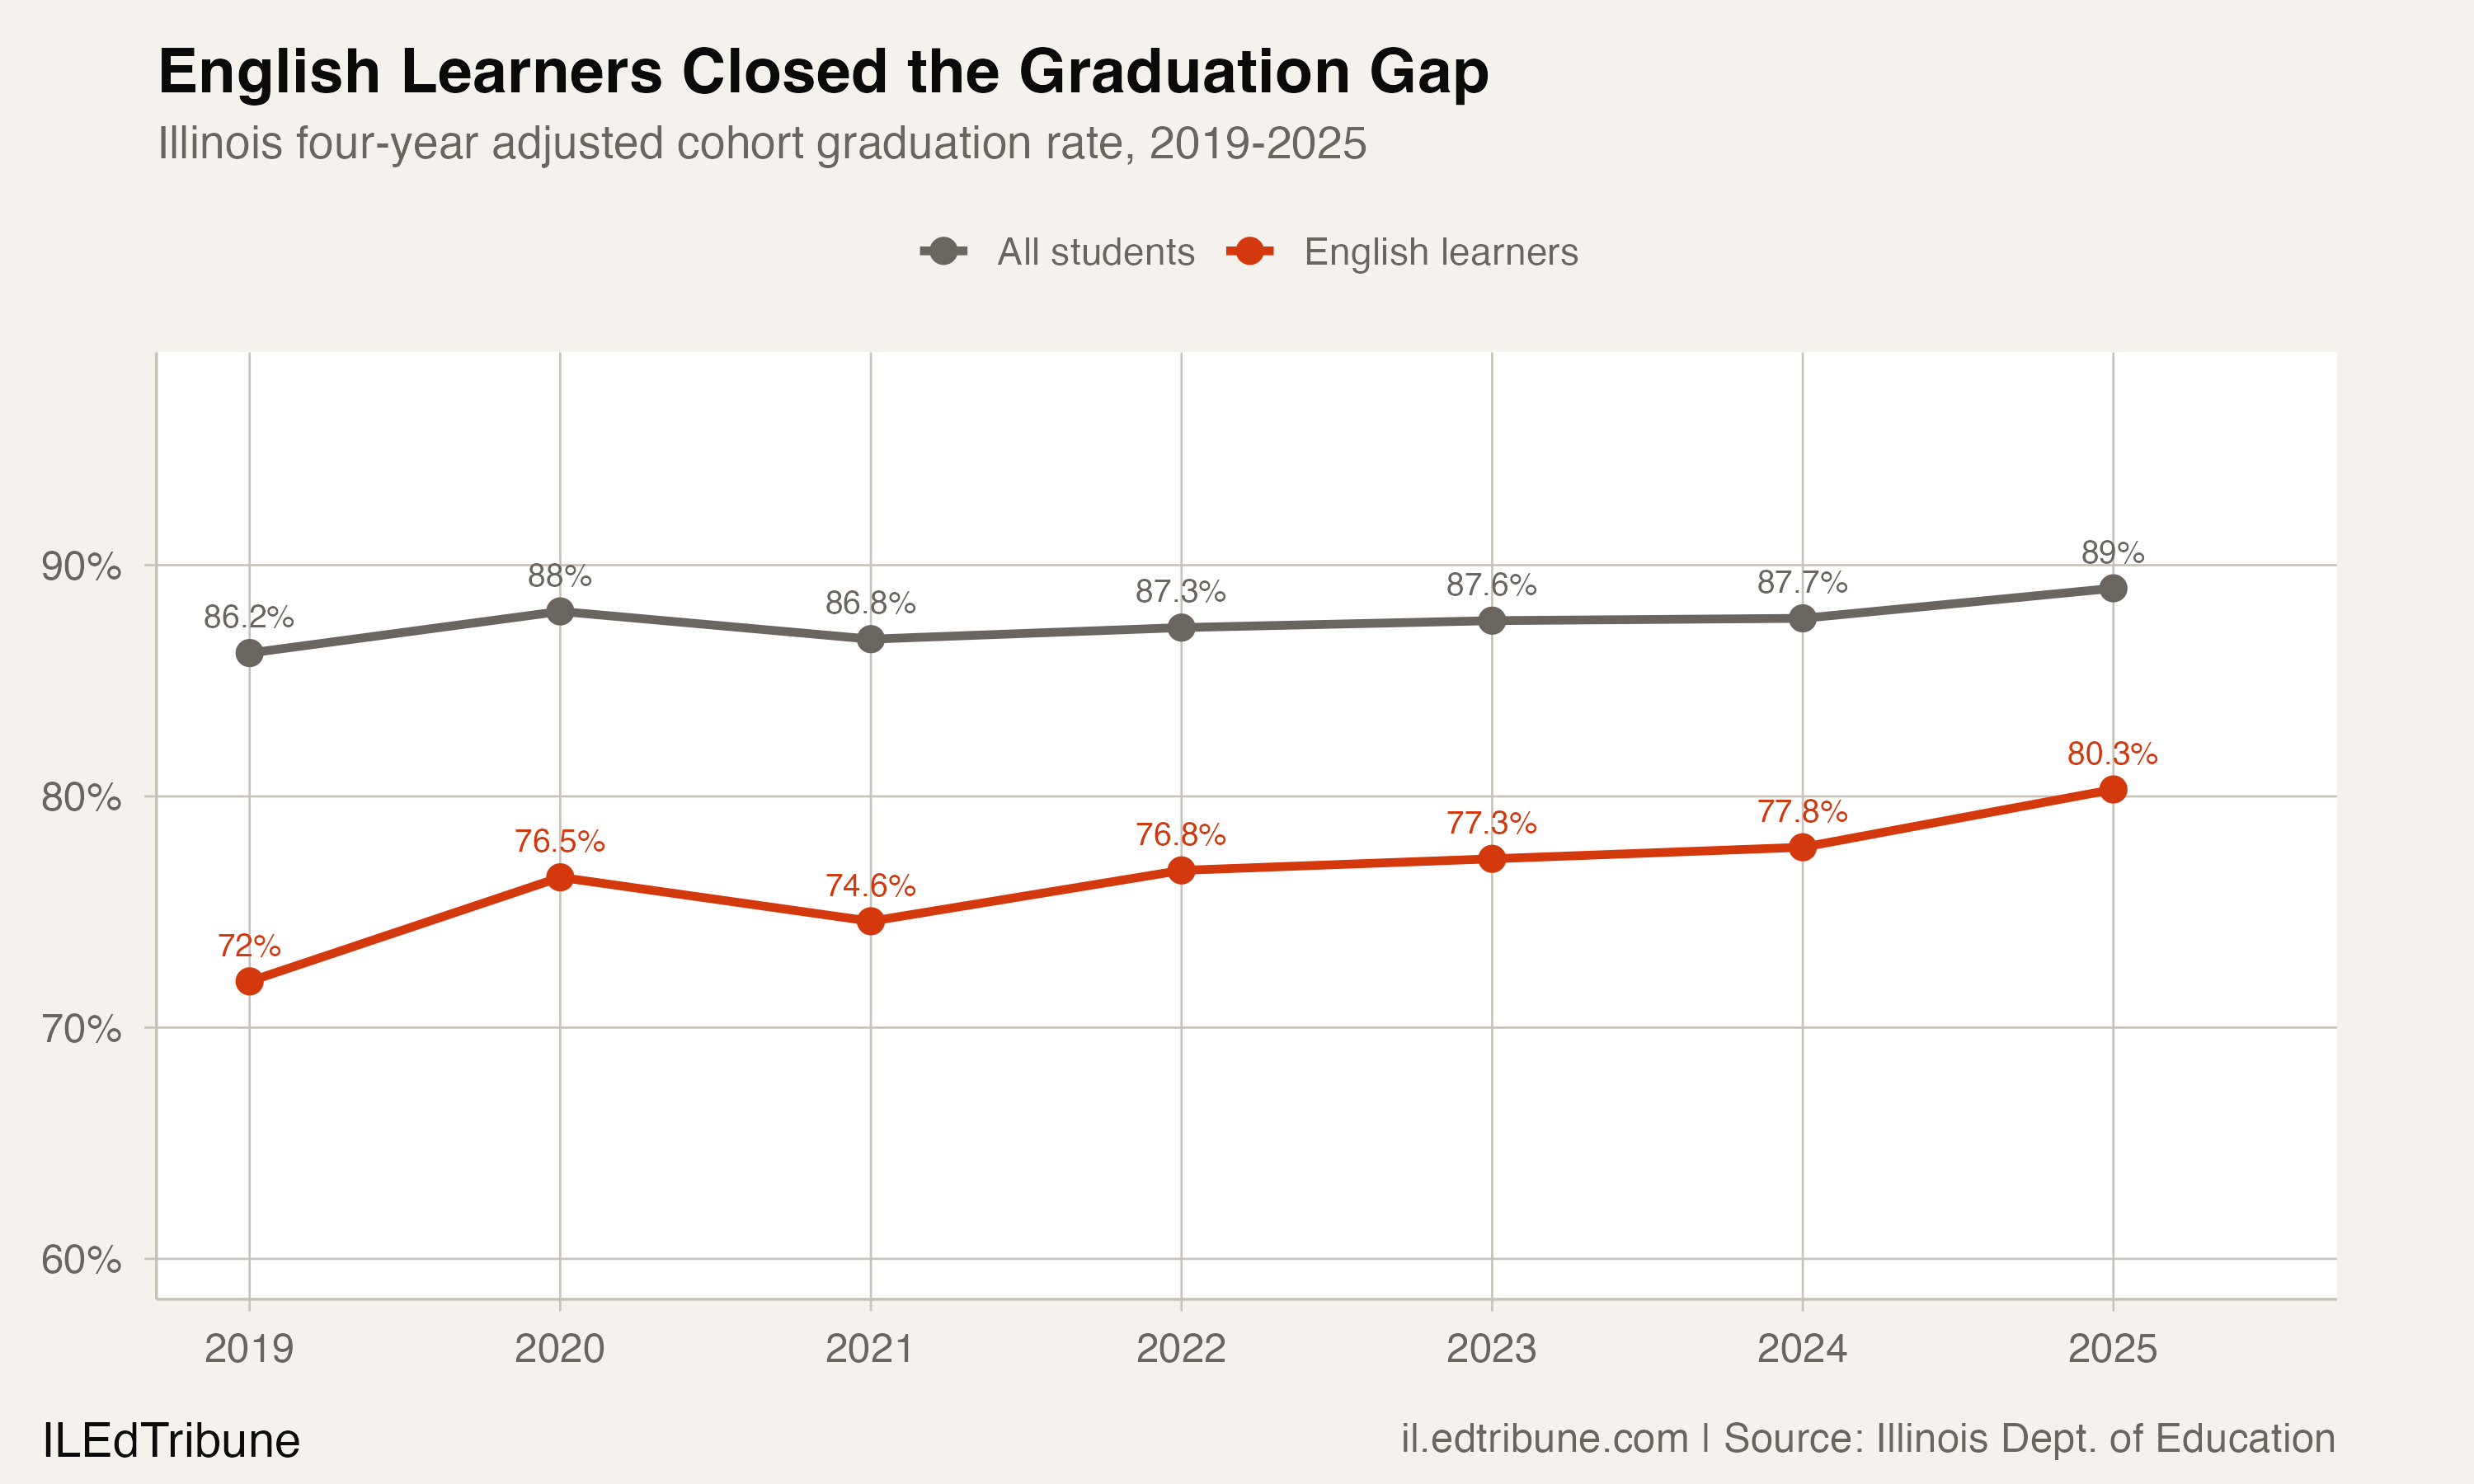
English learners in Illinois gained more ground on graduation rates than any other reported statewide subgroup with both endpoints across seven reporting years. Their four-year rate climbed 8.3 percentage points, from 72.0% in 2019 to 80.3% in the most recently published 2025 data.
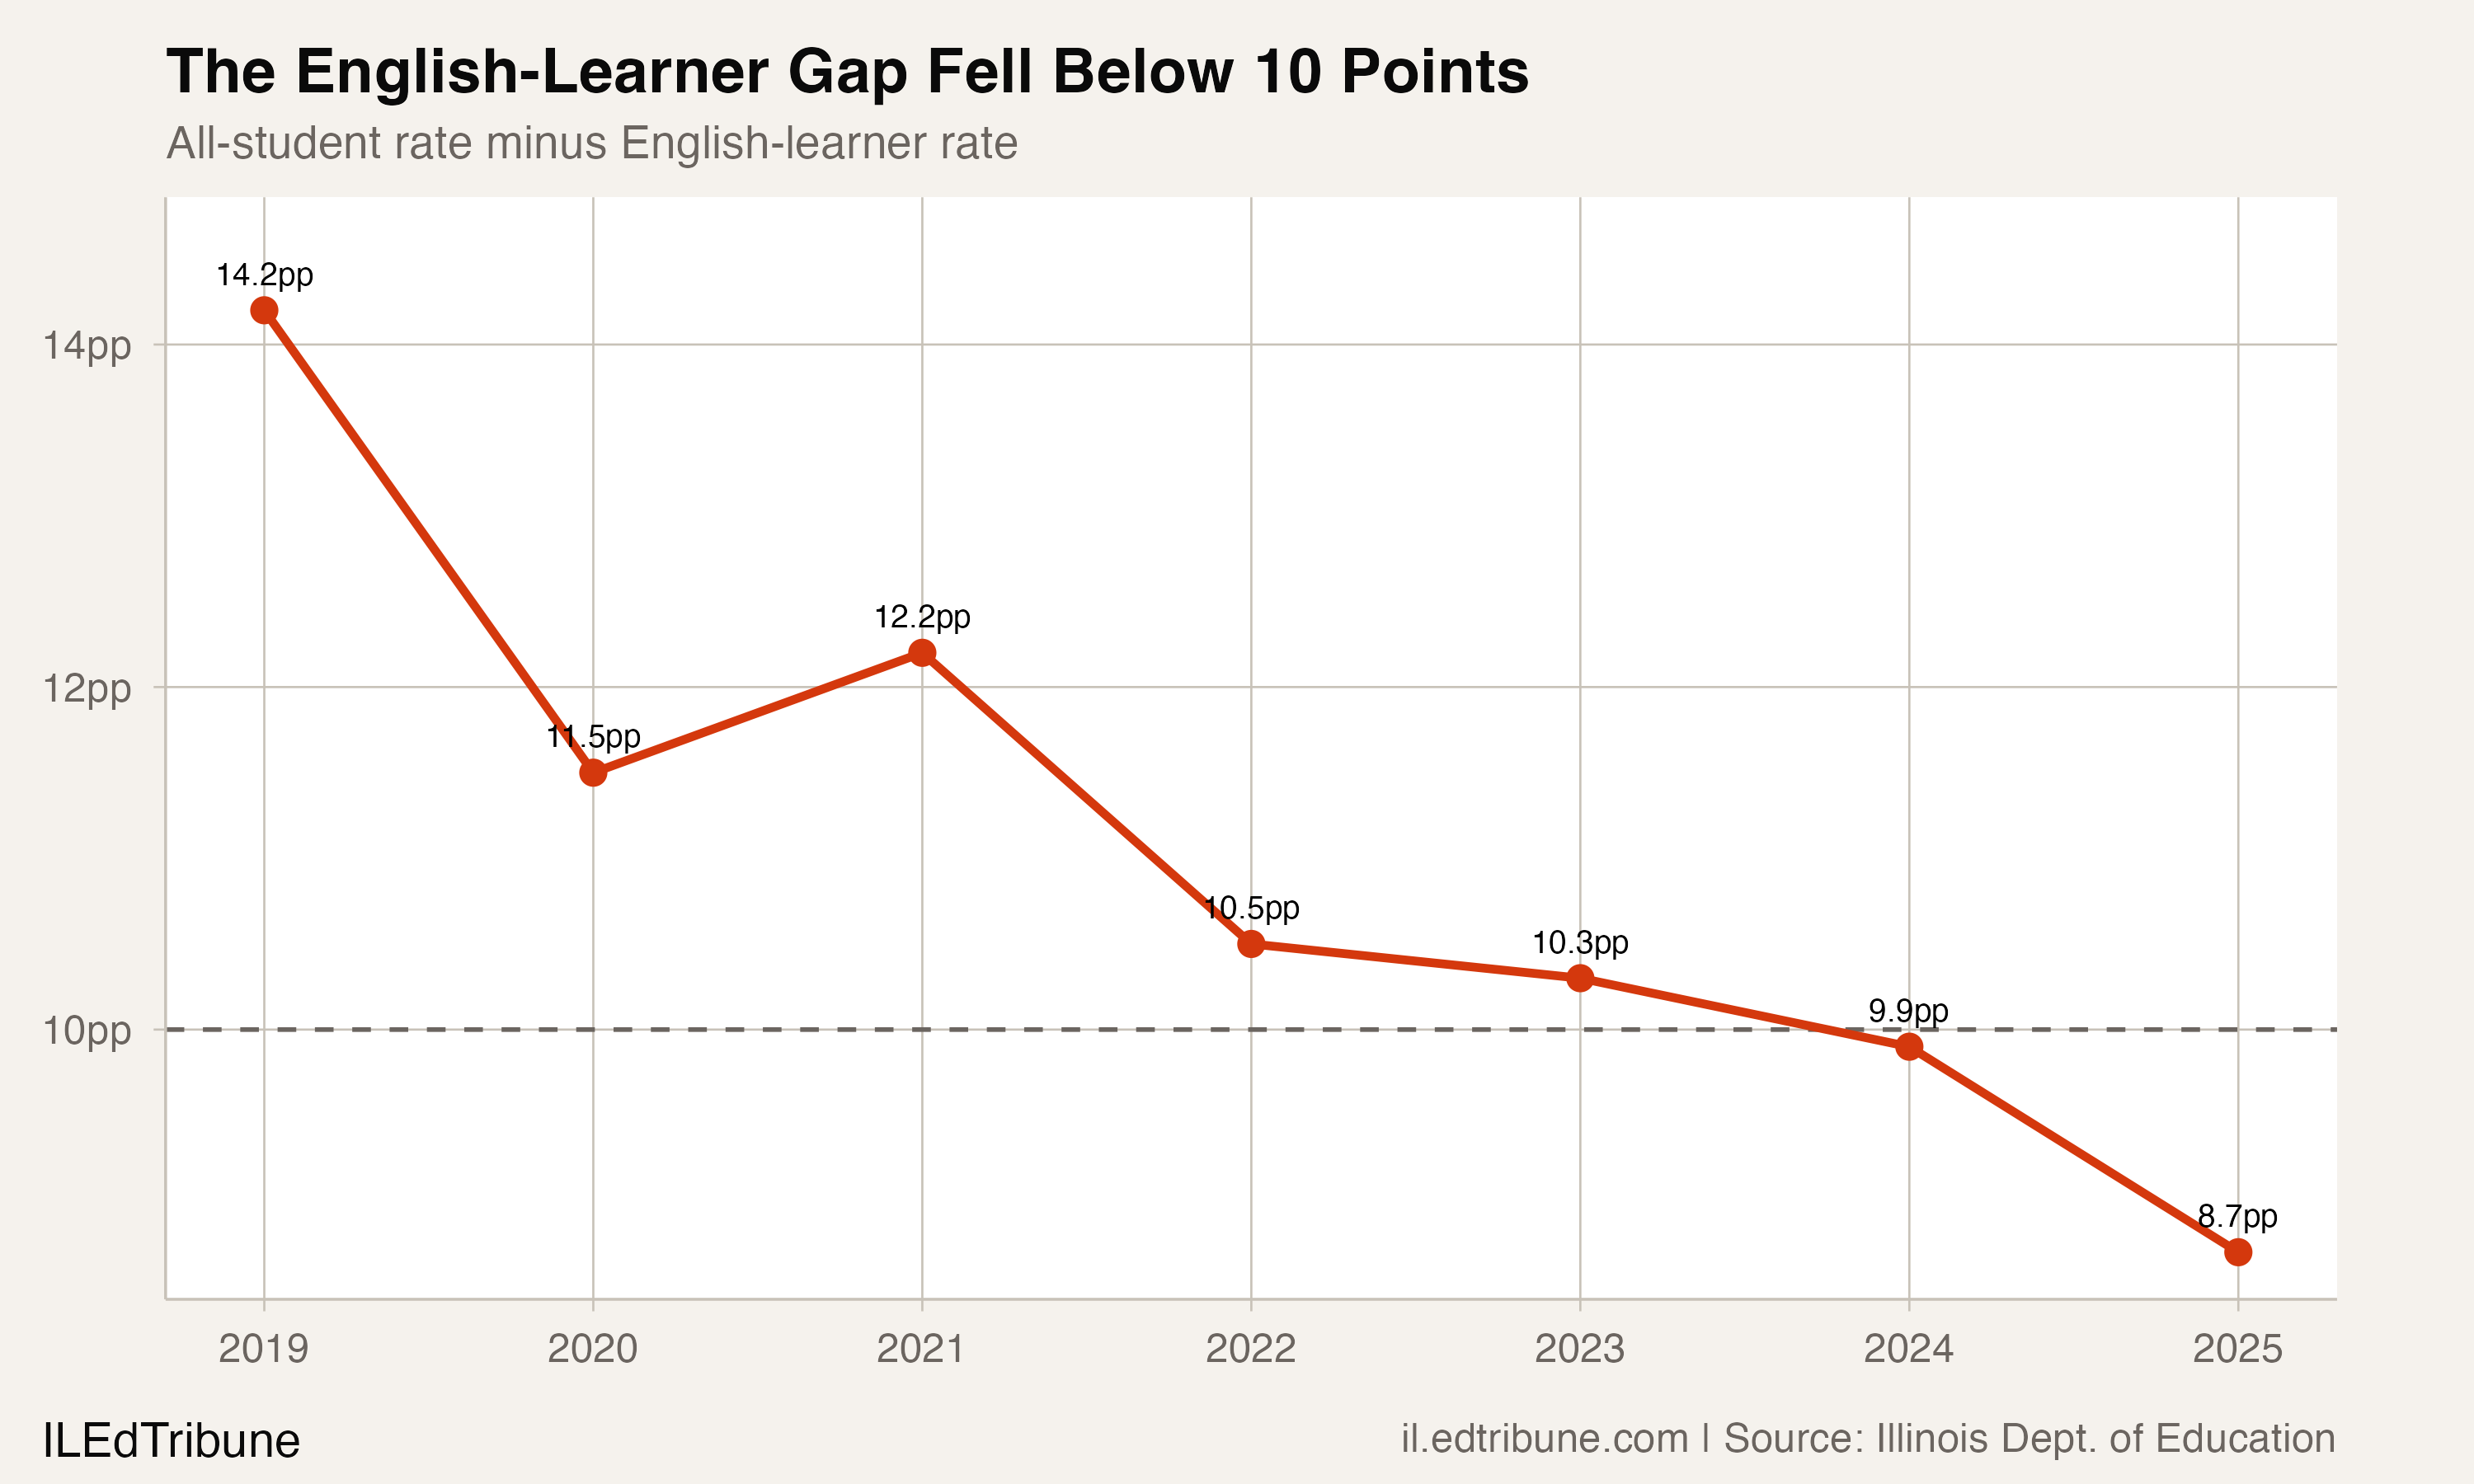
The improvement nearly tripled the statewide gain of 2.8 points over the same period, and it narrowed the gap between English learners and all students from 14.2 percentage points to 8.7.
A brief dip, then four annual gains
The English-learner rate fell 1.9 points in 2021, from 76.5% to 74.6%. It then rose in each of the next four reporting years. By 2022, it was above the 2019 level.
| Year | All Students | English Learners | Gap |
|---|---|---|---|
| 2019 | 86.2% | 72.0% | 14.2pp |
| 2020 | 88.0% | 76.5% | 11.5pp |
| 2021 | 86.8% | 74.6% | 12.2pp |
| 2022 | 87.3% | 76.8% | 10.5pp |
| 2023 | 87.6% | 77.3% | 10.3pp |
| 2024 | 87.7% | 77.8% | 9.9pp |
| 2025 | 89.0% | 80.3% | 8.7pp |
The gap fell below 10 points for the first time in the available 2019-2025 panel in 2024, and it continued to narrow in 2025.
The fifth year belongs to a different graduating class
Illinois reports a five-year rate in the year after the corresponding four-year cohort. The like-for-like comparison is therefore the 2025 five-year rate against the 2024 four-year rate, not two rates from the same reporting year.
For English learners, that comparison rises from 77.8% to 83.1%, a 5.3-point lift. The all-student rate rises from 87.7% to 89.9%, a 2.2-point lift. English learners rank third on this corrected extra-year comparison, behind Native American students and students who are homeless.
The data describe different outcomes for adjacent cohorts; they do not establish why students use an additional year or which program, if any, caused the difference.
Leading the improvement rankings
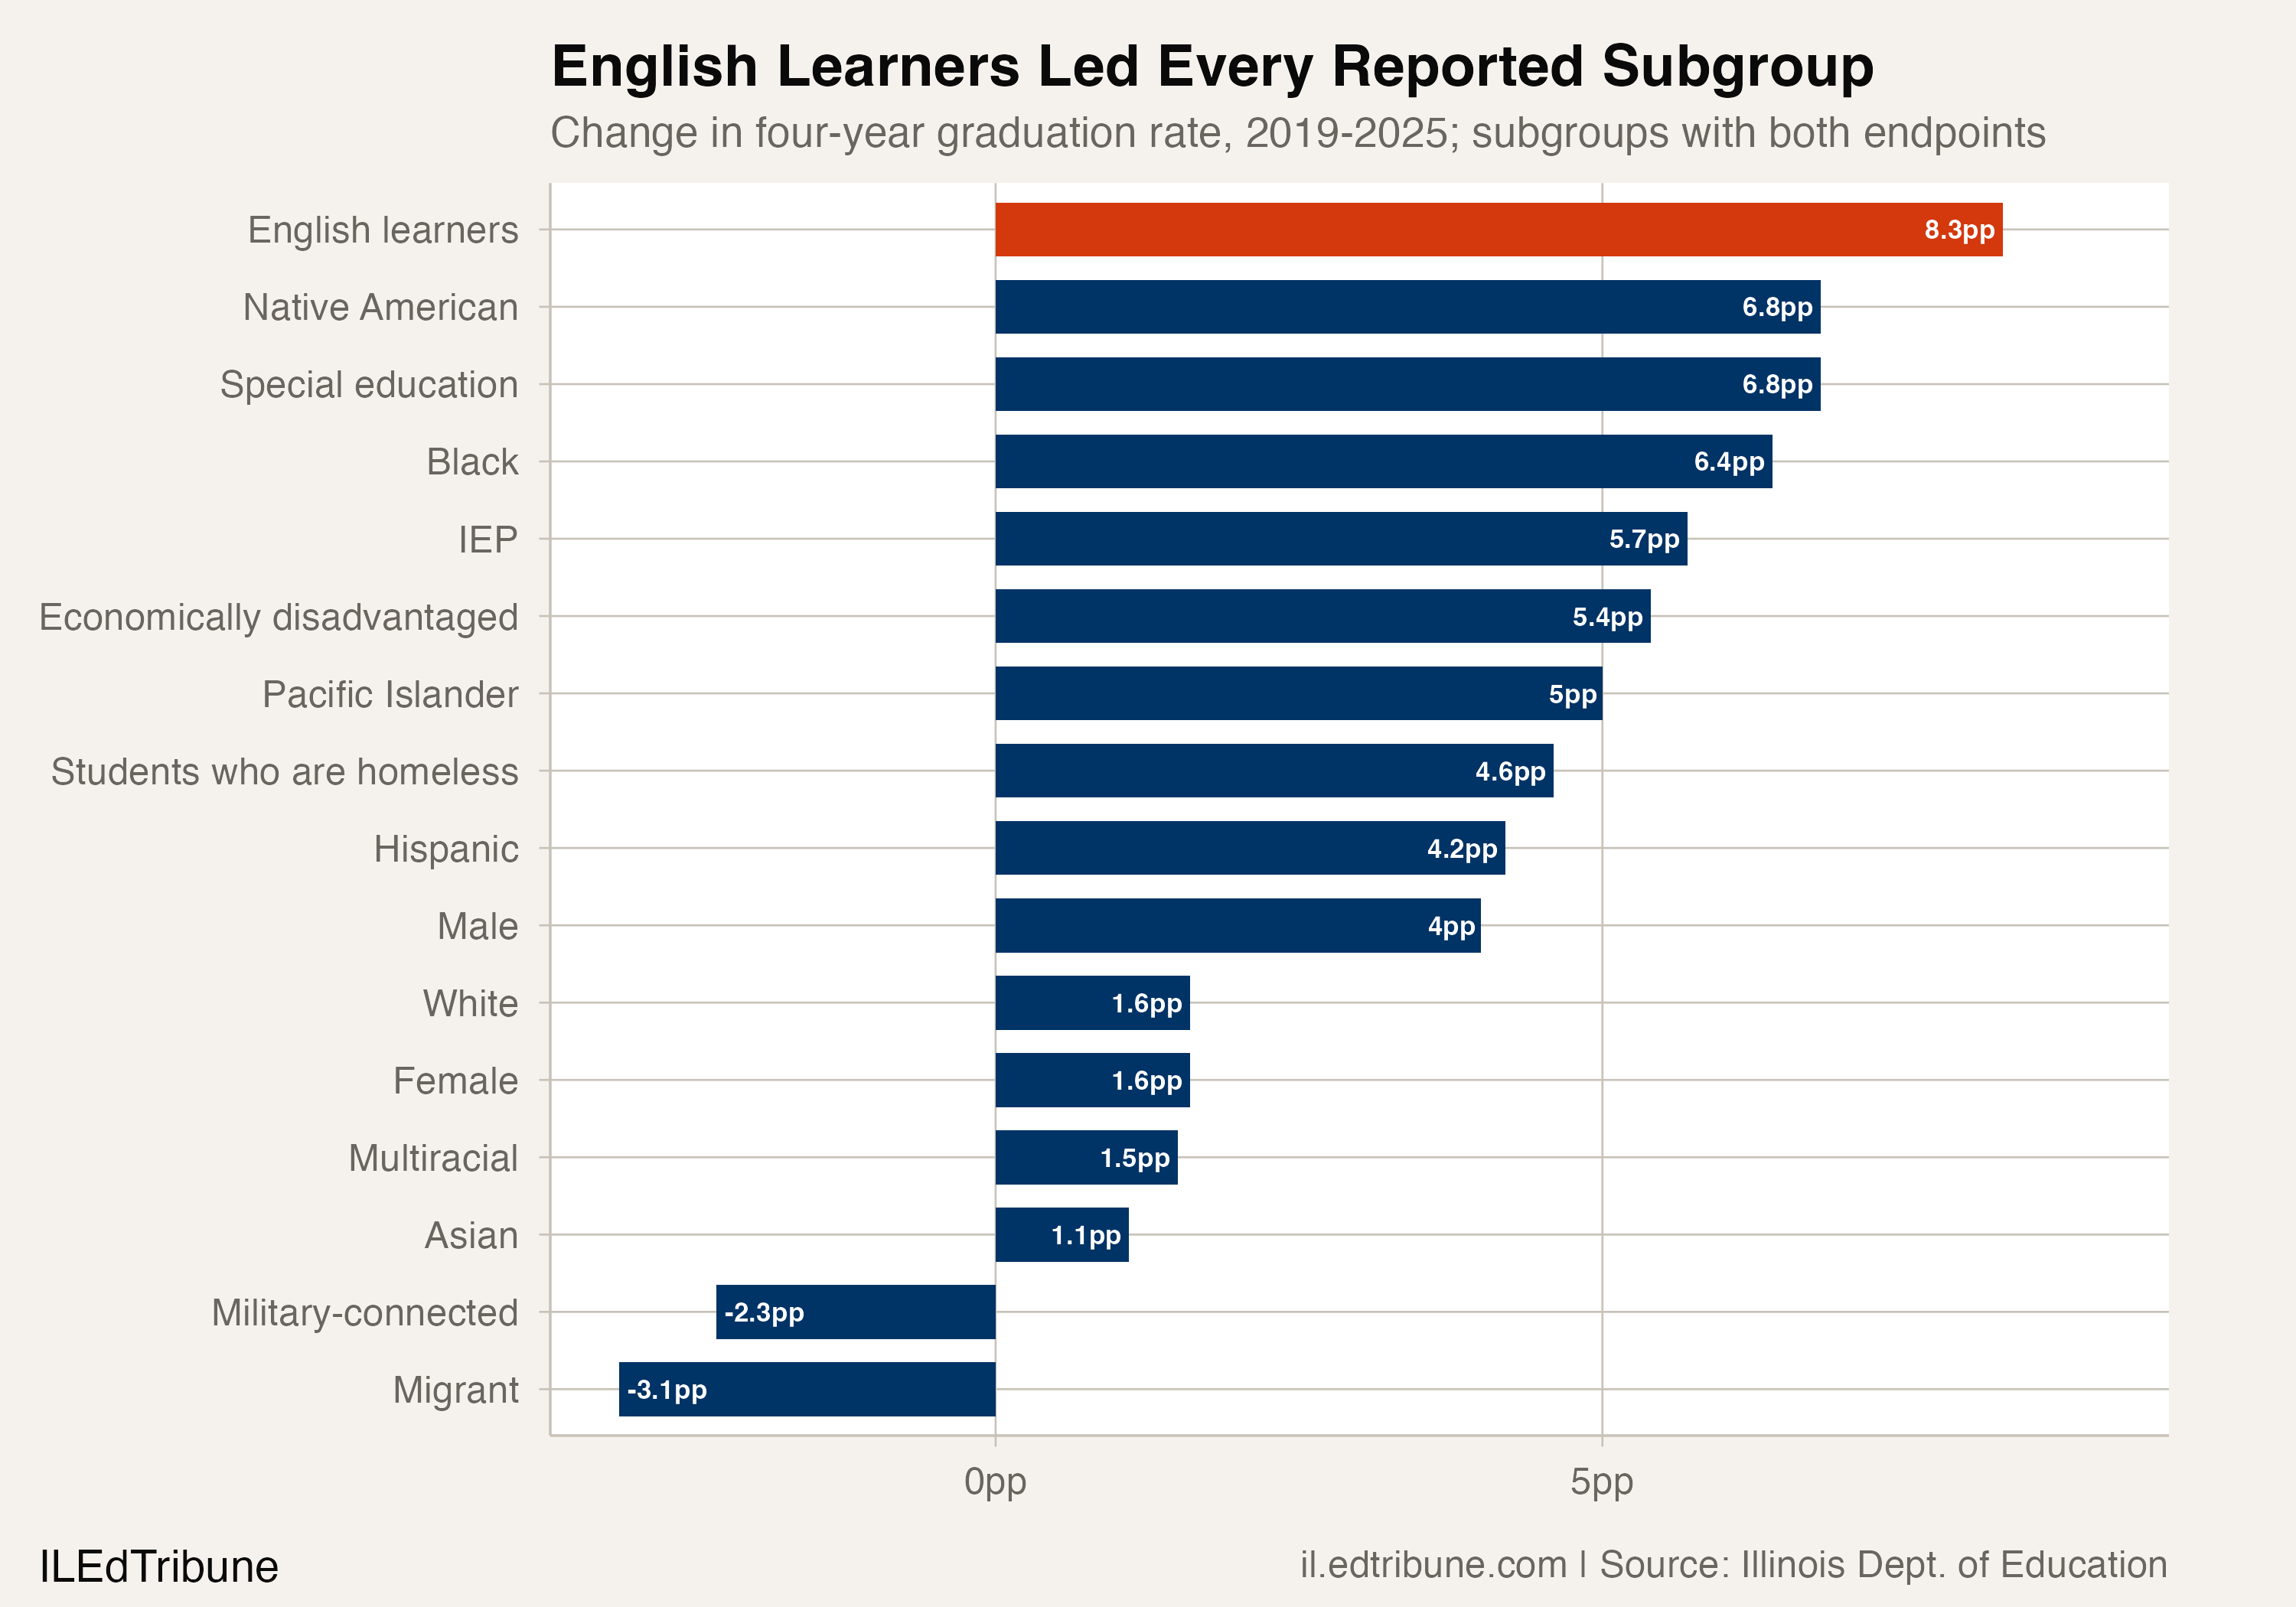
English learners' 8.3-point gain tops the improvement ranking across all 16 reported statewide subgroups with non-missing rates in both 2019 and 2025. The chart shows the complete comparison universe; the all-student aggregate is the benchmark rather than a subgroup.
The pattern is a descriptive comparison of published rates. The data alone cannot identify whether program changes, school environments, student composition, or regression to the mean produced the different gains.
The Aurora East connection
One district-level example is Aurora East USD 131↗ET, where the all-student four-year rate climbed from 66.6% in 2019 to 90.5% in 2025 through six consecutive annual gains. The package shows the trajectory, not which practices caused it or whether other districts copied them.
Graduation rates come from the Illinois State Board of Education and cover the four-year adjusted cohort graduation rate for public school districts, 2019-2025.
Detailed code that reproduces the analysis and figures in this article is available exclusively to EdTribune subscribers.
Discussion
Sign in to join the discussion.
Loading comments...