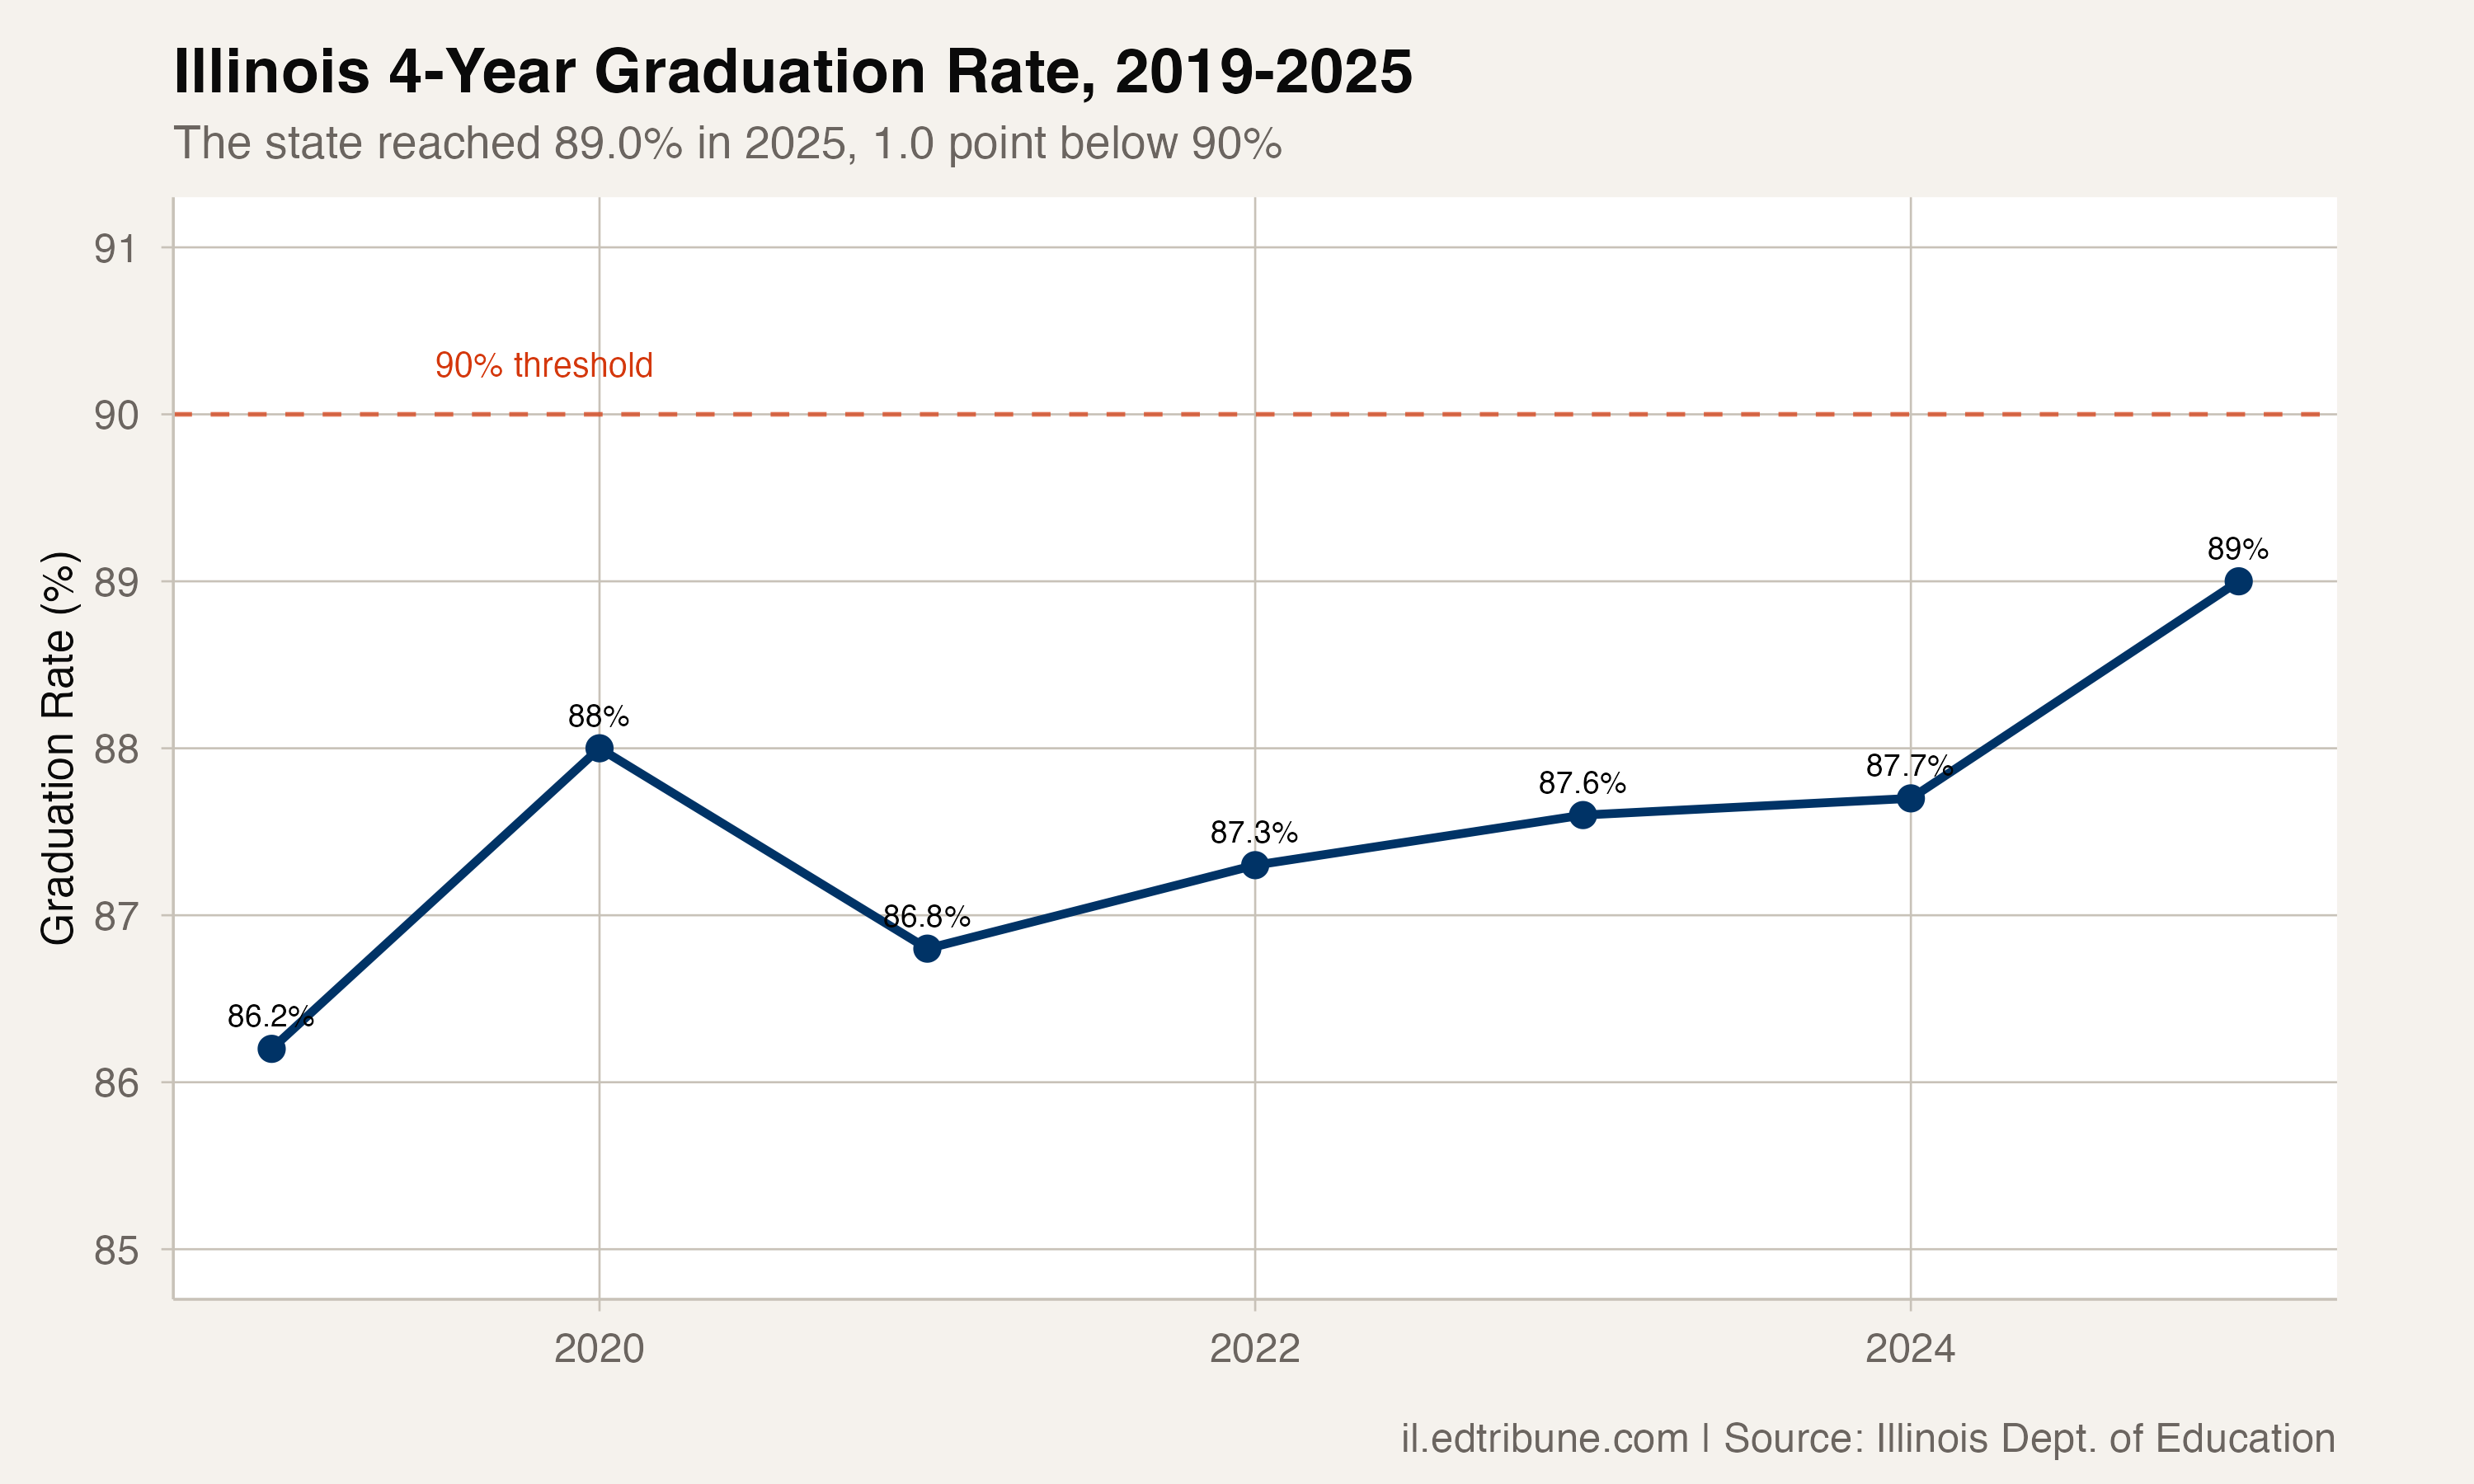
Illinois's four-year graduation rate reached 89.0% in 2025, the highest point in the comparable 2019-2025 graduation-rate data.
The source is the Illinois State Board of Education Report Card.
The state is also 1.0 percentage point below 90.0%, a threshold it has not reached in that seven-year series.
The rate has risen for four straight reported years since 2021, when it stood at 86.8%. Direct evidence: the data verifies the reported rates and the streak; it does not identify the policy causes of the year-to-year movement.
The climb, year by year
The statewide four-year rate moved this way:
- 2019: 86.2%
- 2020: 88.0%
- 2021: 86.8%
- 2022: 87.3%
- 2023: 87.6%
- 2024: 87.7%
- 2025: 89.0%
The 1.3-point jump from 2024 to 2025 was the largest single-year gain since 2020 in the comparable state series. Across Illinois, 293 of 469 districts with comparable 2024 and 2025 data improved their graduation rates, while 167 declined and 9 held steady.
A high point, but not without caveats
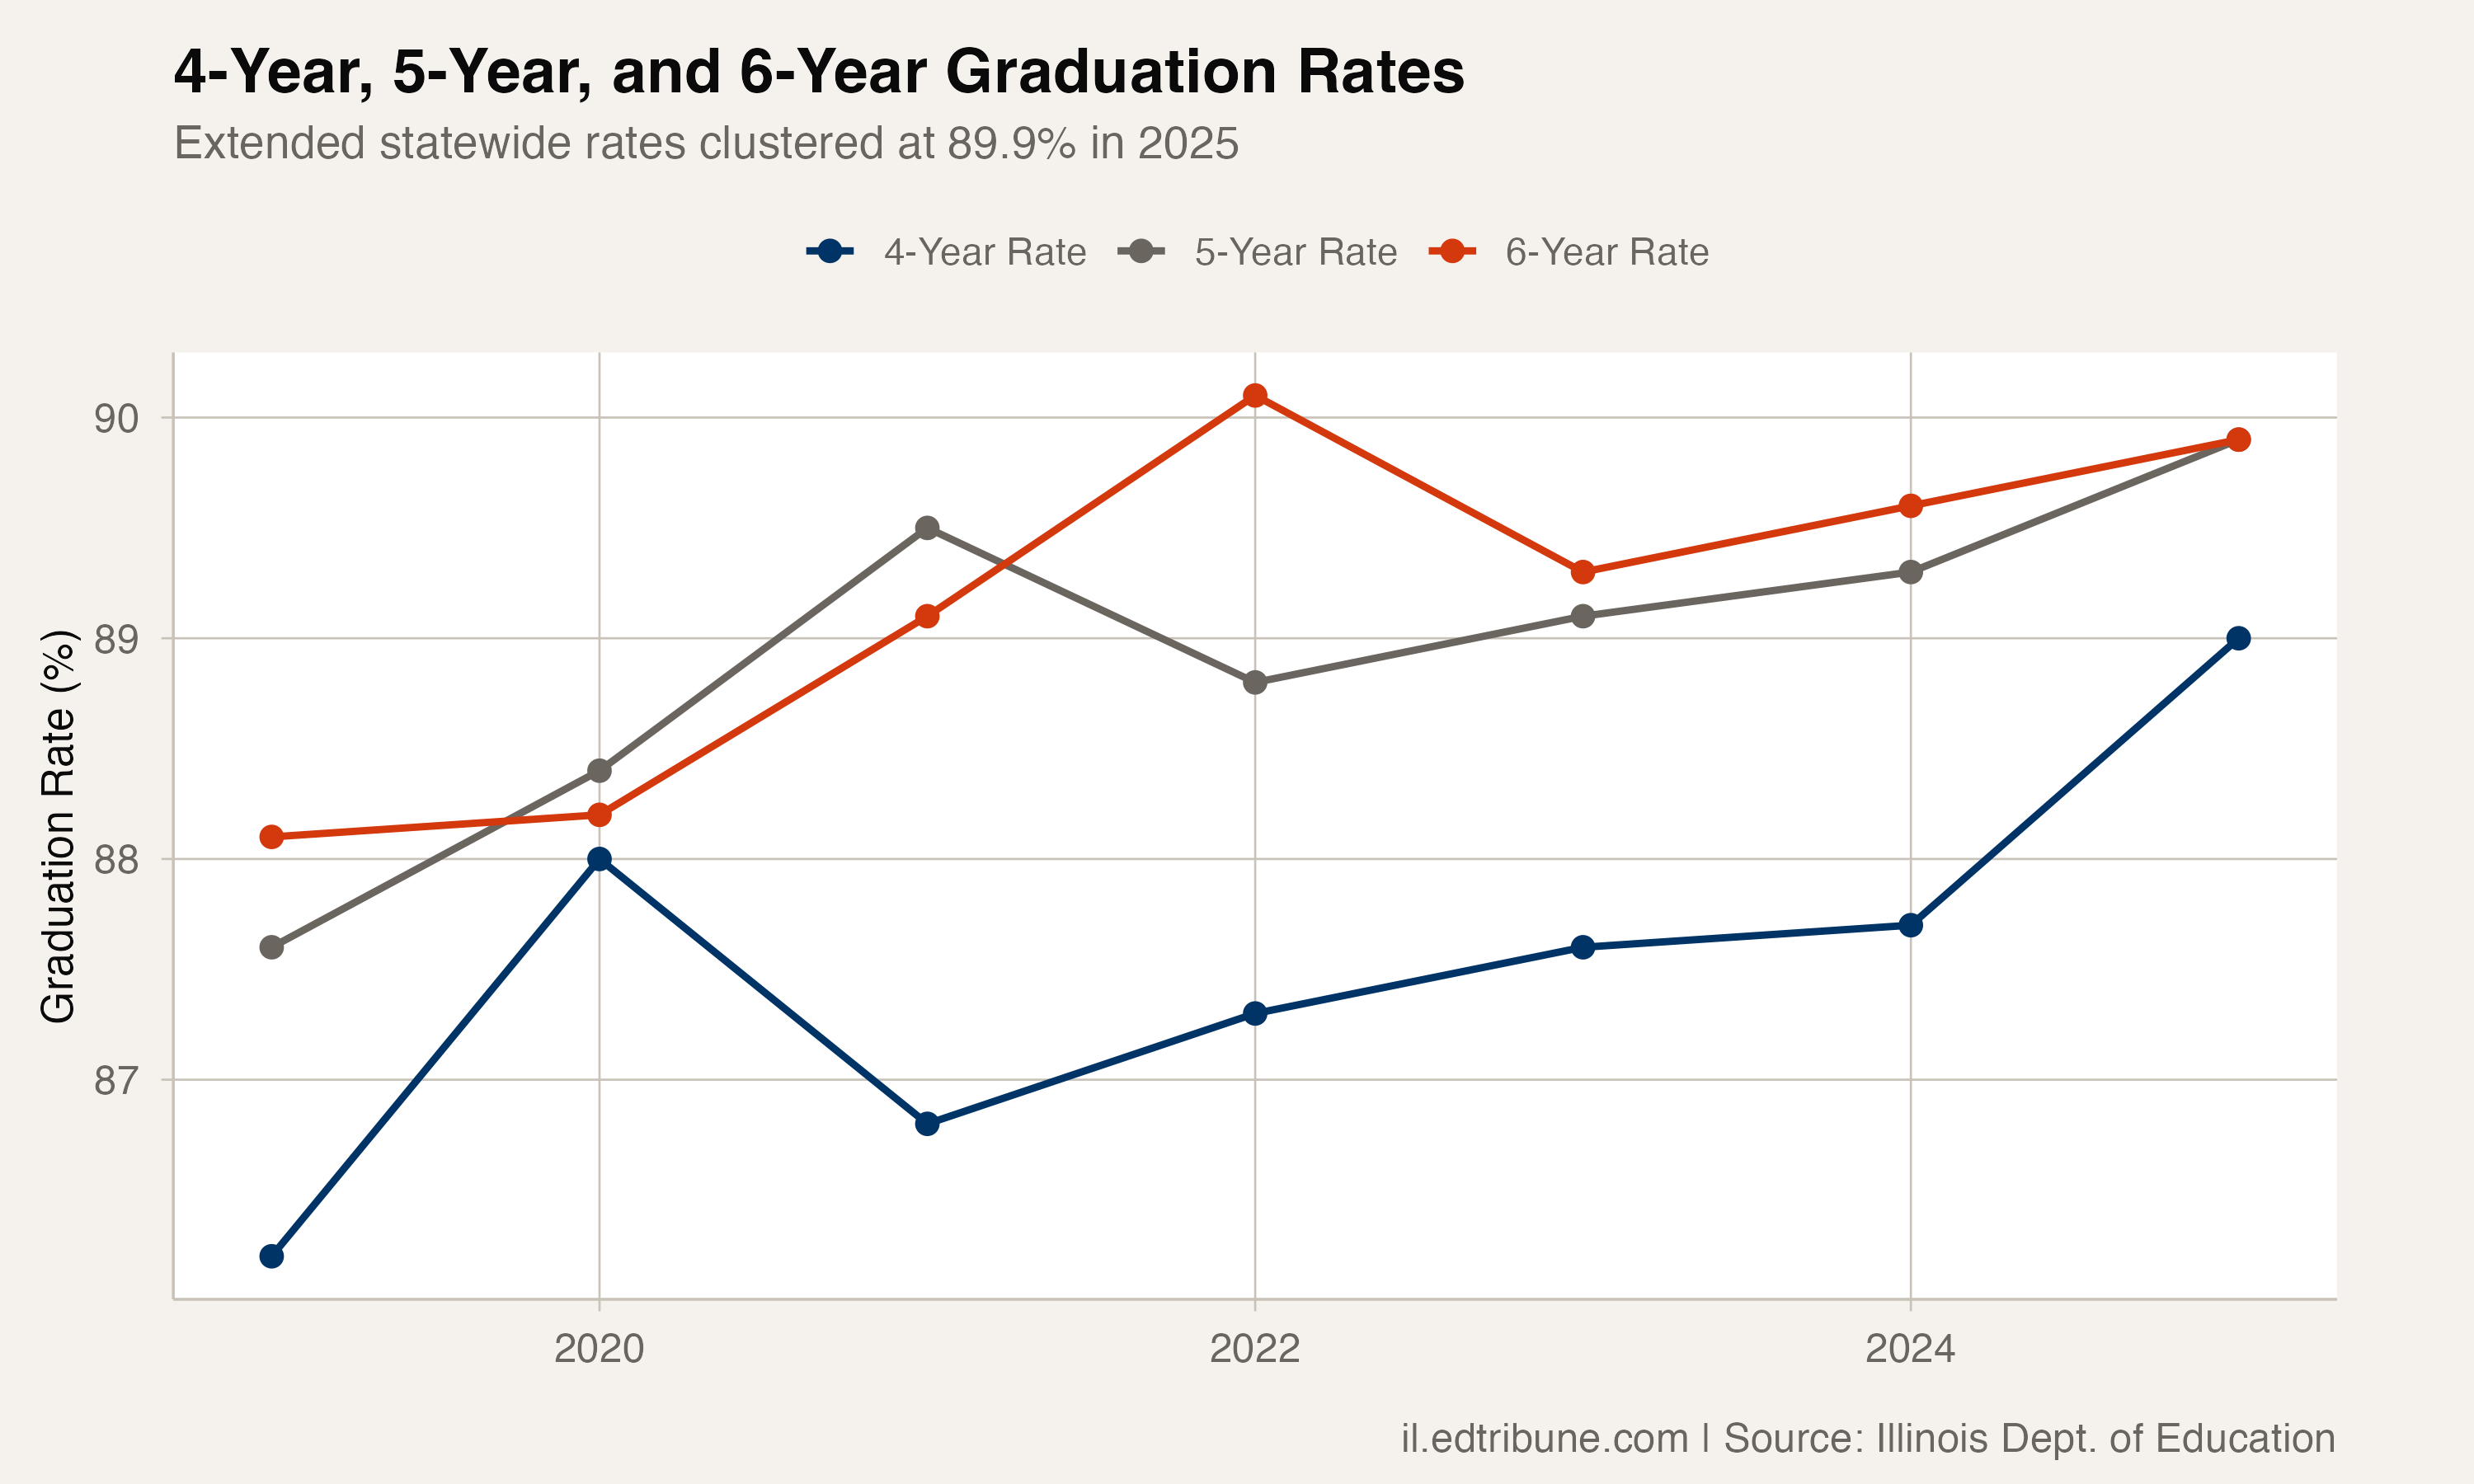
The five-year graduation rate in 2025 stands at 89.9%. The six-year rate is also 89.9%. At the statewide level, the fifth year adds 0.9 percentage point to the four-year rate.
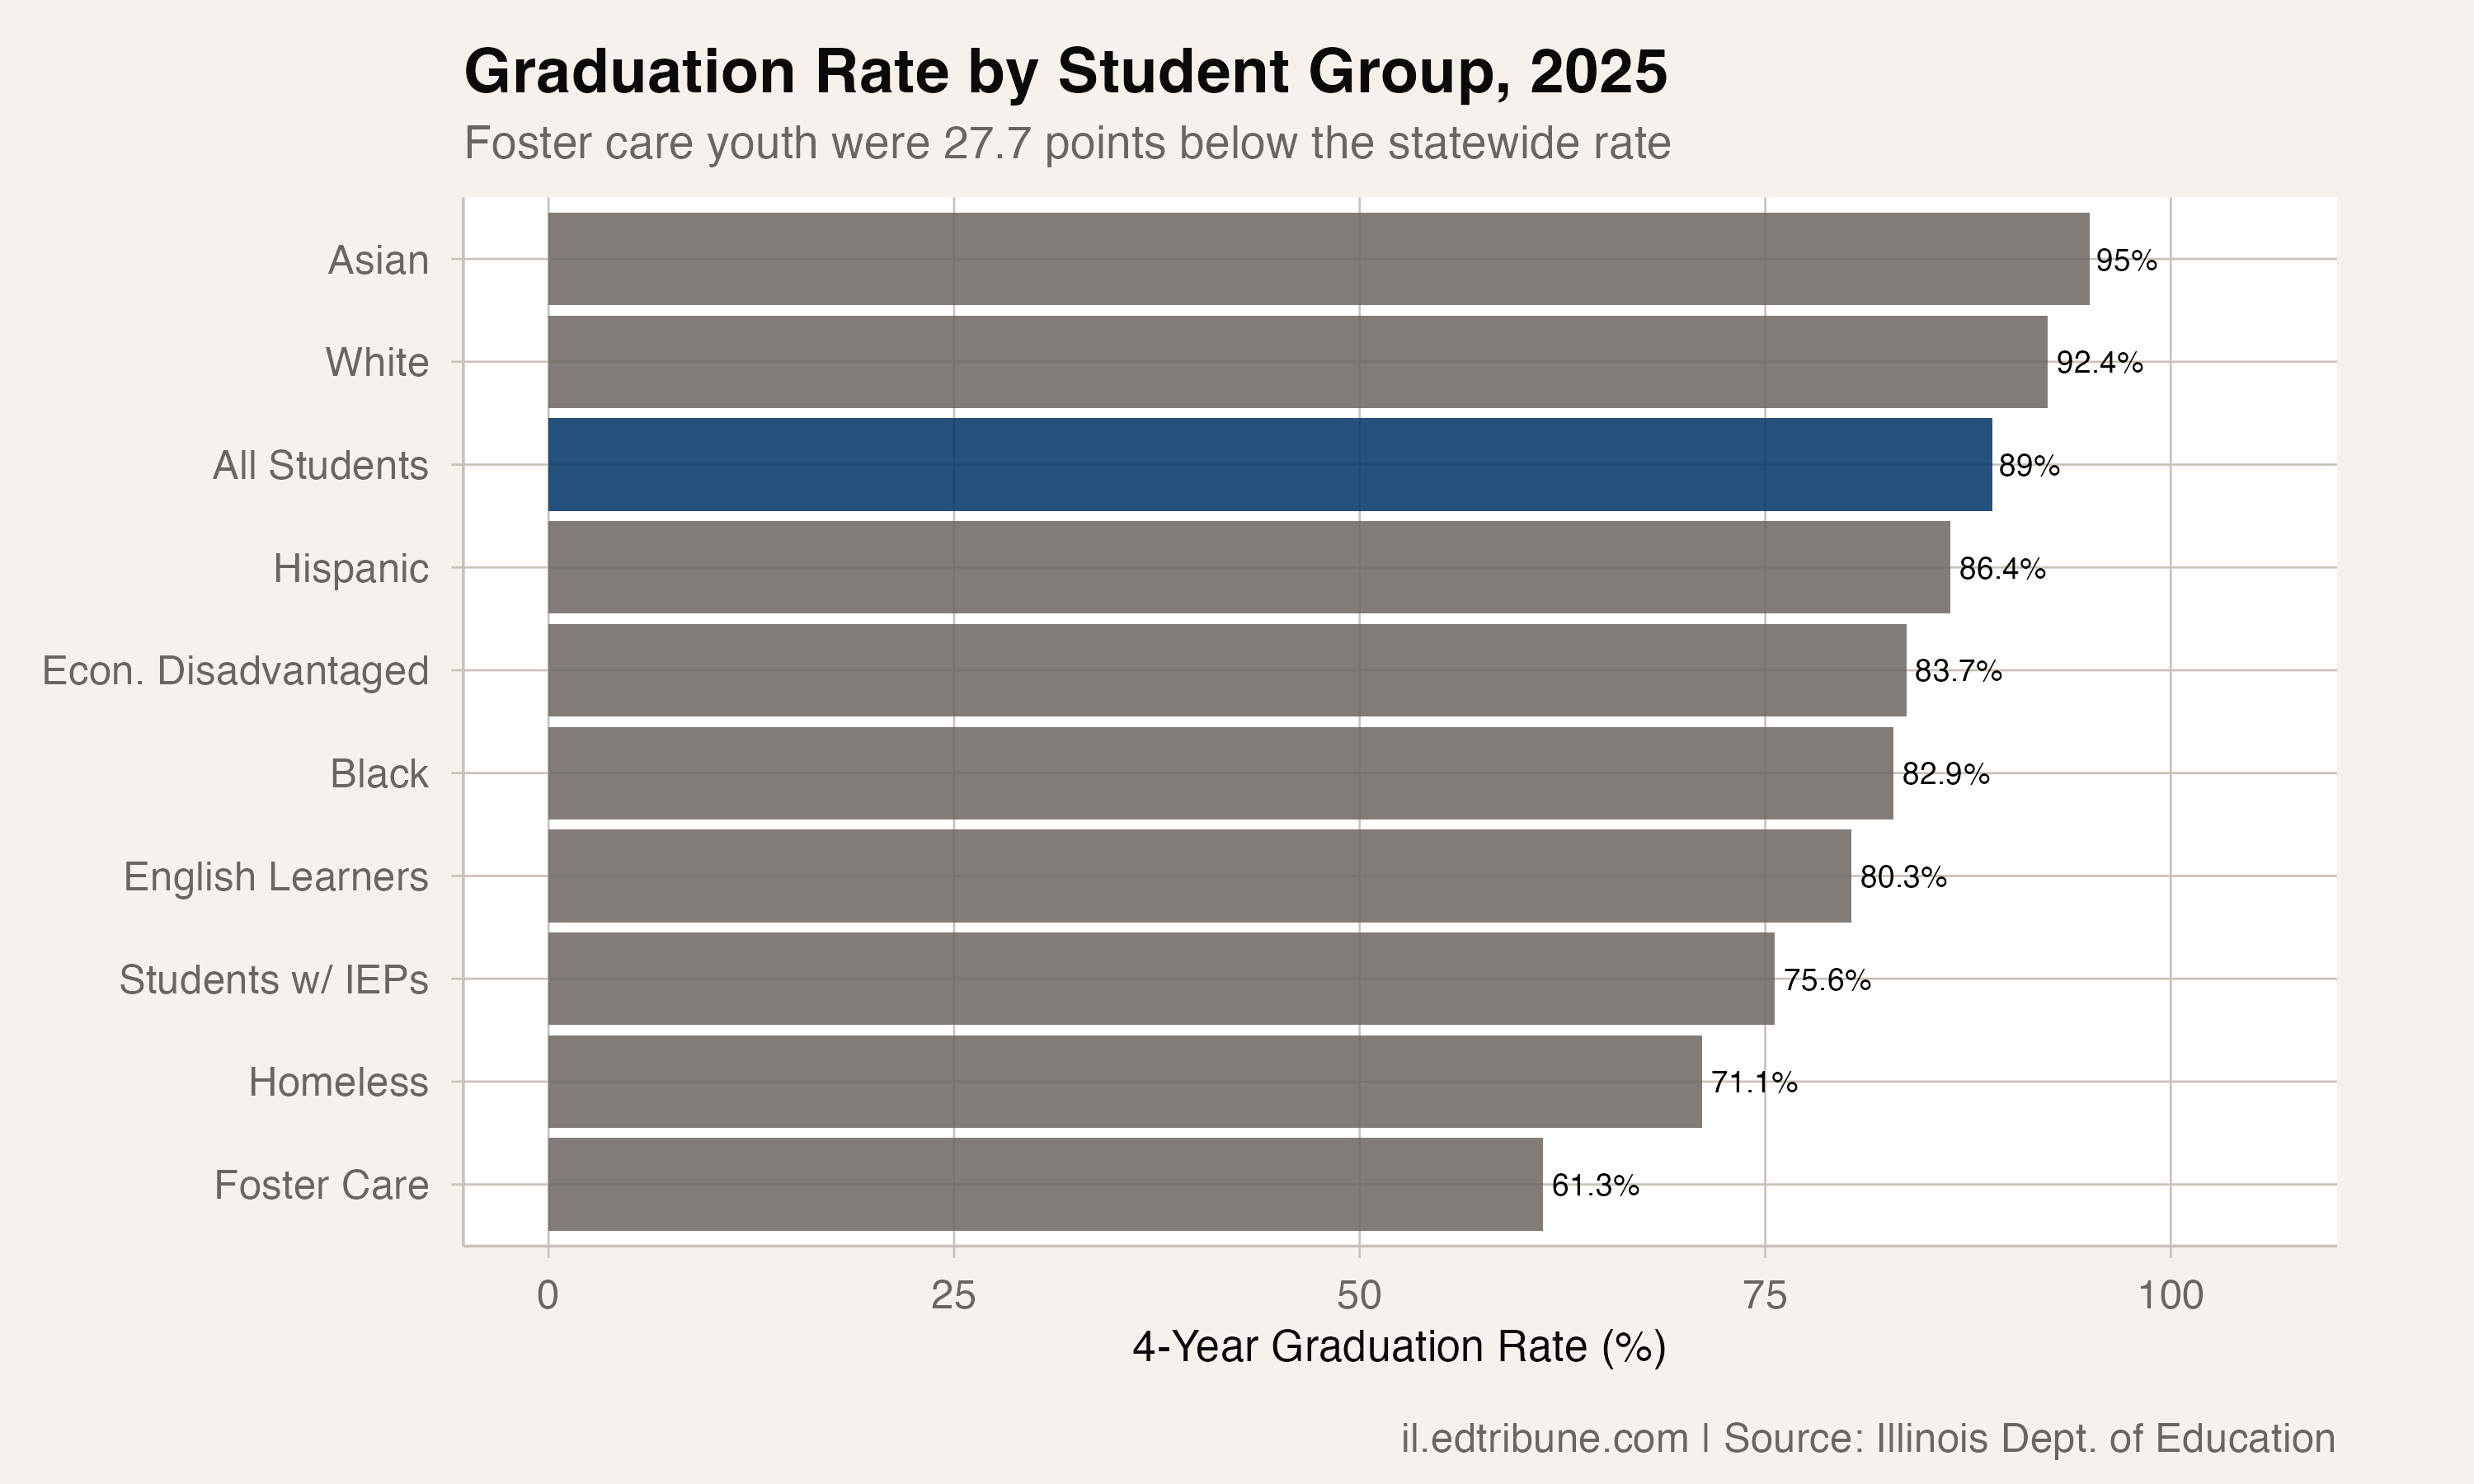
But the statewide average masks deep disparities. Asian students graduate at 95.0%, and white students at 92.4%. At the other end, foster care youth graduate at 61.3%, students who are currently homeless at 71.1%, and students with Individualized Education Programs at 75.6%.
The 90% question
Illinois is 1.0 point from 90.0%. A simple arithmetic scenario shows how close that is: adding the latest 1.3-point annual gain to the 2025 rate would produce 90.3%, while adding the average annual gain since 2021 would produce 89.6%.
Getting above 90.0% with the current gaps intact would still leave large subgroup differences. The gap between all students and foster care youth is 27.7 points. The gap for students who are currently homeless is 17.9 points. The gap for students with IEPs is 13.4 points.
What the extended rates reveal
The narrow gap between four-year and five-year rates at the state level conceals significant variation by subgroup. For students who are currently homeless, the fifth year adds 4.7 percentage points. For English learners, it adds 2.8 points. For foster care youth, it adds 0.5 point.
The statewide data does not show a large pool of students graduating in years five or six after missing the four-year mark. It does show that the added year matters more for some student groups than for others.
What comes next
The four-year improvement streak is the longest in the seven-year comparable series, but the gains have been modest in most years. The 2025 increase is real inside the available data. So is the remaining gap to 90.0%, and so are the subgroup gaps beneath the statewide average.
Data source: Illinois State Board of Education Report Card.
Analysis covers statewide and district four-year adjusted cohort graduation rates, plus statewide five-year and six-year graduation rates, 2019-2025.
Detailed code that reproduces the analysis and figures in this article is available exclusively to EdTribune subscribers.
Discussion
Sign in to join the discussion.
Loading comments...