Illinois's graduation rates rise when an entering class is followed beyond the four-year mark. For the most recent matched statewide cohort, the rate increased from 87.7% to 89.9%, a gain of 2.2 percentage points. English learners recorded a larger increase, from 77.8% to 83.1%, or 5.3 points.
Students in foster care also recorded a larger increase than the overall cohort: from 57.6% to 61.8%, a gain of 4.2 points.
These are statewide outcomes, not a comparison of local programs. The Illinois State Board of Education's cohort rules track students from their first entry into high school and adjust the group for transfers and other qualifying exits. The rates show where the adjusted cohort stood at each reporting point; they do not identify an intervention that produced the change.
Follow the entering class
A four-year rate and a five-year rate published in the same report describe different entering classes. Comparing those two rates does not measure what happened when one class had an additional year.
The comparison here pairs the four-year rates reported in 2024 with the five-year rates reported in 2025. Both refer to students who first entered high school in 2020-21. The state's graduation records available for this analysis end in 2024-25; these are historical results, not outcomes for the current school year.
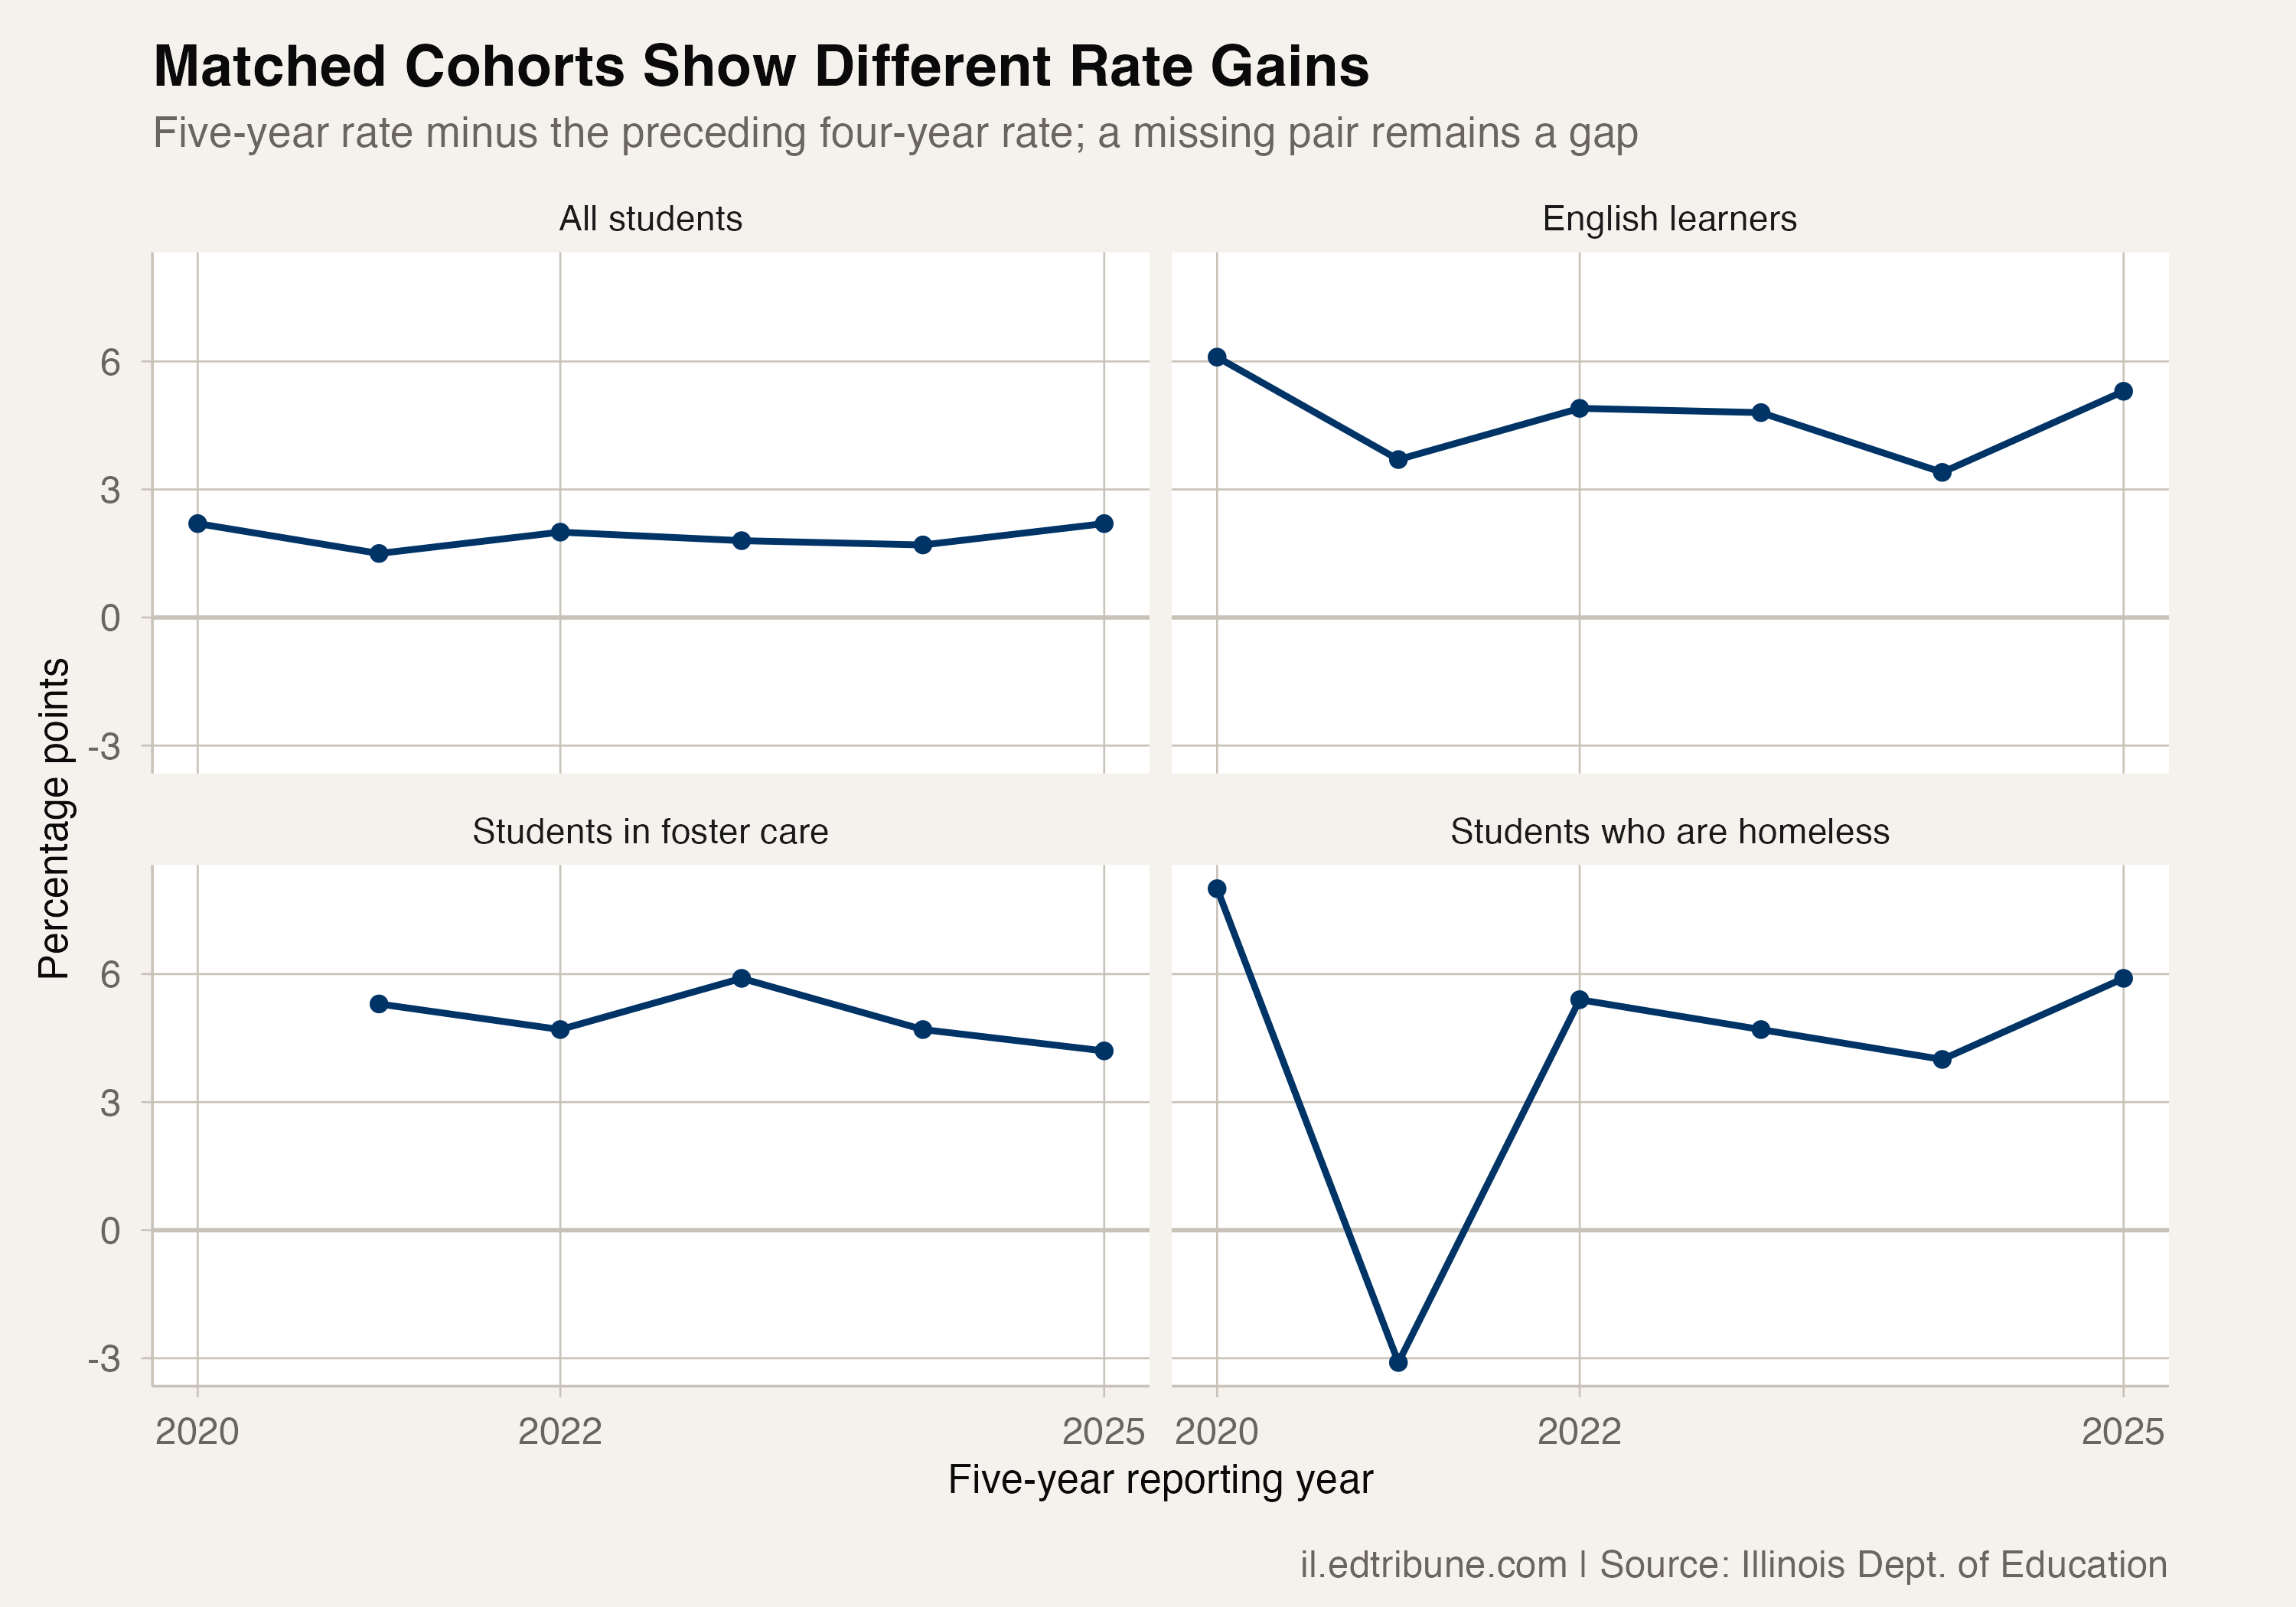
The earlier matched cohorts help check the interpretation. Rate changes vary across entering classes, and the adjusted rate can even fall between reporting points. The cohort is not a fixed roster that can be recovered from a rounded percentage. An increase in the published rate should not be converted into a count of additional graduates without the corresponding cohort denominators.
Larger gains across several groups
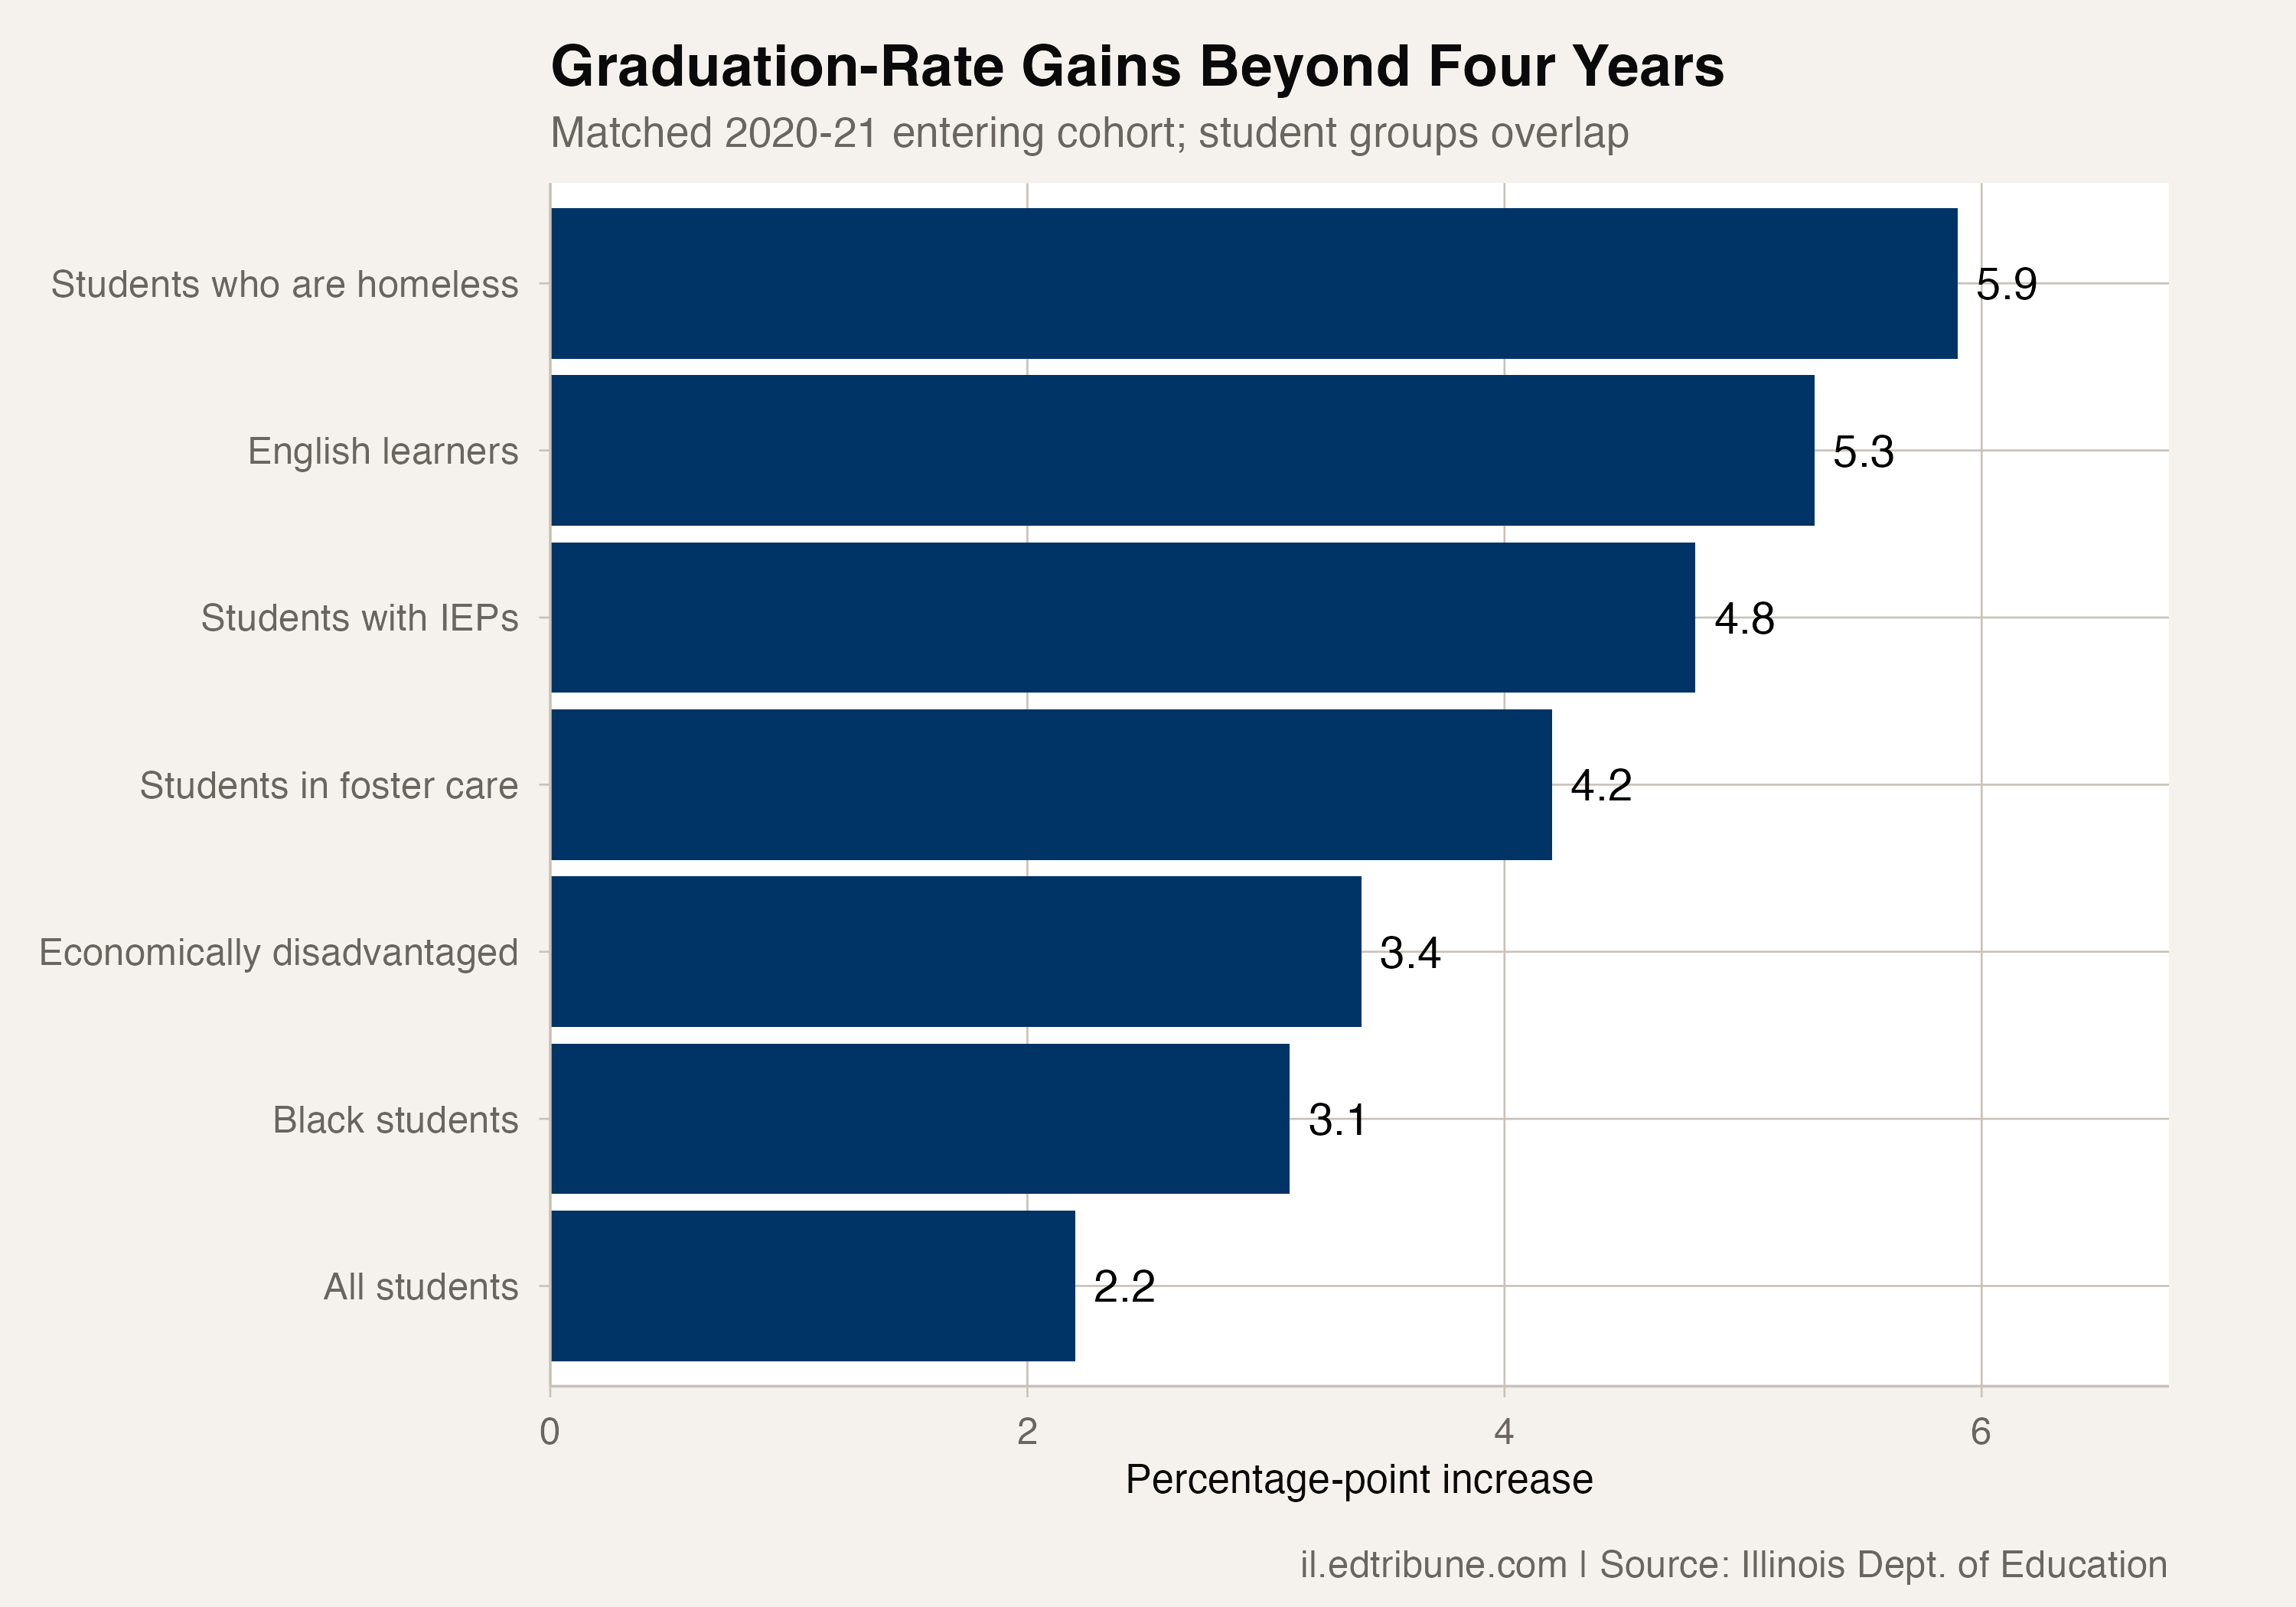
| Student group | Four-year rate | Five-year rate | Increase in percentage points |
|---|---|---|---|
| All students | 87.7% | 89.9% | 2.2 |
| Students who are currently homeless in Illinois | 69.9% | 75.8% | 5.9 |
| English learners | 77.8% | 83.1% | 5.3 |
| Students with IEPs | 72.5% | 77.3% | 4.8 |
| Students in foster care | 57.6% | 61.8% | 4.2 |
| Students who are economically disadvantaged | 81.8% | 85.2% | 3.4 |
| Black students | 80.7% | 83.8% | 3.1 |
The service groups overlap. A student can be an English learner and have an IEP, for example; these rows cannot be added to produce a statewide total. Each rate retains the state's own adjusted-cohort denominator.
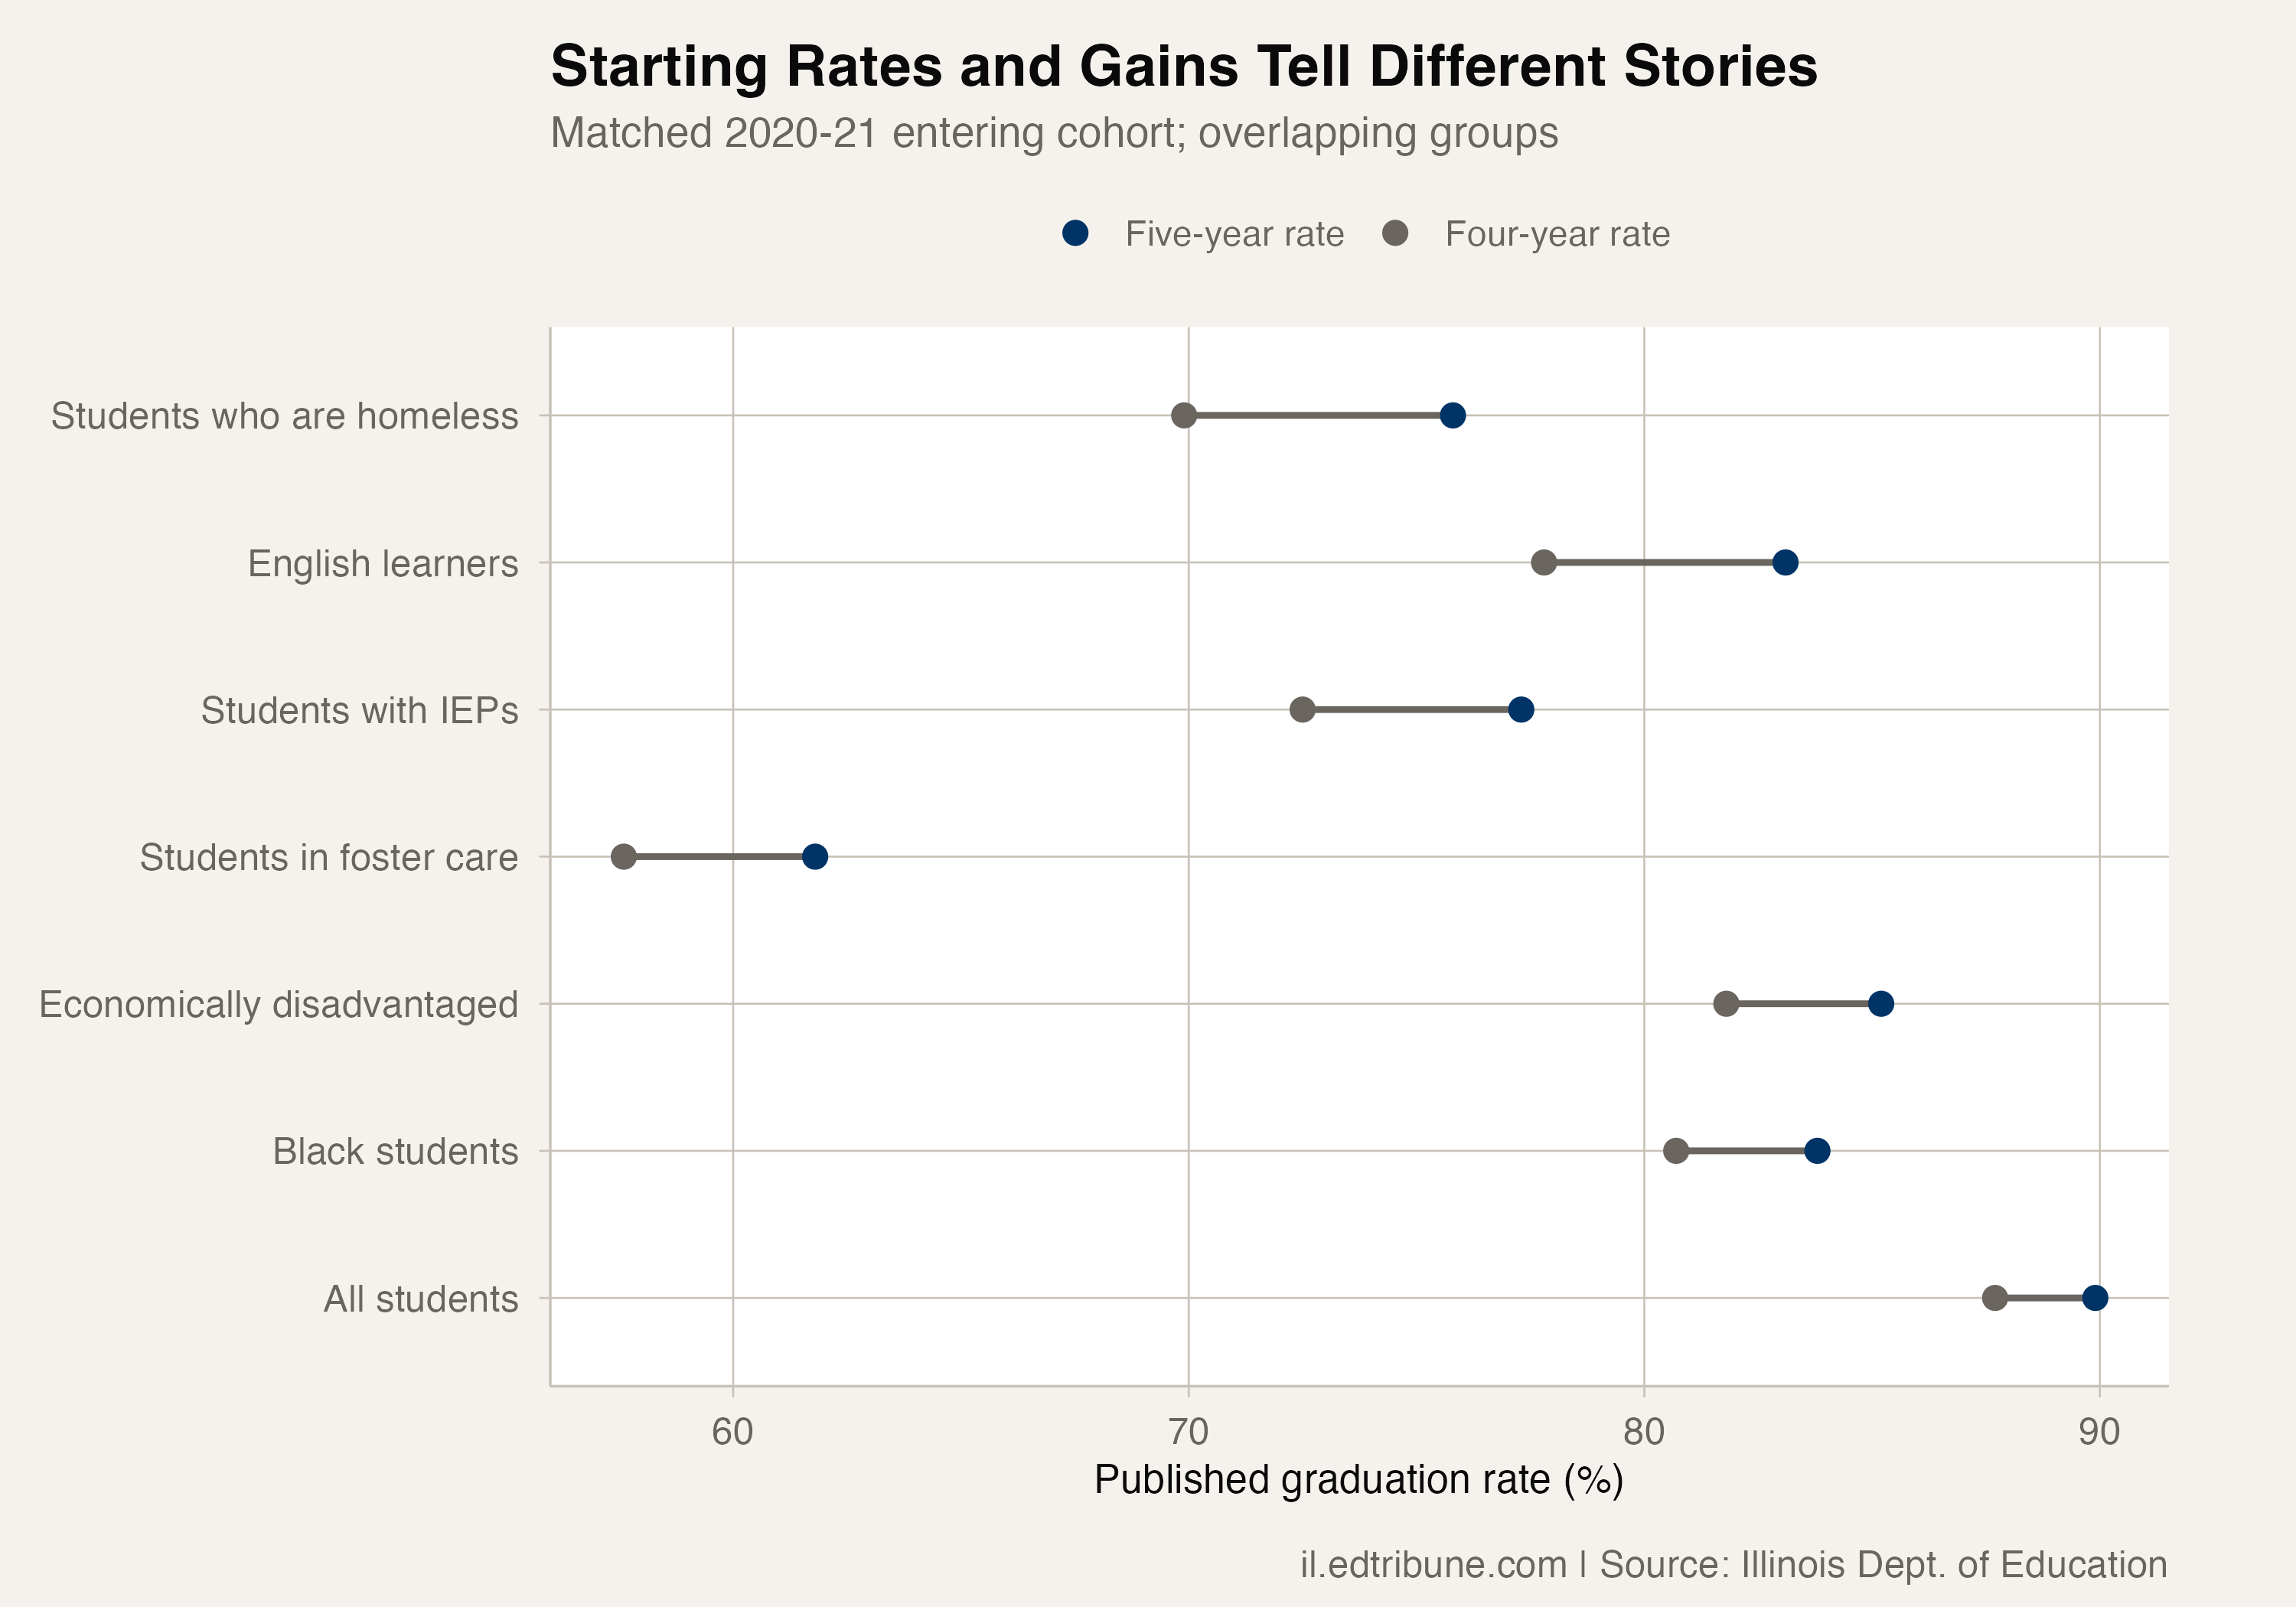
The increase and the ending rate answer different questions. A group can record a larger gain while its graduation rate remains below the statewide rate. For students in foster care, the increase is substantial relative to the overall gain, but it does not erase the difference in the ending rates.
The records do not say whether language instruction, credit recovery, housing support or another service explains the gains. They also do not provide the cohort denominators needed to turn these rate differences into additional graduates. The decision for districts is which students need continued support after the expected graduation date; this comparison provides a reason to examine that work, not proof that more time alone is the solution.
Graduation rates come from the Illinois State Board of Education's Report Card Data Library.
Detailed code that reproduces the analysis and figures in this article is available exclusively to EdTribune subscribers.
Discussion
Sign in to join the discussion.
Loading comments...