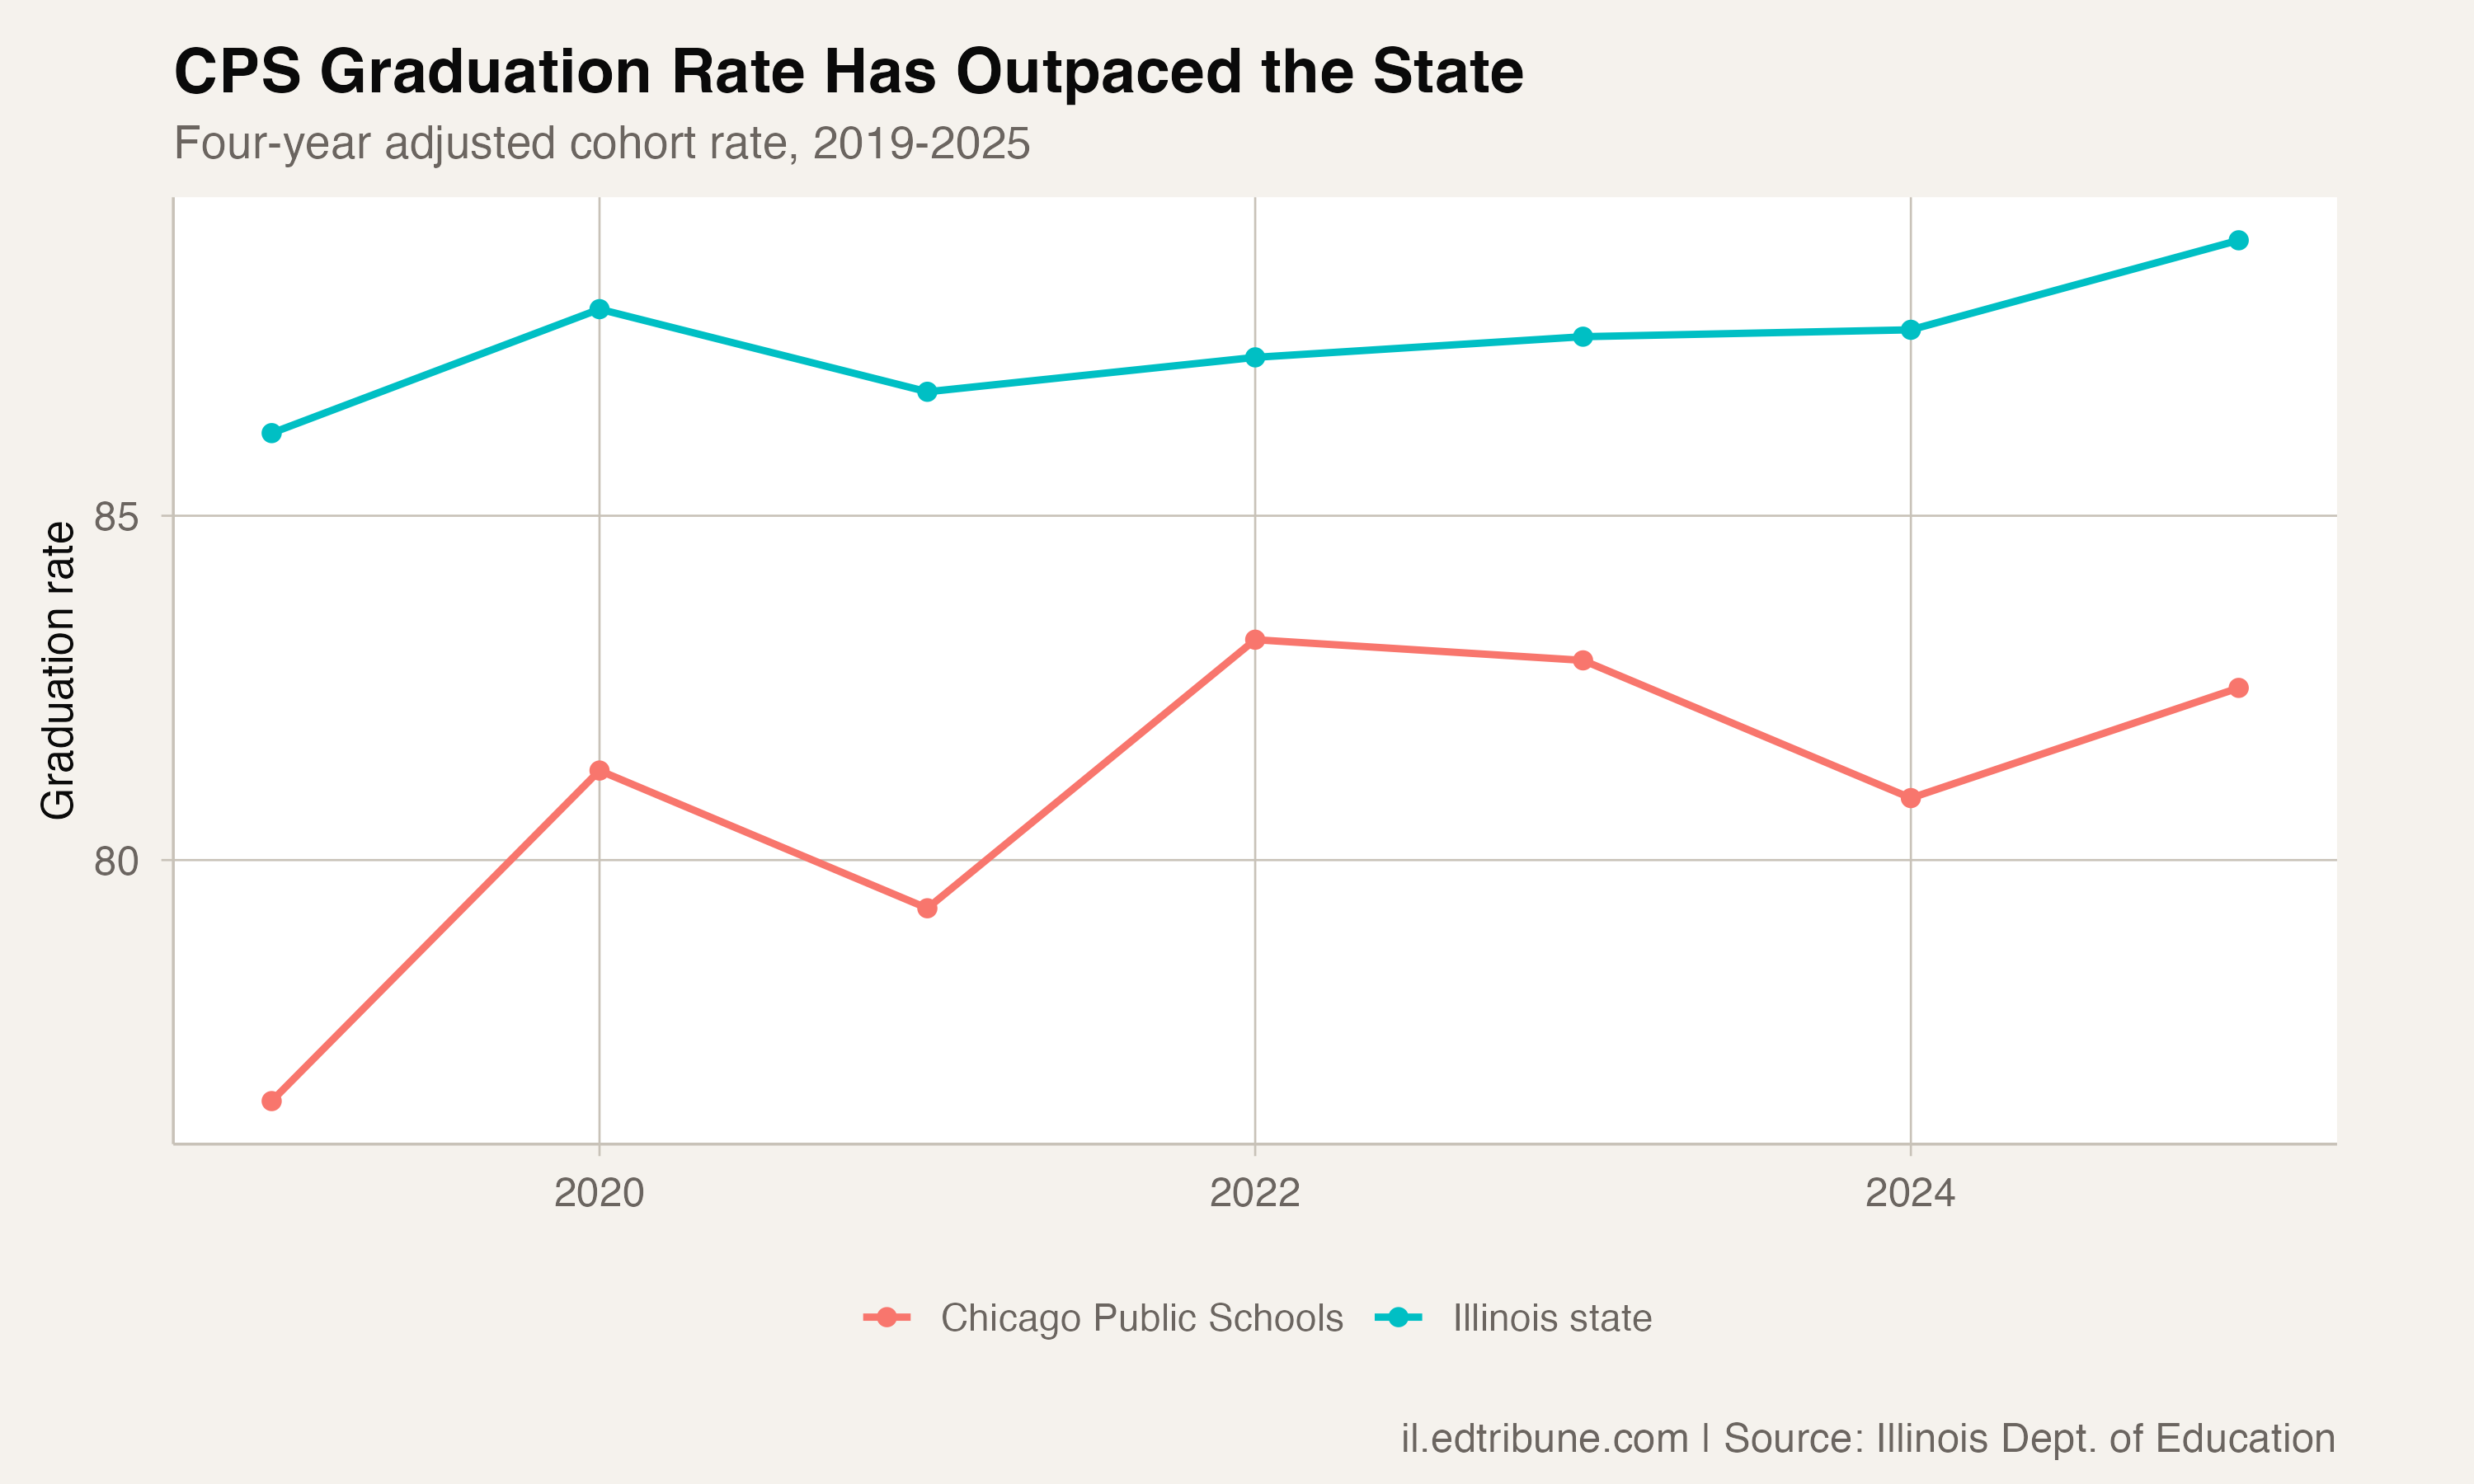
Chicago Public Schools↗ET graduated 82.5% of its computed 26,712-student cohort proxy in 2025, up from 76.5% in 2019. The 6-point gain since 2019 is substantial for Illinois' largest school district, but CPS still trails the state average by 6.5 percentage points.
The gap sits alongside large demographic differences. CPS enrolls a disproportionate share of Illinois' most vulnerable student populations, and its demographics look nothing like the state outside Chicago, which is 50.8% white. What the numbers show, however, is that CPS is making progress at a faster rate than the state.
The equity picture within CPS
One of the more surprising findings in the data is that CPS's White-Black graduation gap, at 8.4 percentage points, is actually narrower than the state's 9.5-point gap. In 2025, CPS white students graduated at 88.6% and Black students at 80.2%.
The statewide figures are 92.4% and 82.9% respectively. CPS white students graduate at a lower rate than the state's white students, but CPS Black students are closer to their white peers than Black students statewide are to theirs.
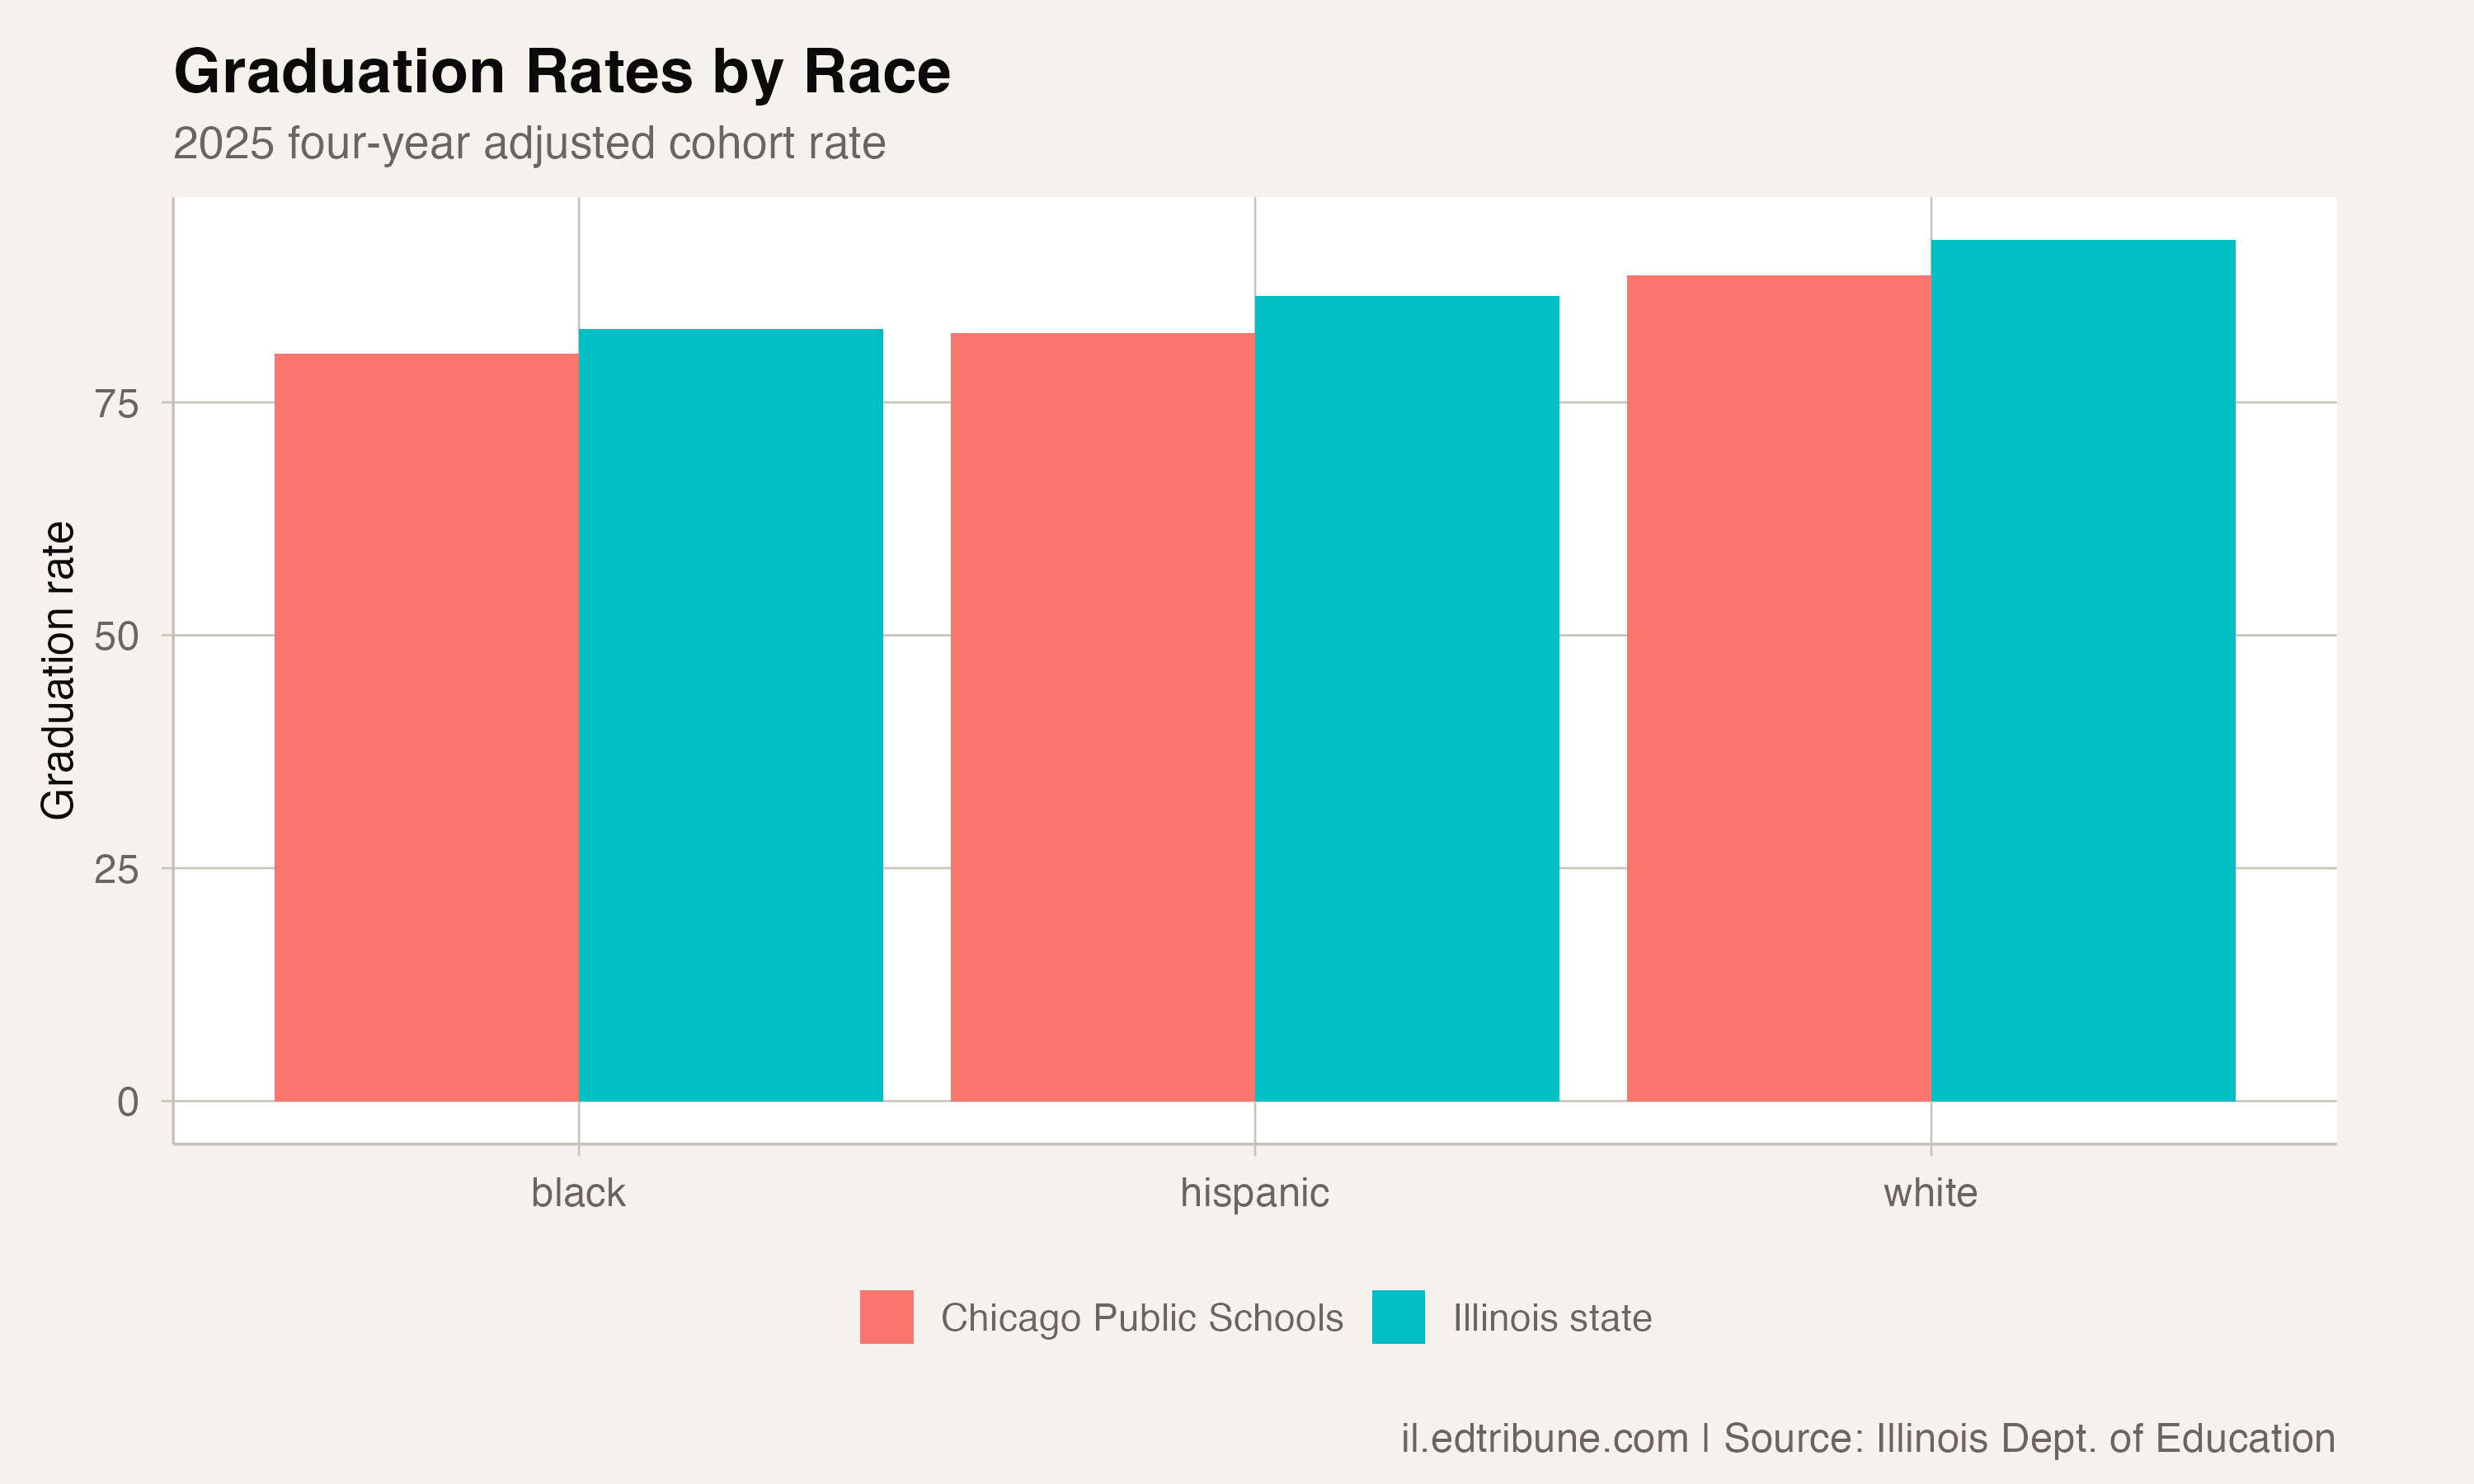
Hispanic students at CPS graduated at 82.4%, essentially matching the district's overall rate and 4 points below Hispanic students statewide, who graduated at 86.4%. The CPS Hispanic rate has not moved in a straight line: it climbed from 78.2% in 2019 to a 2022 peak of 84.0%, then fell back, and it has not returned to that peak. The district's racial demographics create a different equity landscape than the state as a whole, where 44.0% of students are white.
The most vulnerable CPS students
Where CPS struggles most starkly is with its most vulnerable populations. Foster care youth at CPS graduated at just 43.9%, 17.4 points below the state's already-low foster care rate of 61.3%.
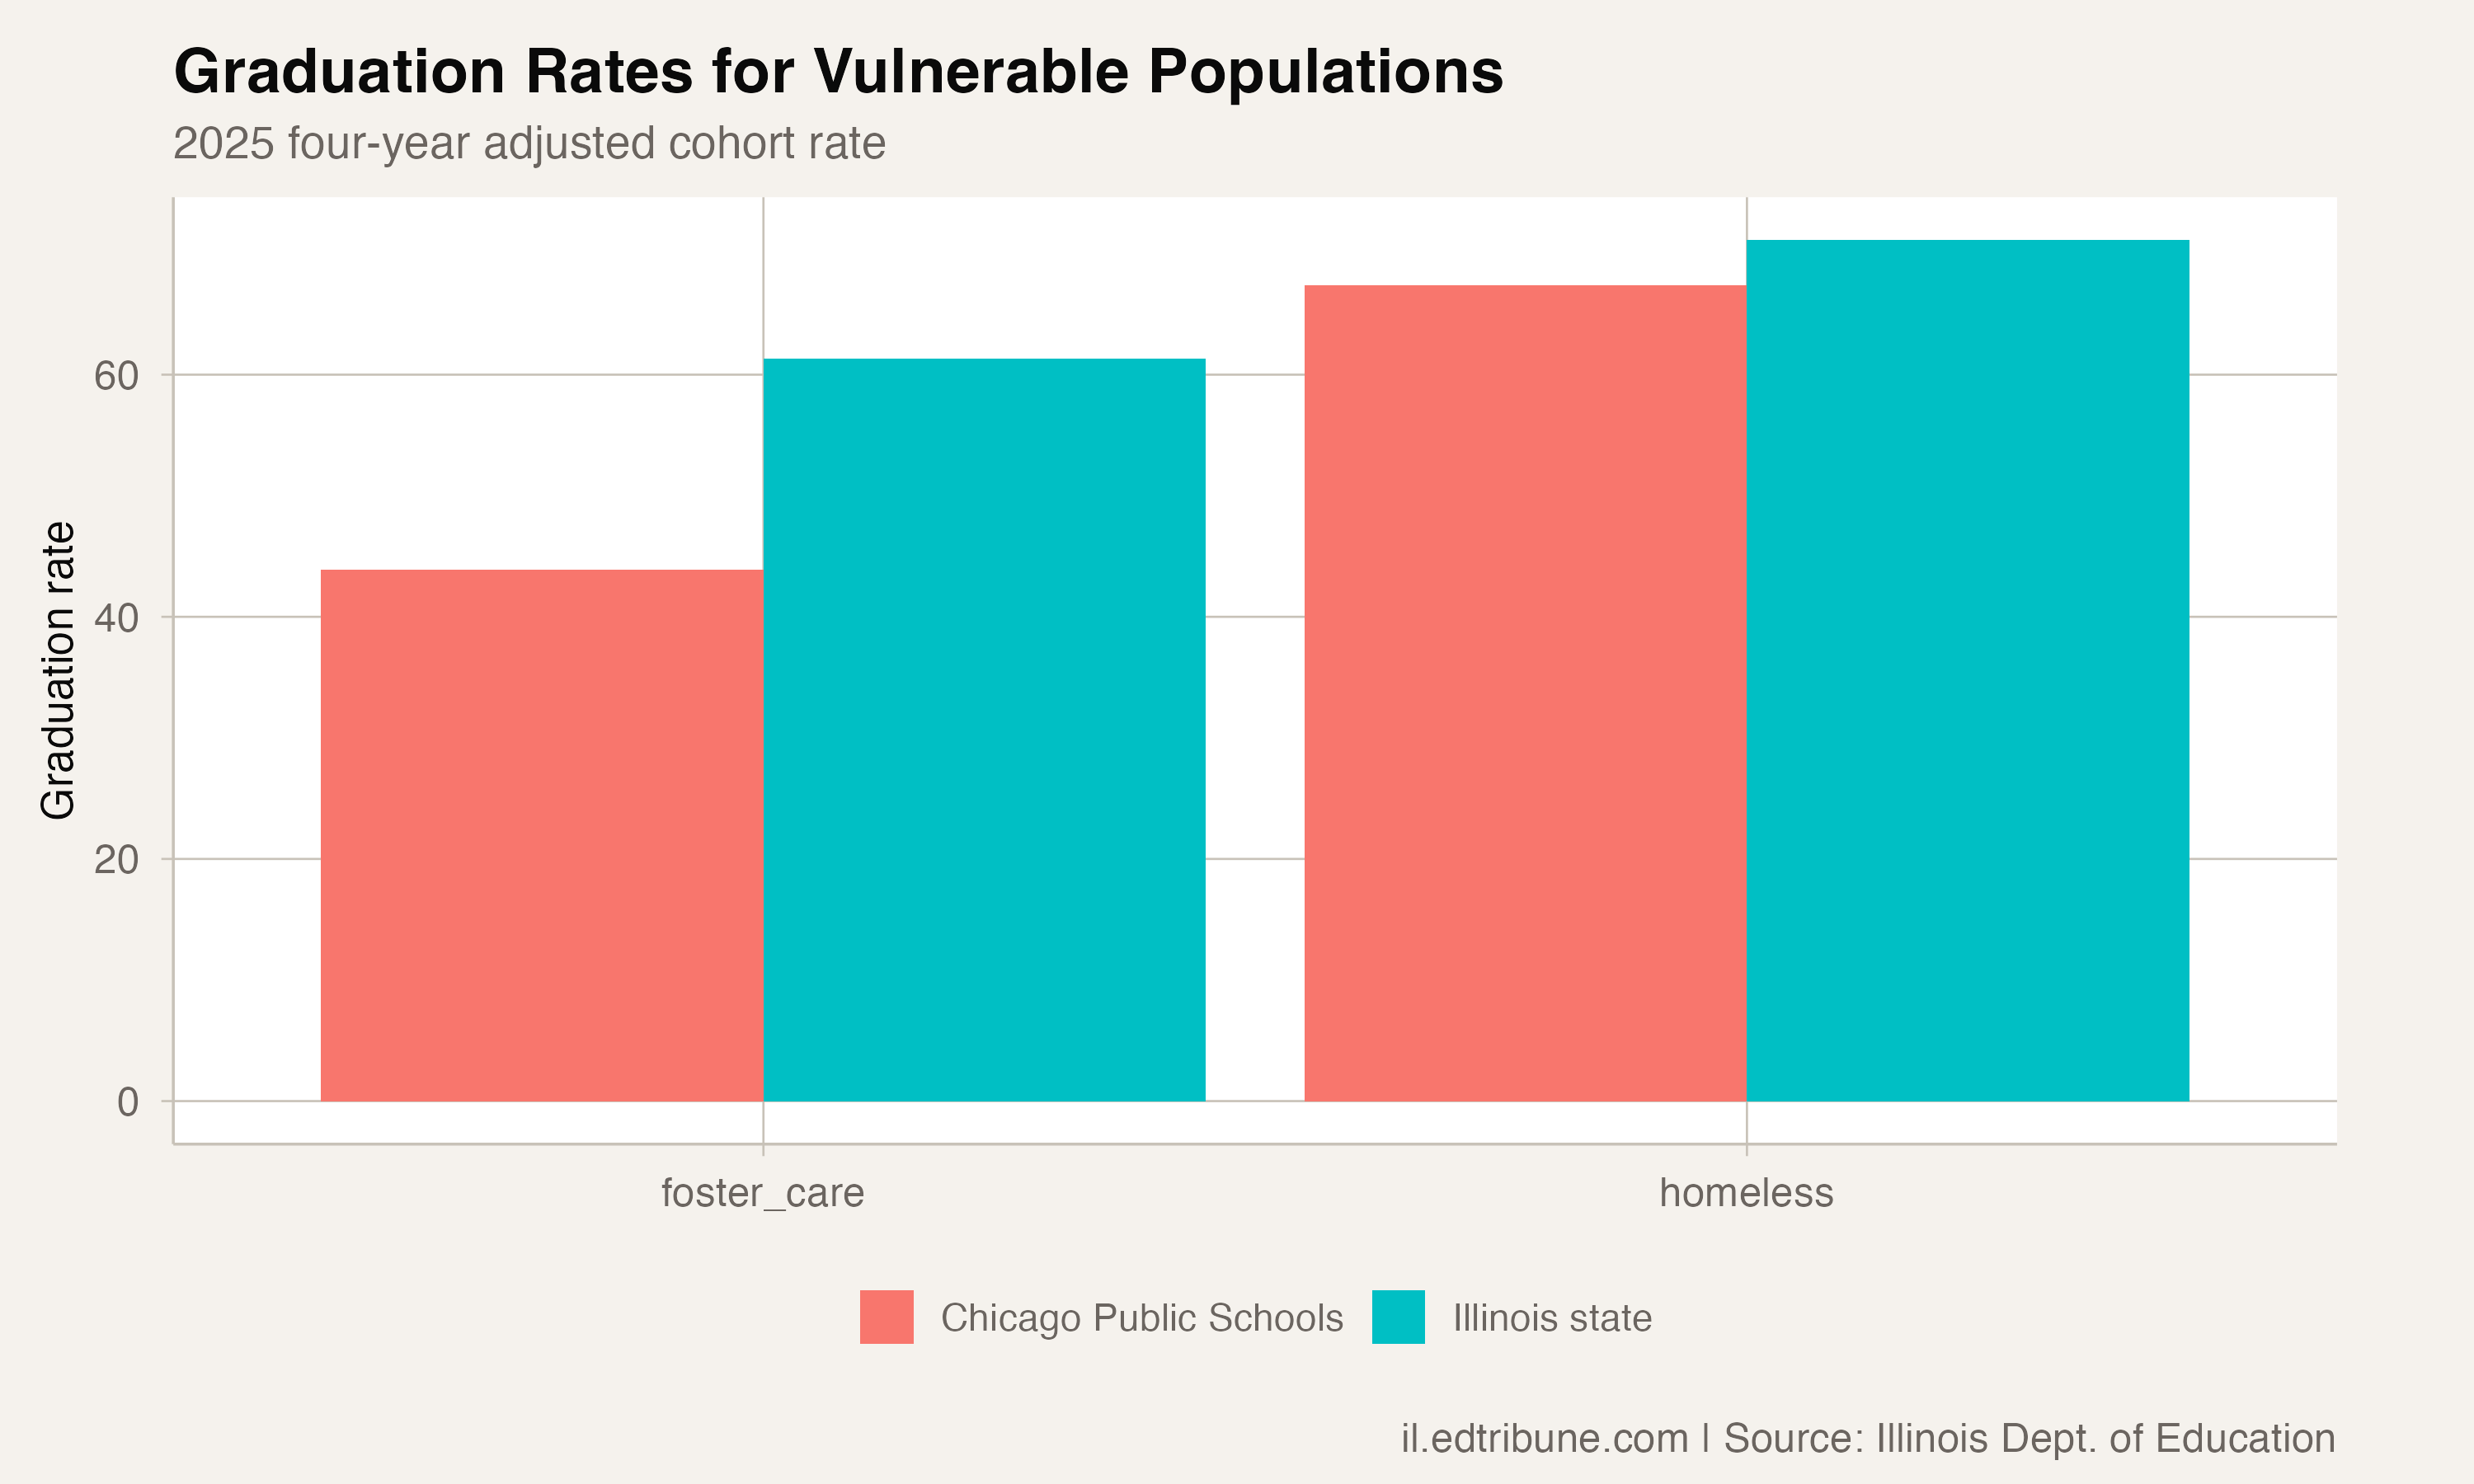
The concentration of foster care youth and students who are currently homeless in an urban district of 317,588 students creates compounding challenges. In 2025-26, 4.7% of CPS students were identified as currently homeless, against 2.5% statewide.
Progress from a lower baseline
CPS's 6-point improvement since 2019 looks smaller than some of the turnaround districts making headlines. Aurora East gained 23.9 points. Rockford gained 10.6. But those districts have graduating cohorts of about 1,000 and about 2,050 students. CPS's computed cohort proxy of 26,712 students is larger than the total enrollment of every Illinois district except three, including CPS itself and two others.
Moving a rate by 6 points when each point represents roughly 267 additional graduates is a different kind of achievement than doing it with a cohort of a thousand. The University of Chicago Consortium on School Research has documented CPS's focus on freshman-on-track indicators. That is suggestive context, not direct evidence that the practice caused this specific change.
What sits underneath the gap
The 6.5-point gap between CPS and the state sits on top of demographic differences the district does not control. In 2025-26, 69.0% of CPS students qualified for free or reduced-price lunch, against 47.5% statewide, and 27.9% were English learners, against 17.5%. CPS is 46.4% Hispanic and 34.1% Black. One measure runs the other way: 16.9% of CPS students have disabilities, essentially the same as the statewide 16.8%.
What the trend line shows is that the gap is closing: Illinois' rate rose 2.8 points between 2019 and 2025, from 86.2% to 89.0%, while CPS rose 6.0 points over the same years. The distance between them narrowed from 9.7 points in 2019 to 6.5 points in 2025.
Data source: Illinois State Board of Education. Analysis covers the four-year adjusted cohort graduation rate for public school districts, 2019-2025.
Detailed code that reproduces the analysis and figures in this article is available exclusively to EdTribune subscribers.
Discussion
Sign in to join the discussion.
Loading comments...