Source: Illinois State Board of Education Report Card data. The 2025 graduation and ninth-grade-on-track figures cover 2024-25, the most recent published year available in those series; they are not 2026-27 results.
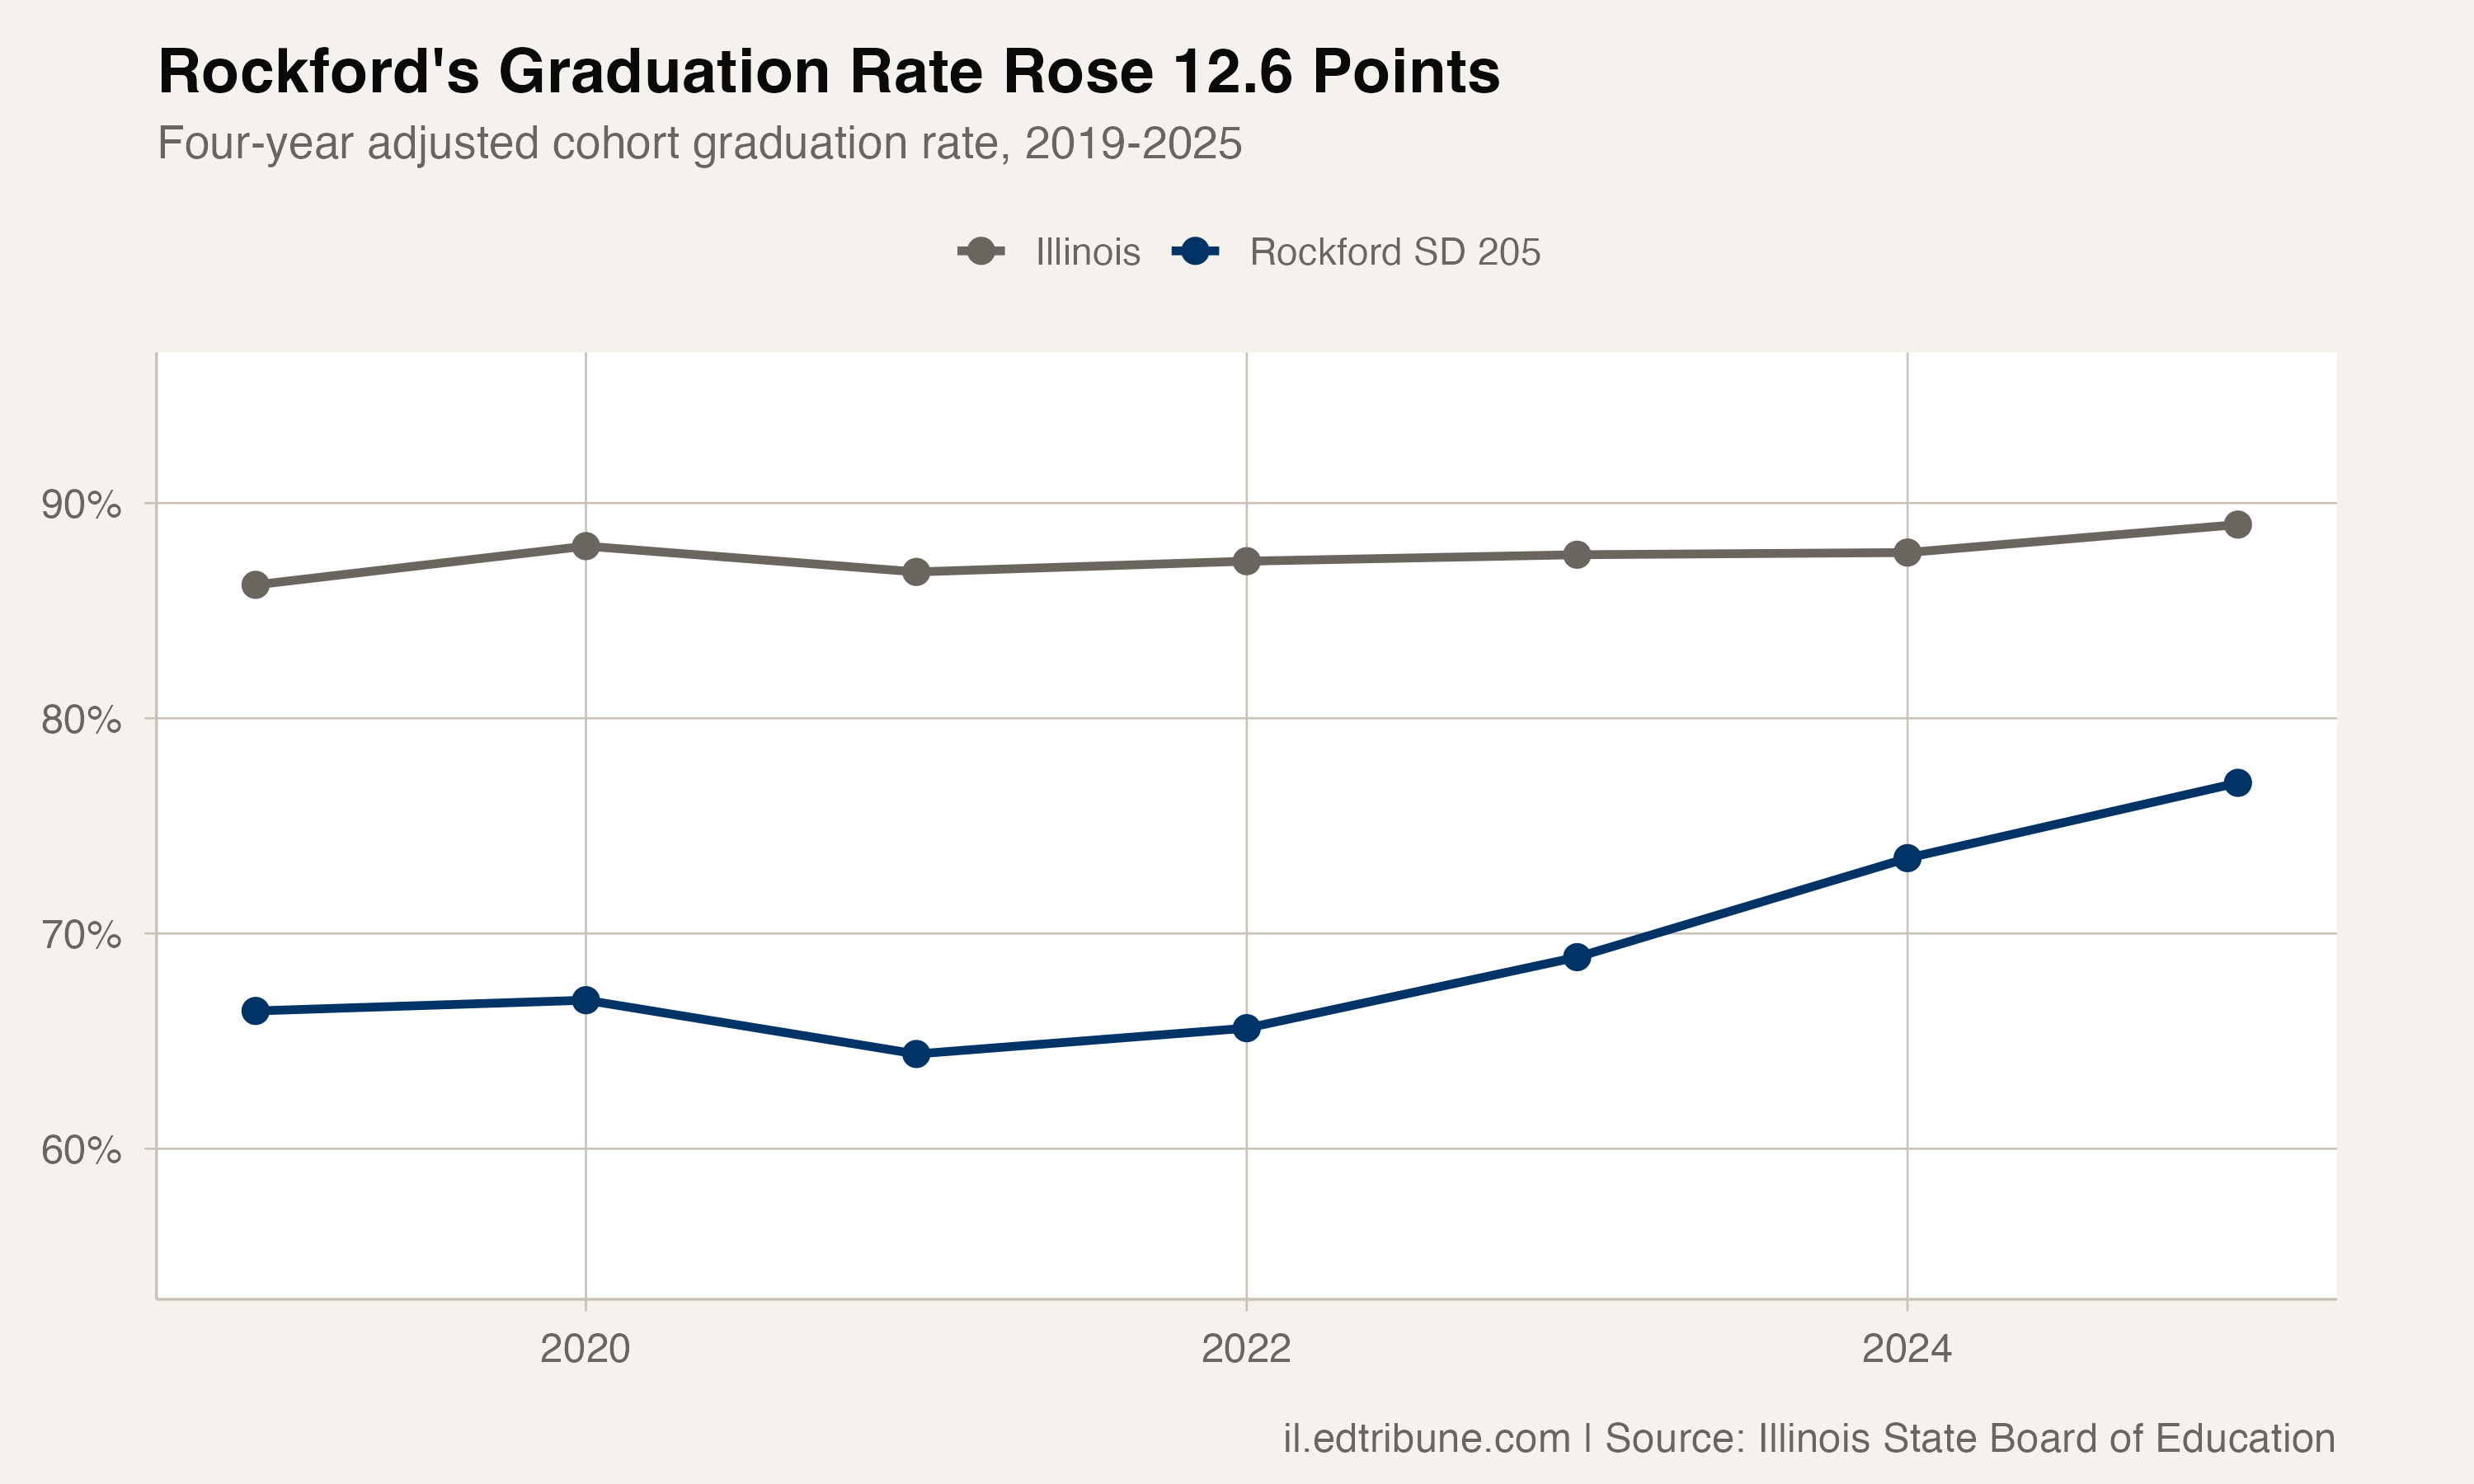
Rockford SD 205↗ET reported 28,692 students in the state's 2025-26 data. Its four-year graduation rate rose from 64.4% in 2021 to 77.0% in 2025, a 12.6-point gain.
Across the 19 Illinois districts with more than 10,000 students in 2025-26 and published four-year rates in both 2021 and 2025, the maximum increase was Rockford's 12.6 points. The next value was 10.0 points, 2.6 points lower.
The streak
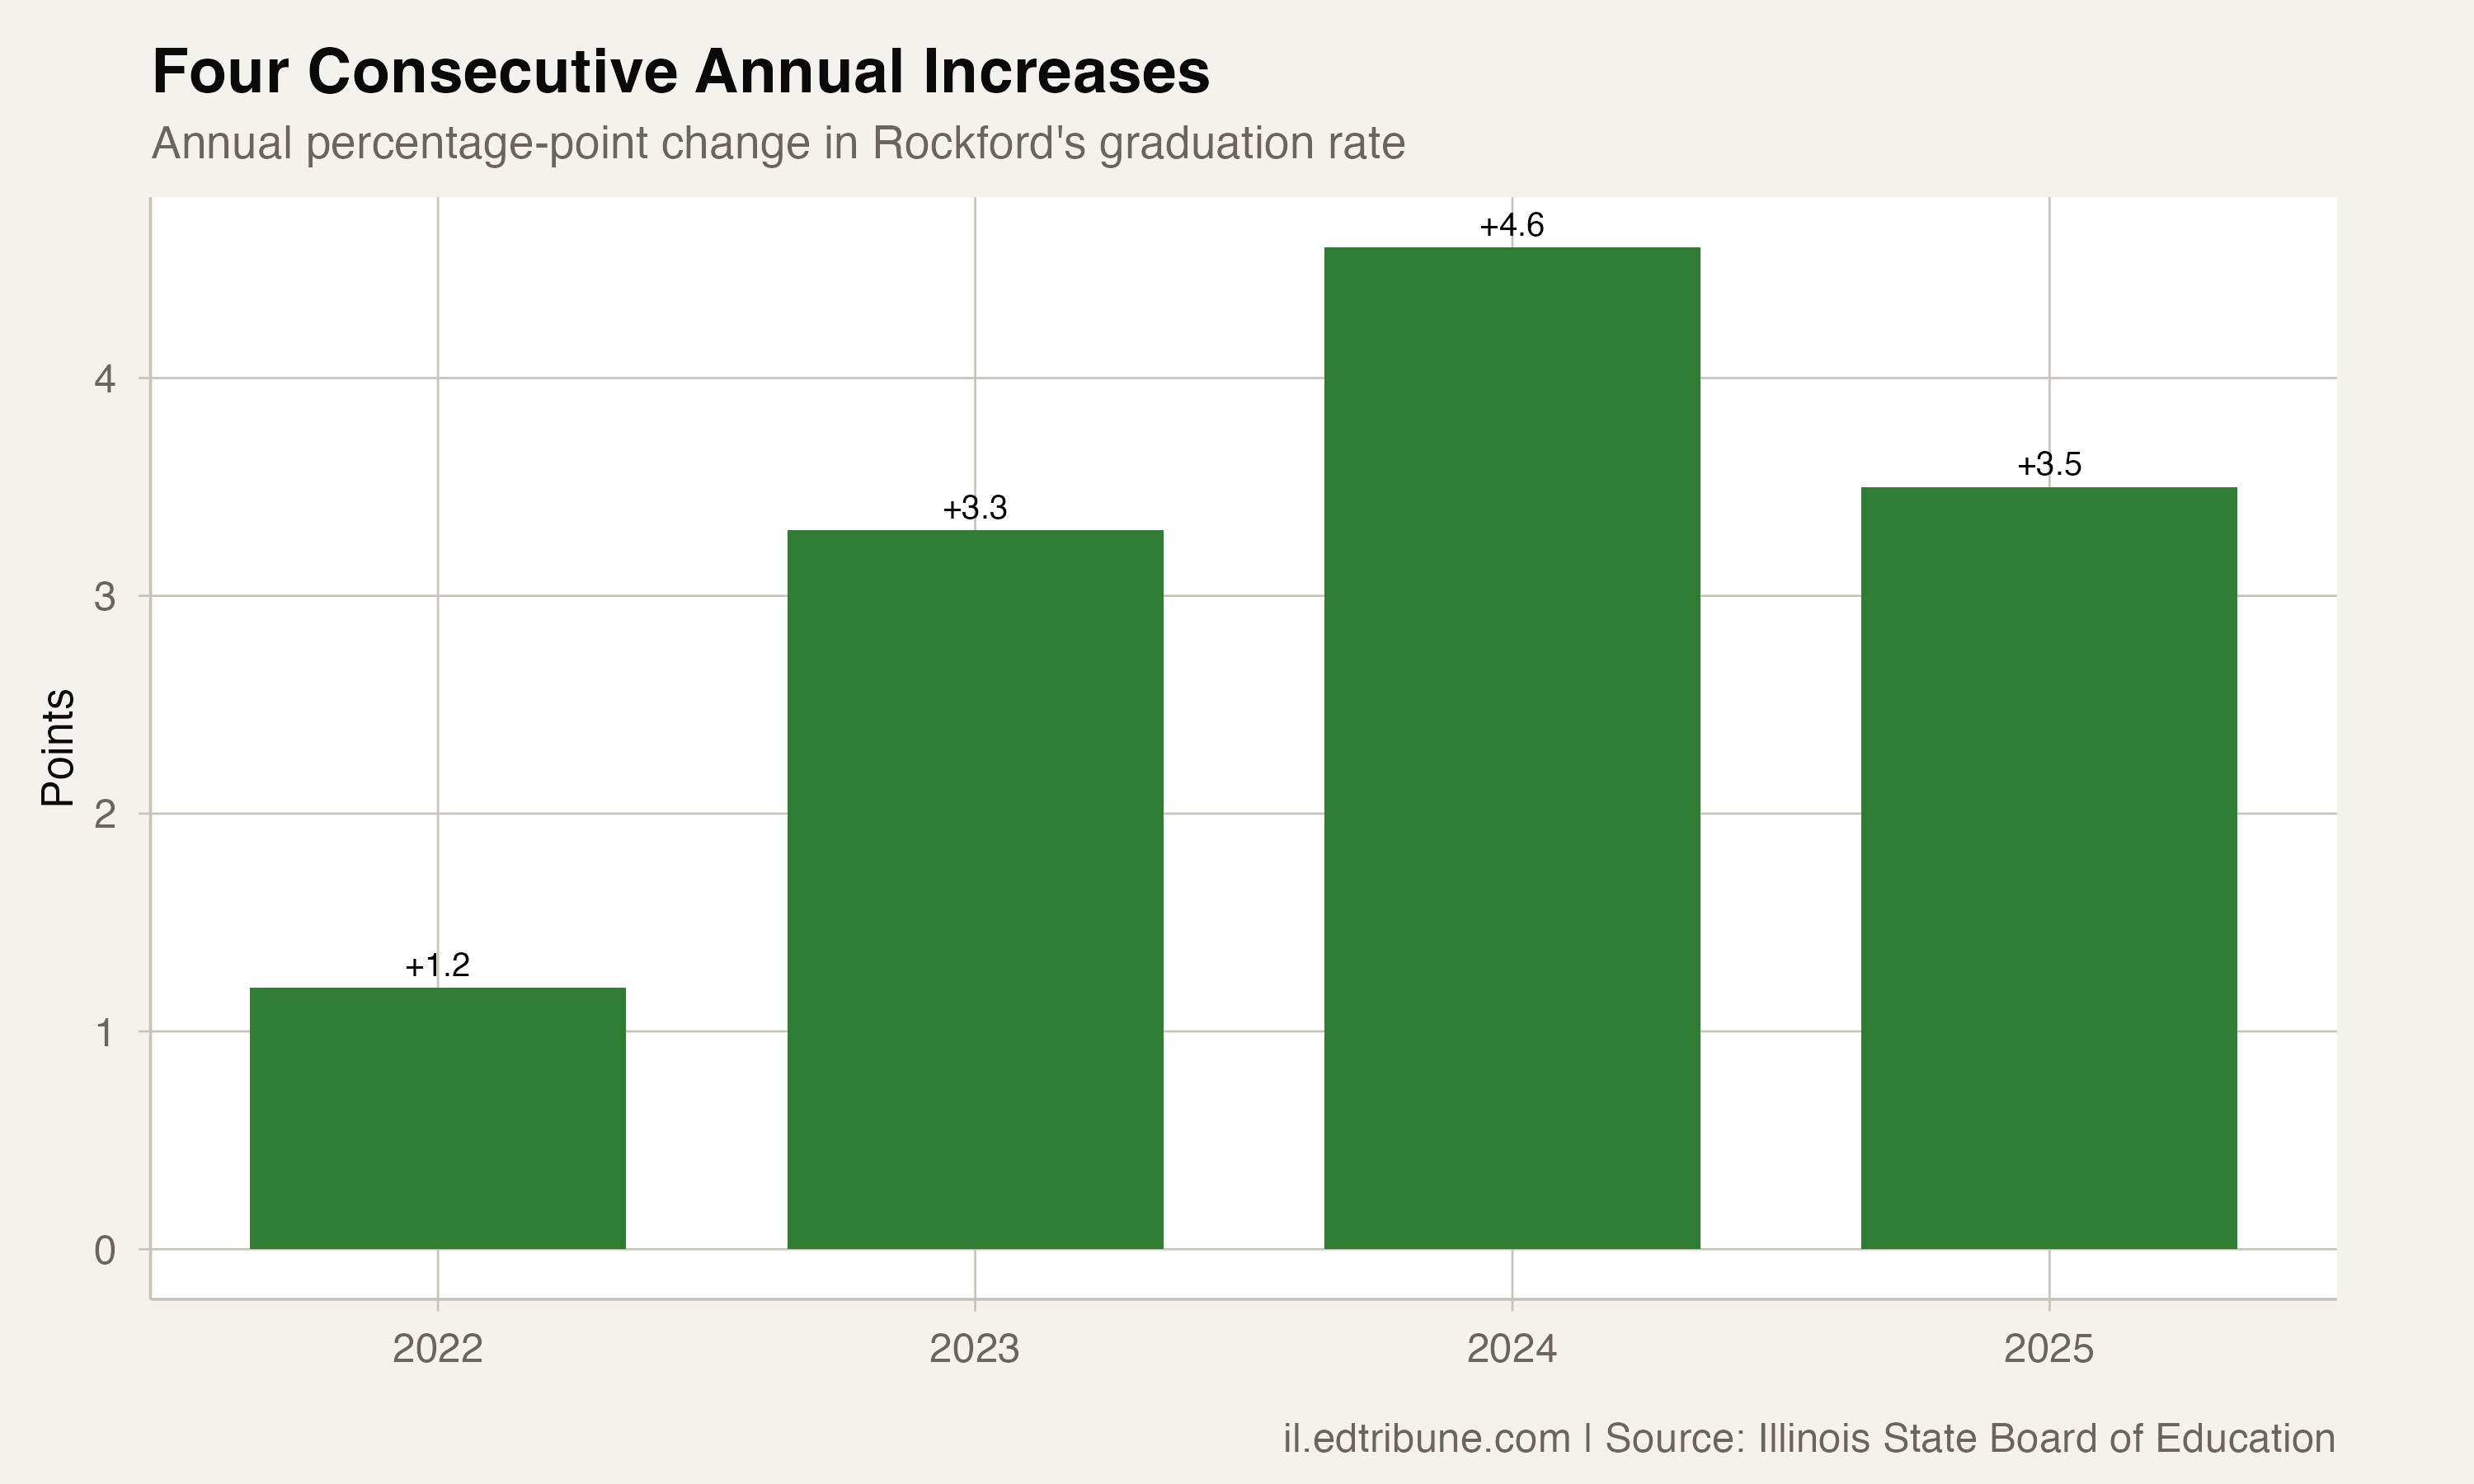
The minimum in Rockford's comparable seven-year series was 64.4% in 2021. The annual rates and changes after that were:
- 2022: 65.6% (+1.2)
- 2023: 68.9% (+3.3)
- 2024: 73.5% (+4.6)
- 2025: 77.0% (+3.5)
The freshman-on-track indicator
Rockford's ninth-grade-on-track rate rose from 67.6% in 2021 to 79.0% in 2025. Its gap with the statewide rate narrowed from 14.6 points to 10.3 points.
District and subgroup gaps
In 2025, Rockford's 77.0% four-year rate was 12.0 points below Illinois's 89.0% rate. Within Rockford, white students graduated at 80.3% and Hispanic students at 81.1%, while Black students graduated at 68.8% and economically disadvantaged students at 72.1%.
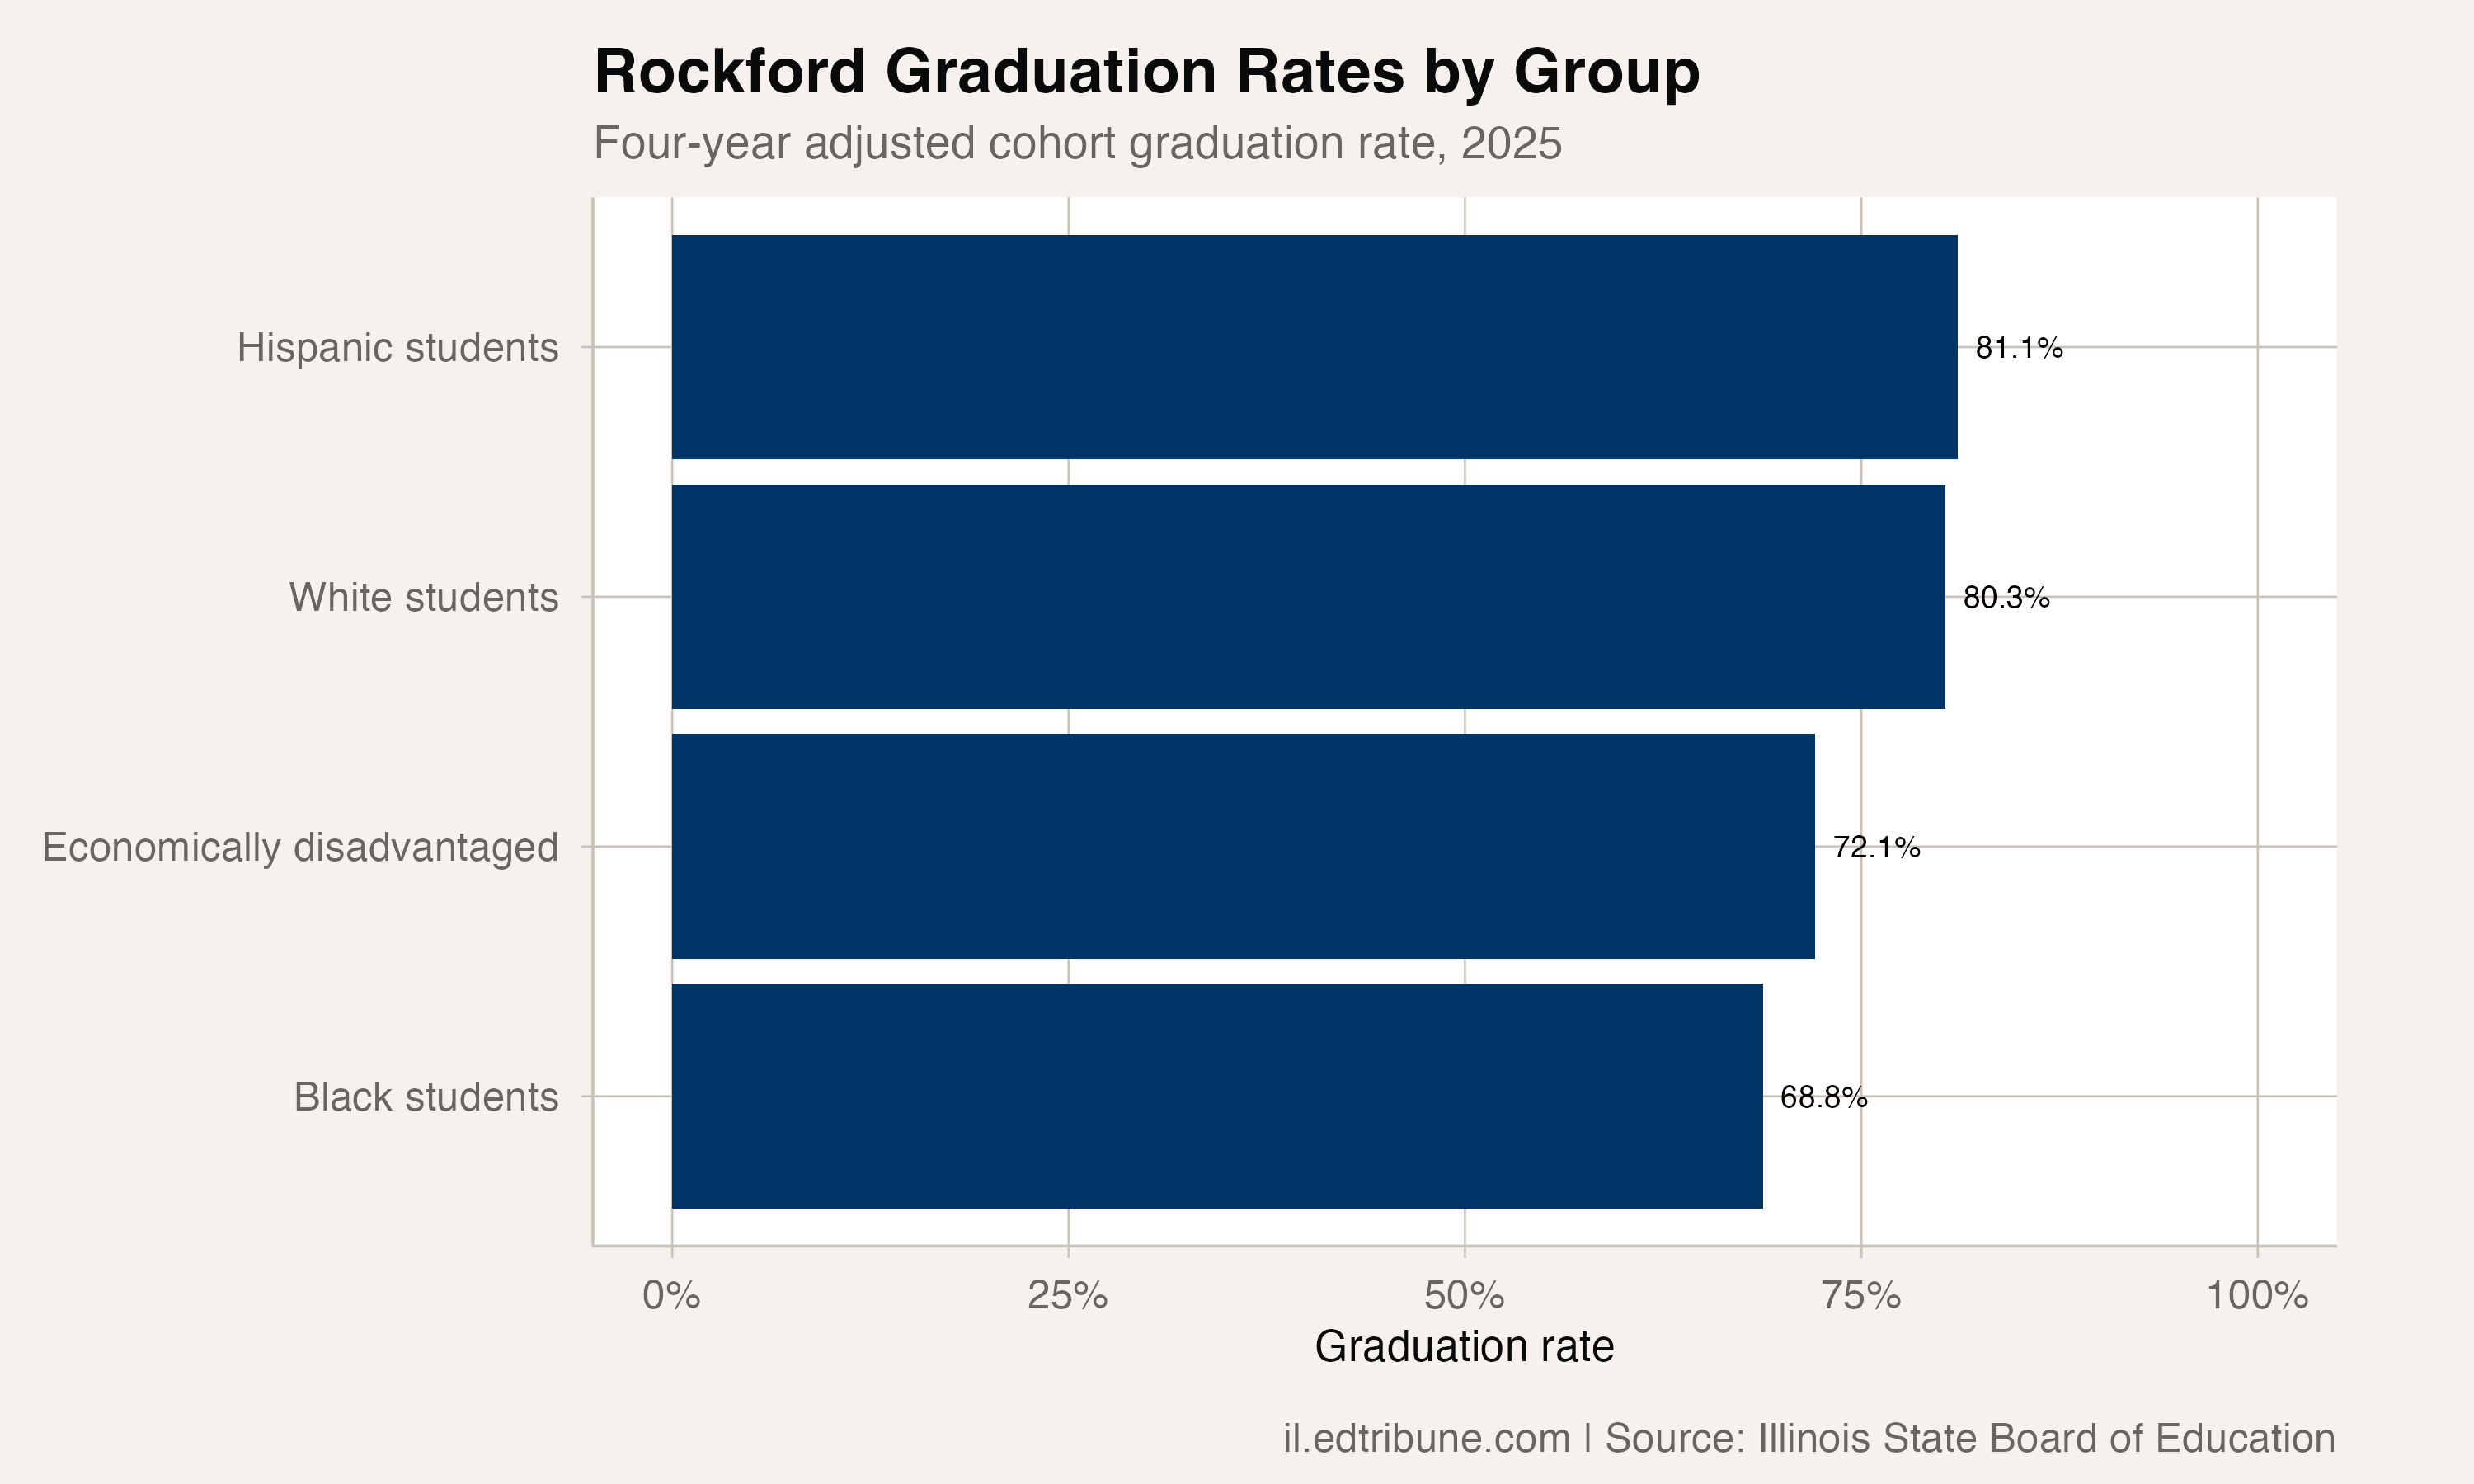
The 11.5-point gap between white and Black students in Rockford was 2.0 points wider than the statewide gap of 9.5 points.
Illinois's overall four-year rate rose from 86.8% in 2021 to 89.0% in 2025, a 2.2-point gain. Rockford's 12.6-point gain over the same period was 10.4 points larger, reducing its gap with the state from 22.4 points to 12.0 points.
Detailed code that reproduces the analysis and figures in this article is available exclusively to EdTribune subscribers.
Discussion
Sign in to join the discussion.
Loading comments...