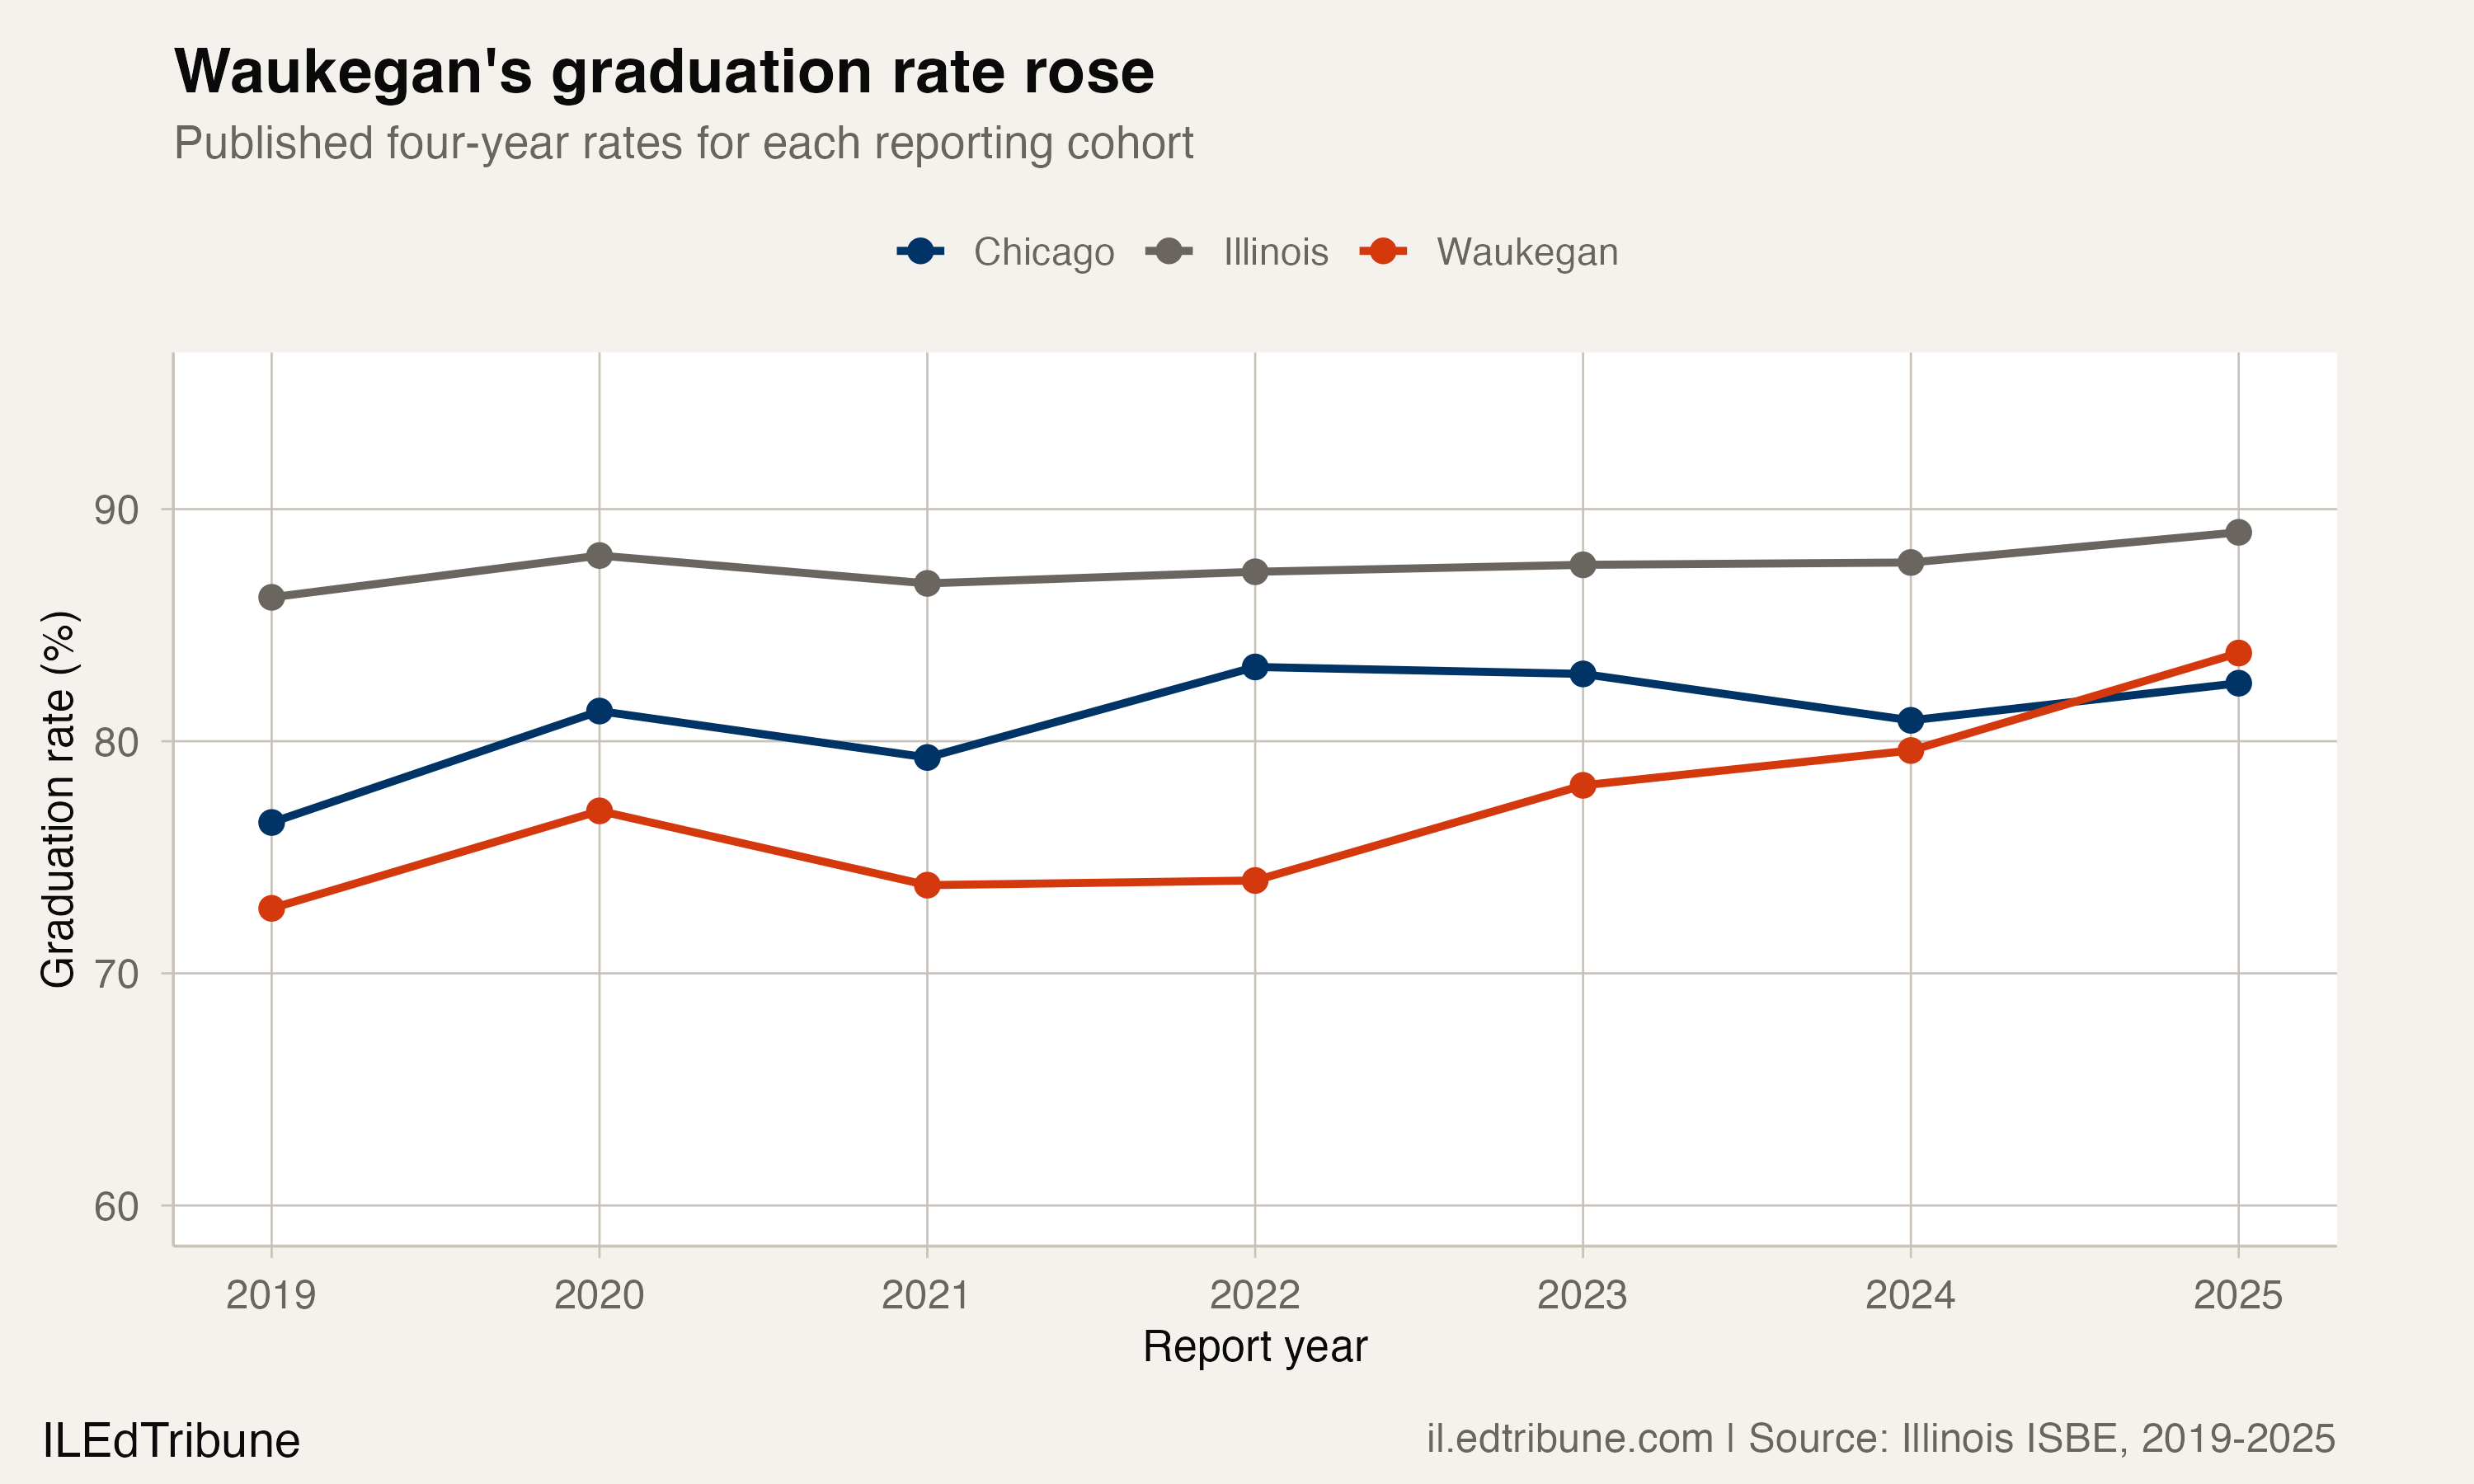
Waukegan CUSD 60↗ET raised its published four-year graduation rate from 74.0% in the 2022 report to 83.8% in 2025, a 9.8 percentage-point gain. The improvement brought Waukegan above Chicago Public Schools District 299↗ET, whose corresponding 2025 rate was 82.5%.
The comparison comes from the most recent published Illinois Report Card graduation data available in this analysis. It describes earlier graduating cohorts rather than current students' outcomes. Waukegan still trailed Illinois' 89.0% statewide rate in the 2025 report.
Four annual gains, across five reporting years
Waukegan's rate was 72.8% in 2019, rose to 77.0% in 2020 and then fell to 73.8% in 2021. The latter is the starting point for its uninterrupted run of subsequent annual gains, not evidence that the full earlier history moved steadily upward.
The rate reached 74.0% in 2022, 78.1% in 2023, 79.6% in 2024 and 83.8% in 2025. That is four consecutive annual increases from 2021 through 2025, across five reporting years. The narrower 2022-to-2025 comparison covers three annual transitions.
The final annual increase was 4.2 points, larger than the preceding year's increase. Different students enter each graduating cohort, so the rate series cannot establish how many individual students benefited from a particular program. The state's available records do not supply the cohort counts needed to assess the size of these groups.
The statewide gap became smaller
Waukegan's gap with the state was 13.3 points in 2022 and 5.2 points in 2025. It narrowed by 8.1 points while the state rate also rose. That is a stronger result than a district gaining ground only because the comparison rate fell.
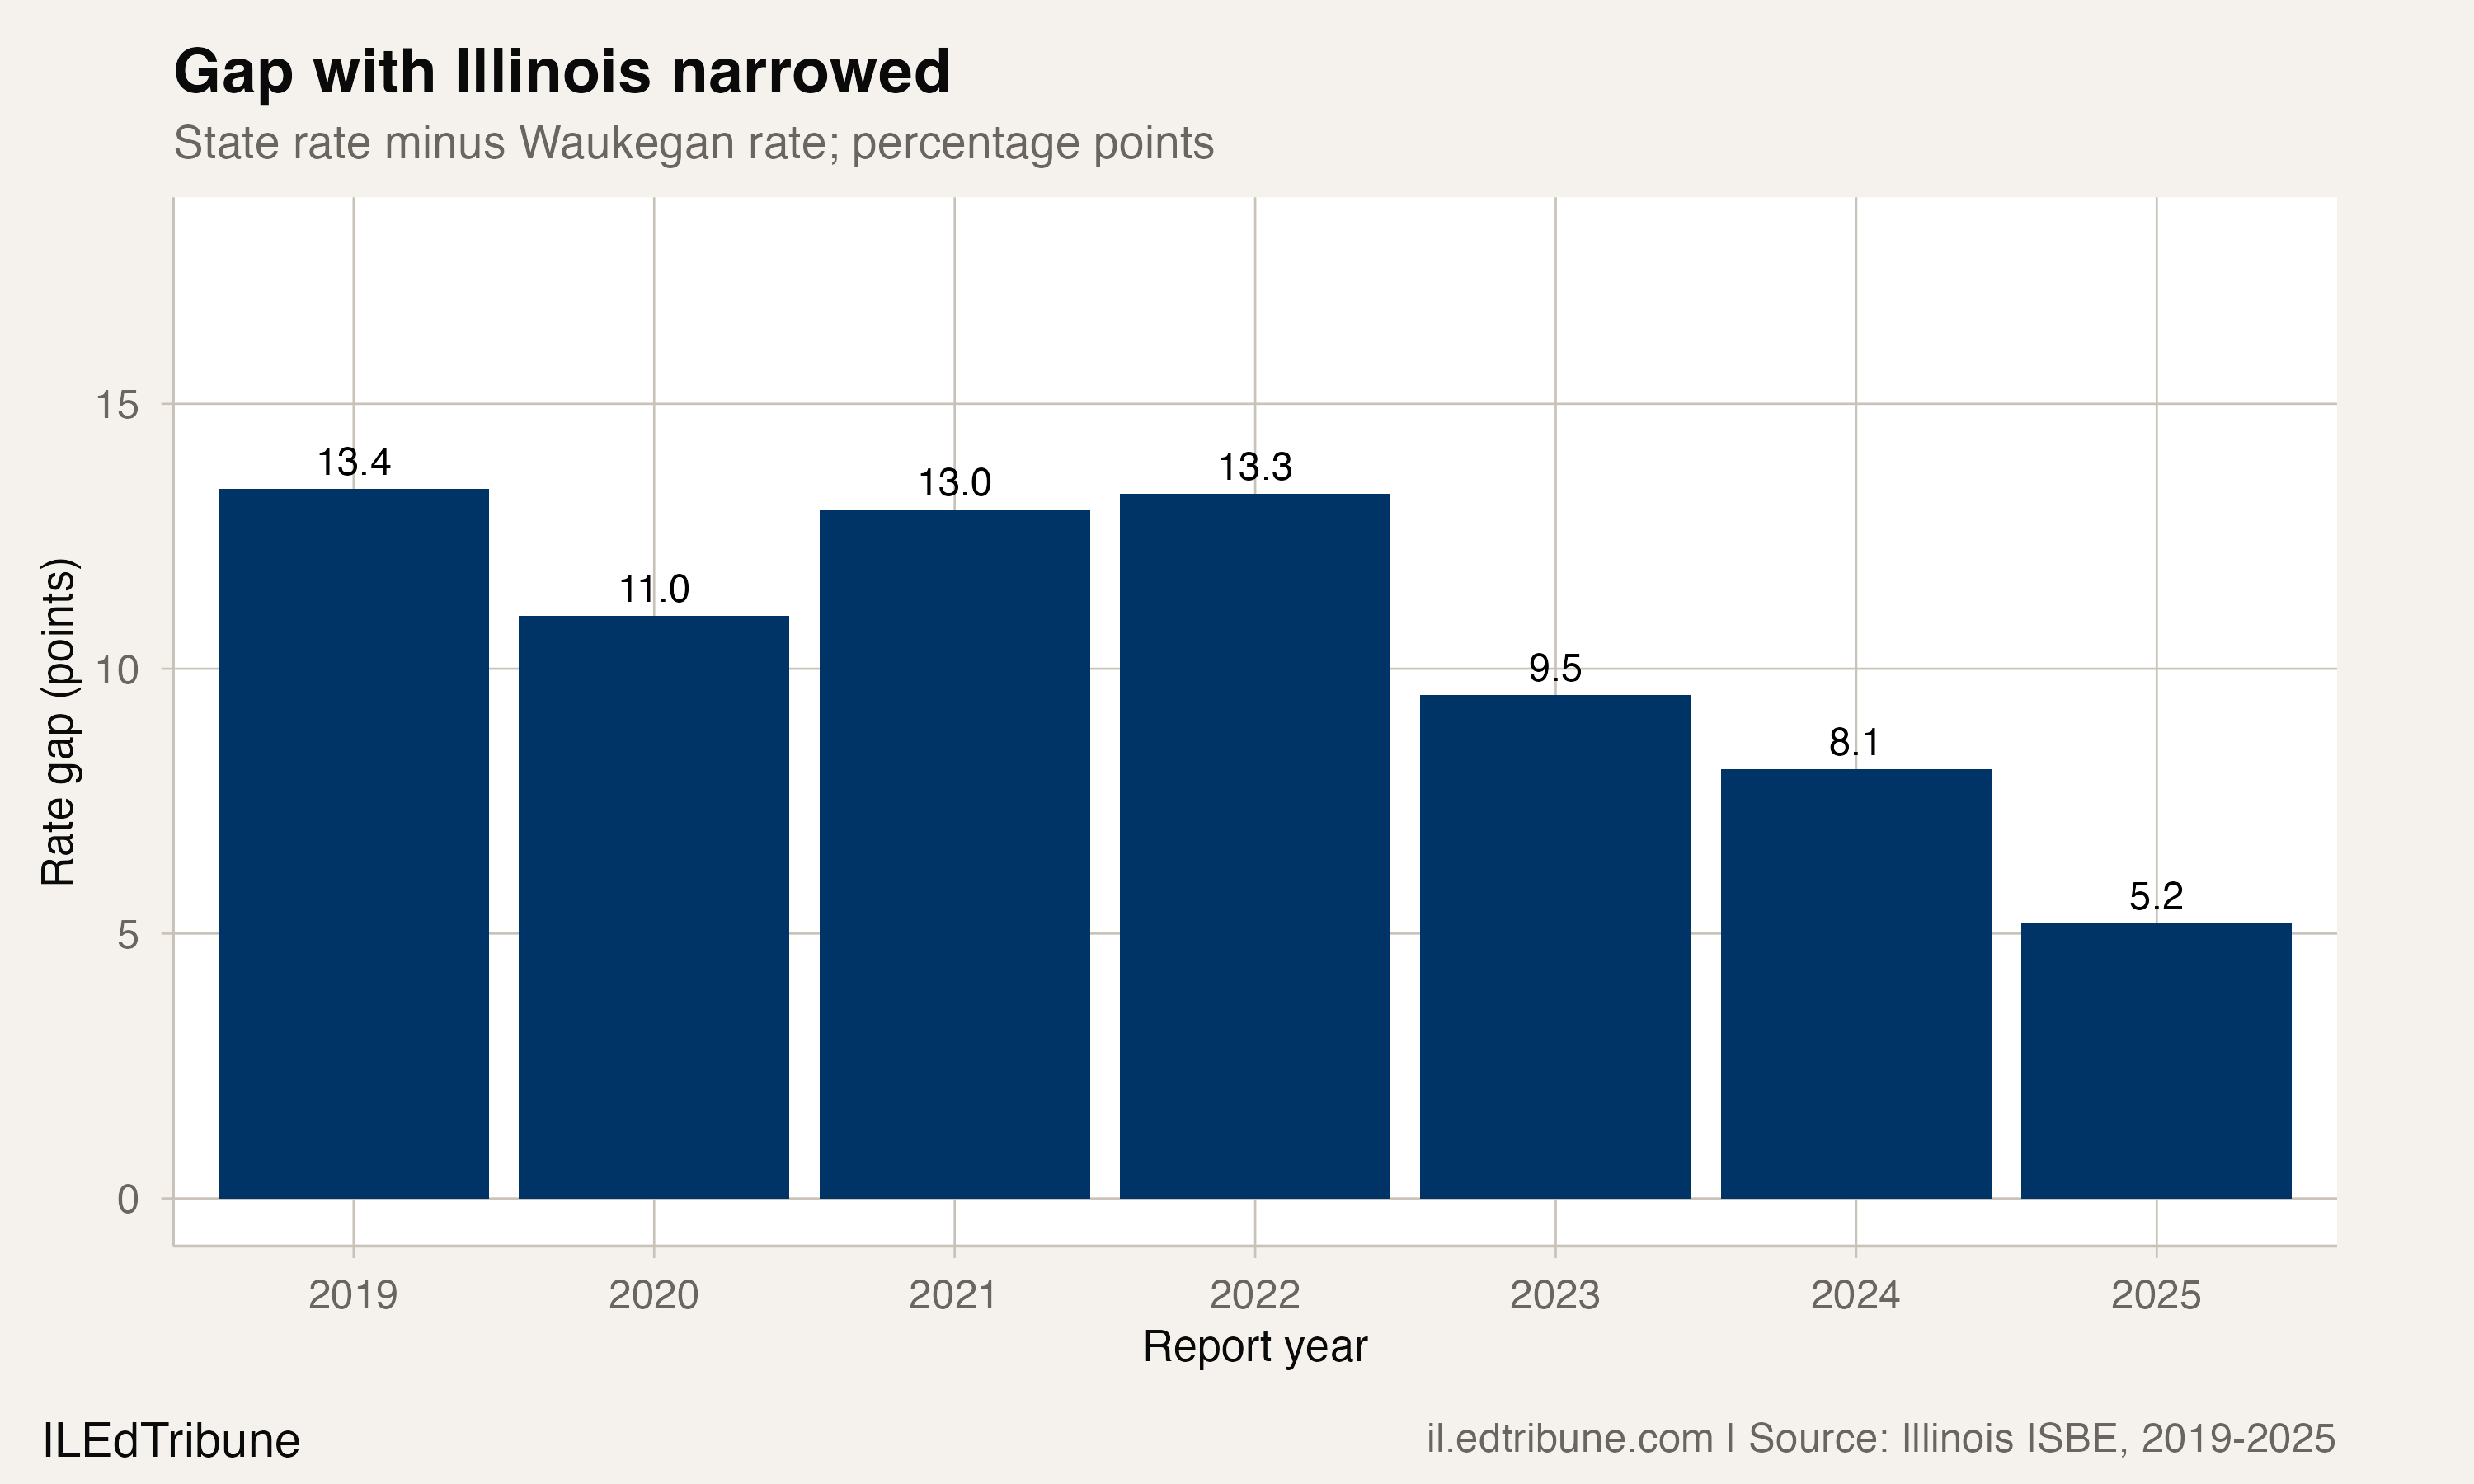
The remaining difference is a measured gap between published rates. It does not establish that future improvements will be easier or harder, or identify which students account for the difference. Those questions require more detailed reporting than these aggregate results provide.
Nearby comparisons are not a shared explanation
Selected Illinois districts show why a statewide “turnaround wave” is too broad a description. Aurora East, Rockford, East St. Louis and Kankakee all have visible changes in their published graduation rates, but their paths differ. A comparison chart can show those paths without assuming the districts used the same strategy.
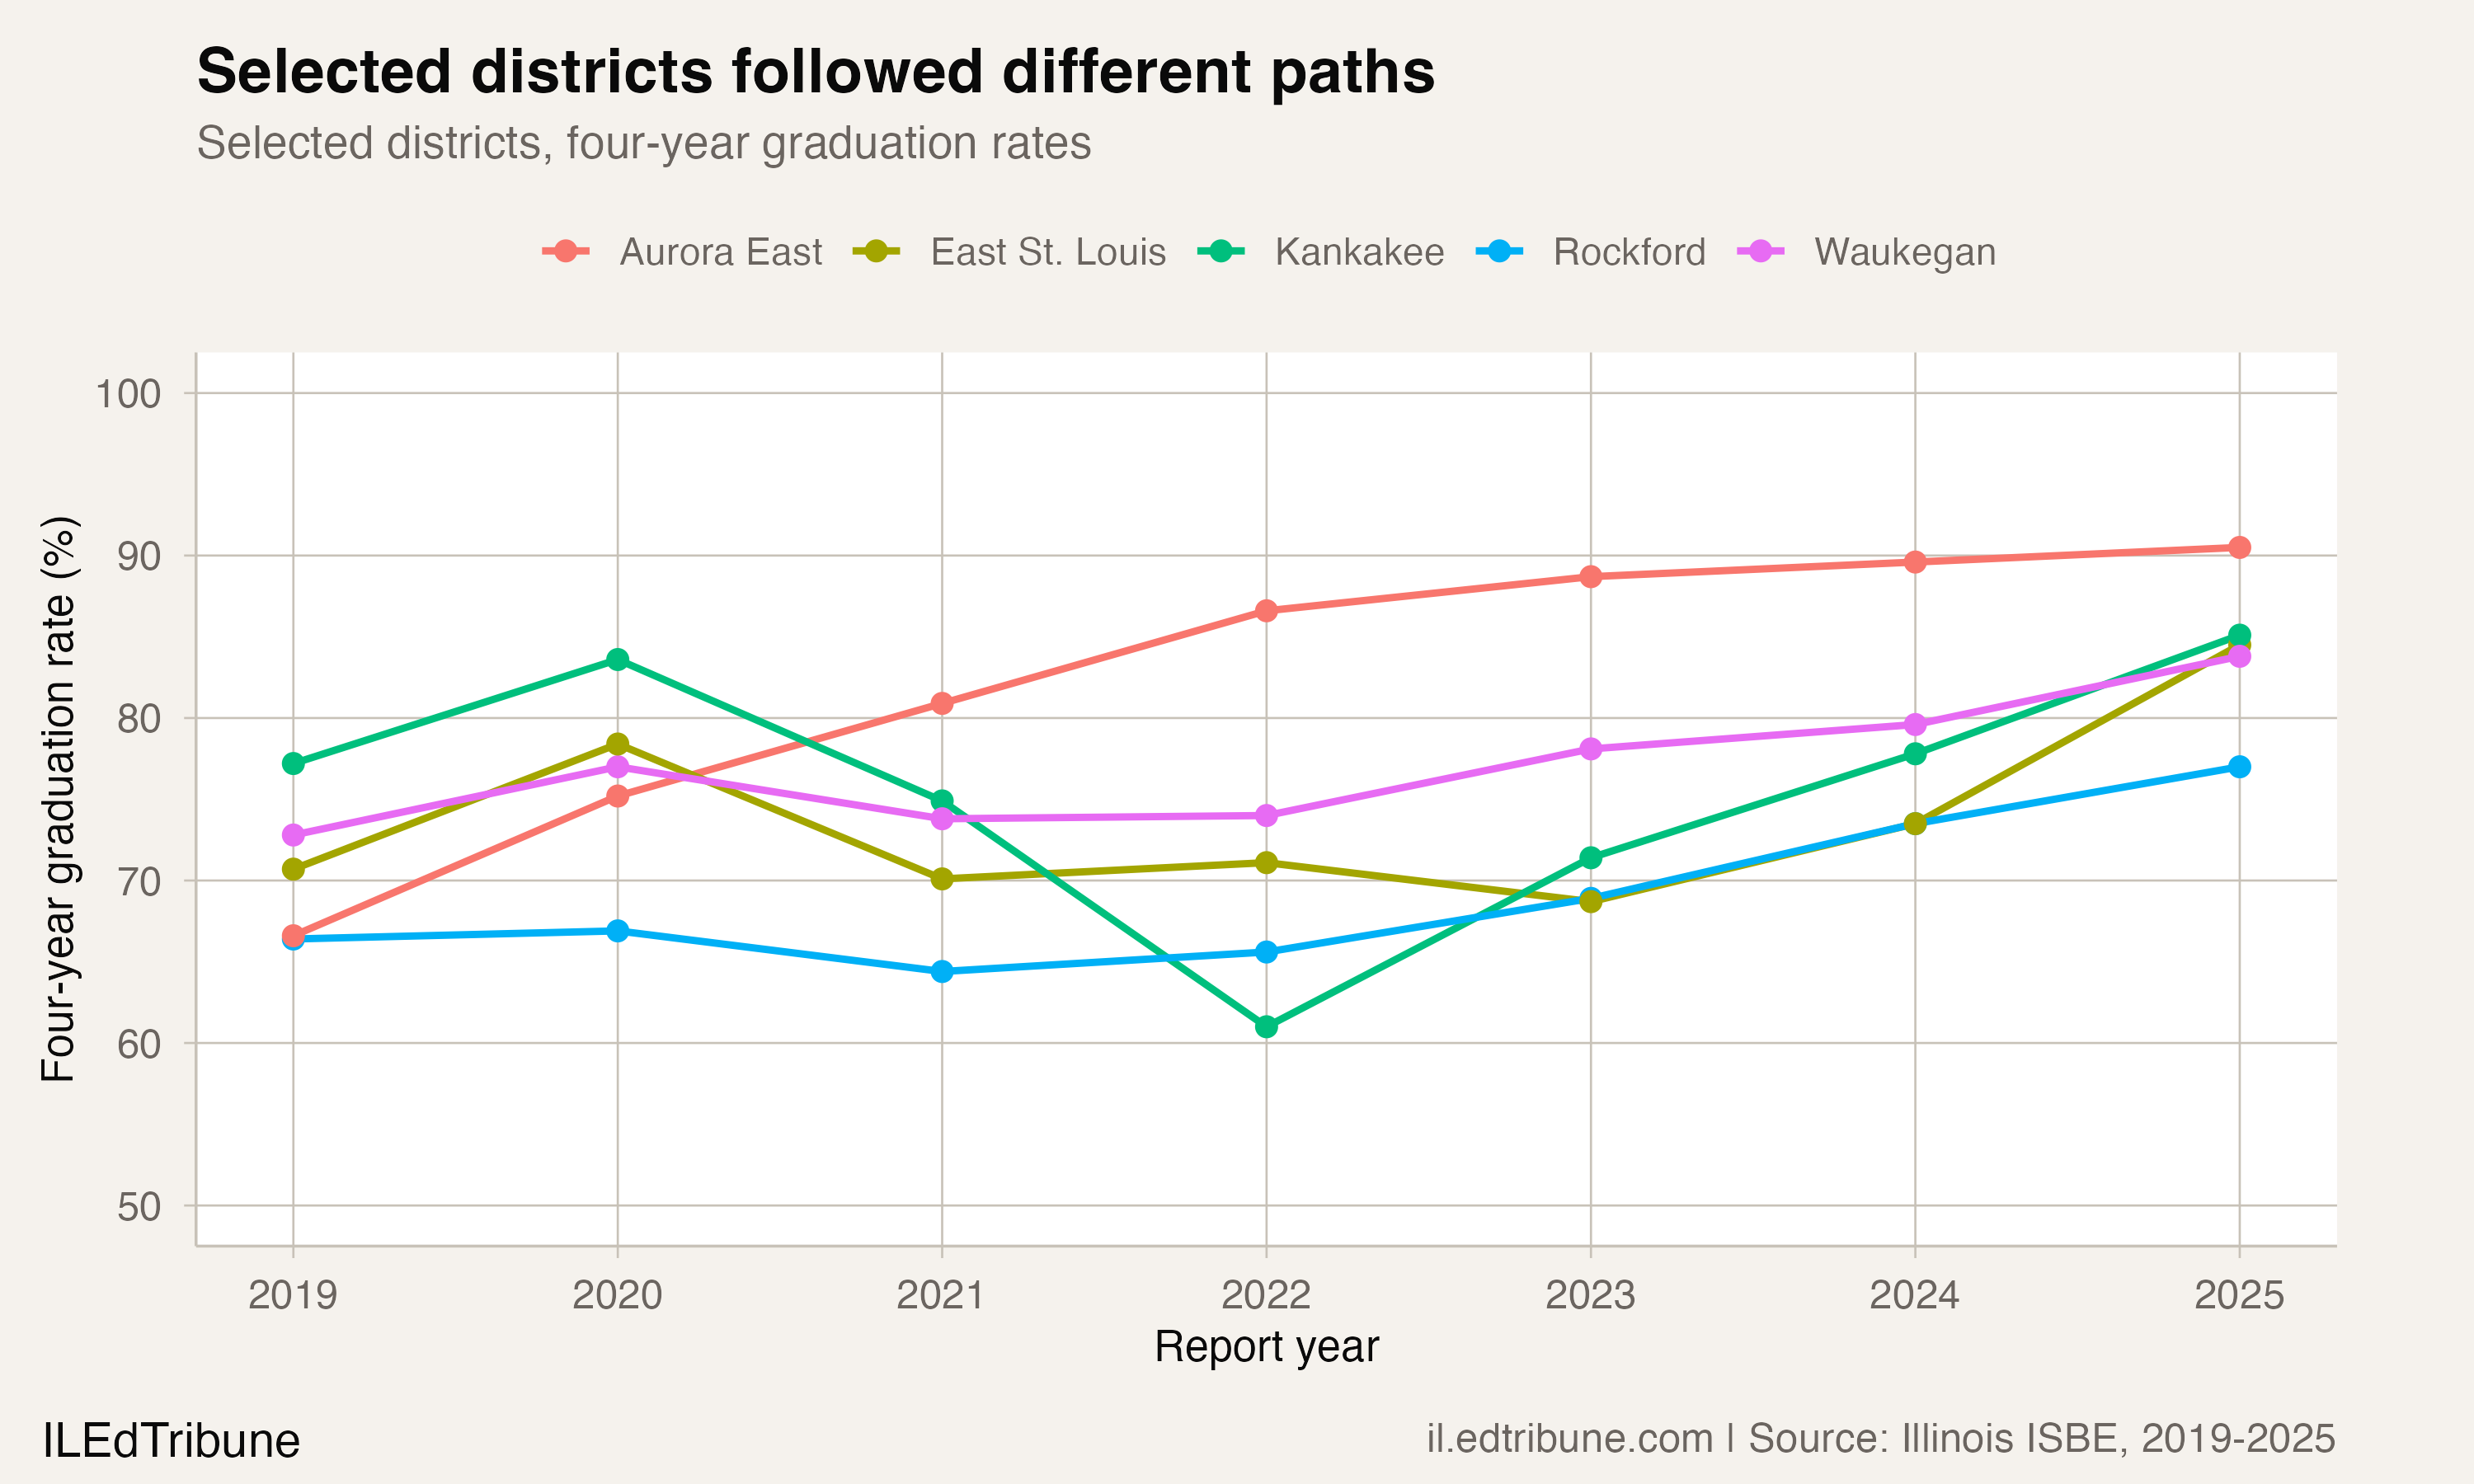
The graduation files do not record whether early-warning systems, credit recovery or counseling caused a district's change. They also cannot establish that an increase reached every student group. Those explanations need evidence from district practice and subgroup results, rather than an inference from a rising district average.
Waukegan's published record supports a clear, bounded conclusion: consecutive gains through the 2025 report, a rate above Chicago's at that endpoint and a smaller gap with Illinois. The next useful reporting question is which practices district leaders can document behind that improvement.
Detailed code that reproduces the analysis and figures in this article is available exclusively to EdTribune subscribers.
Discussion
Sign in to join the discussion.
Loading comments...