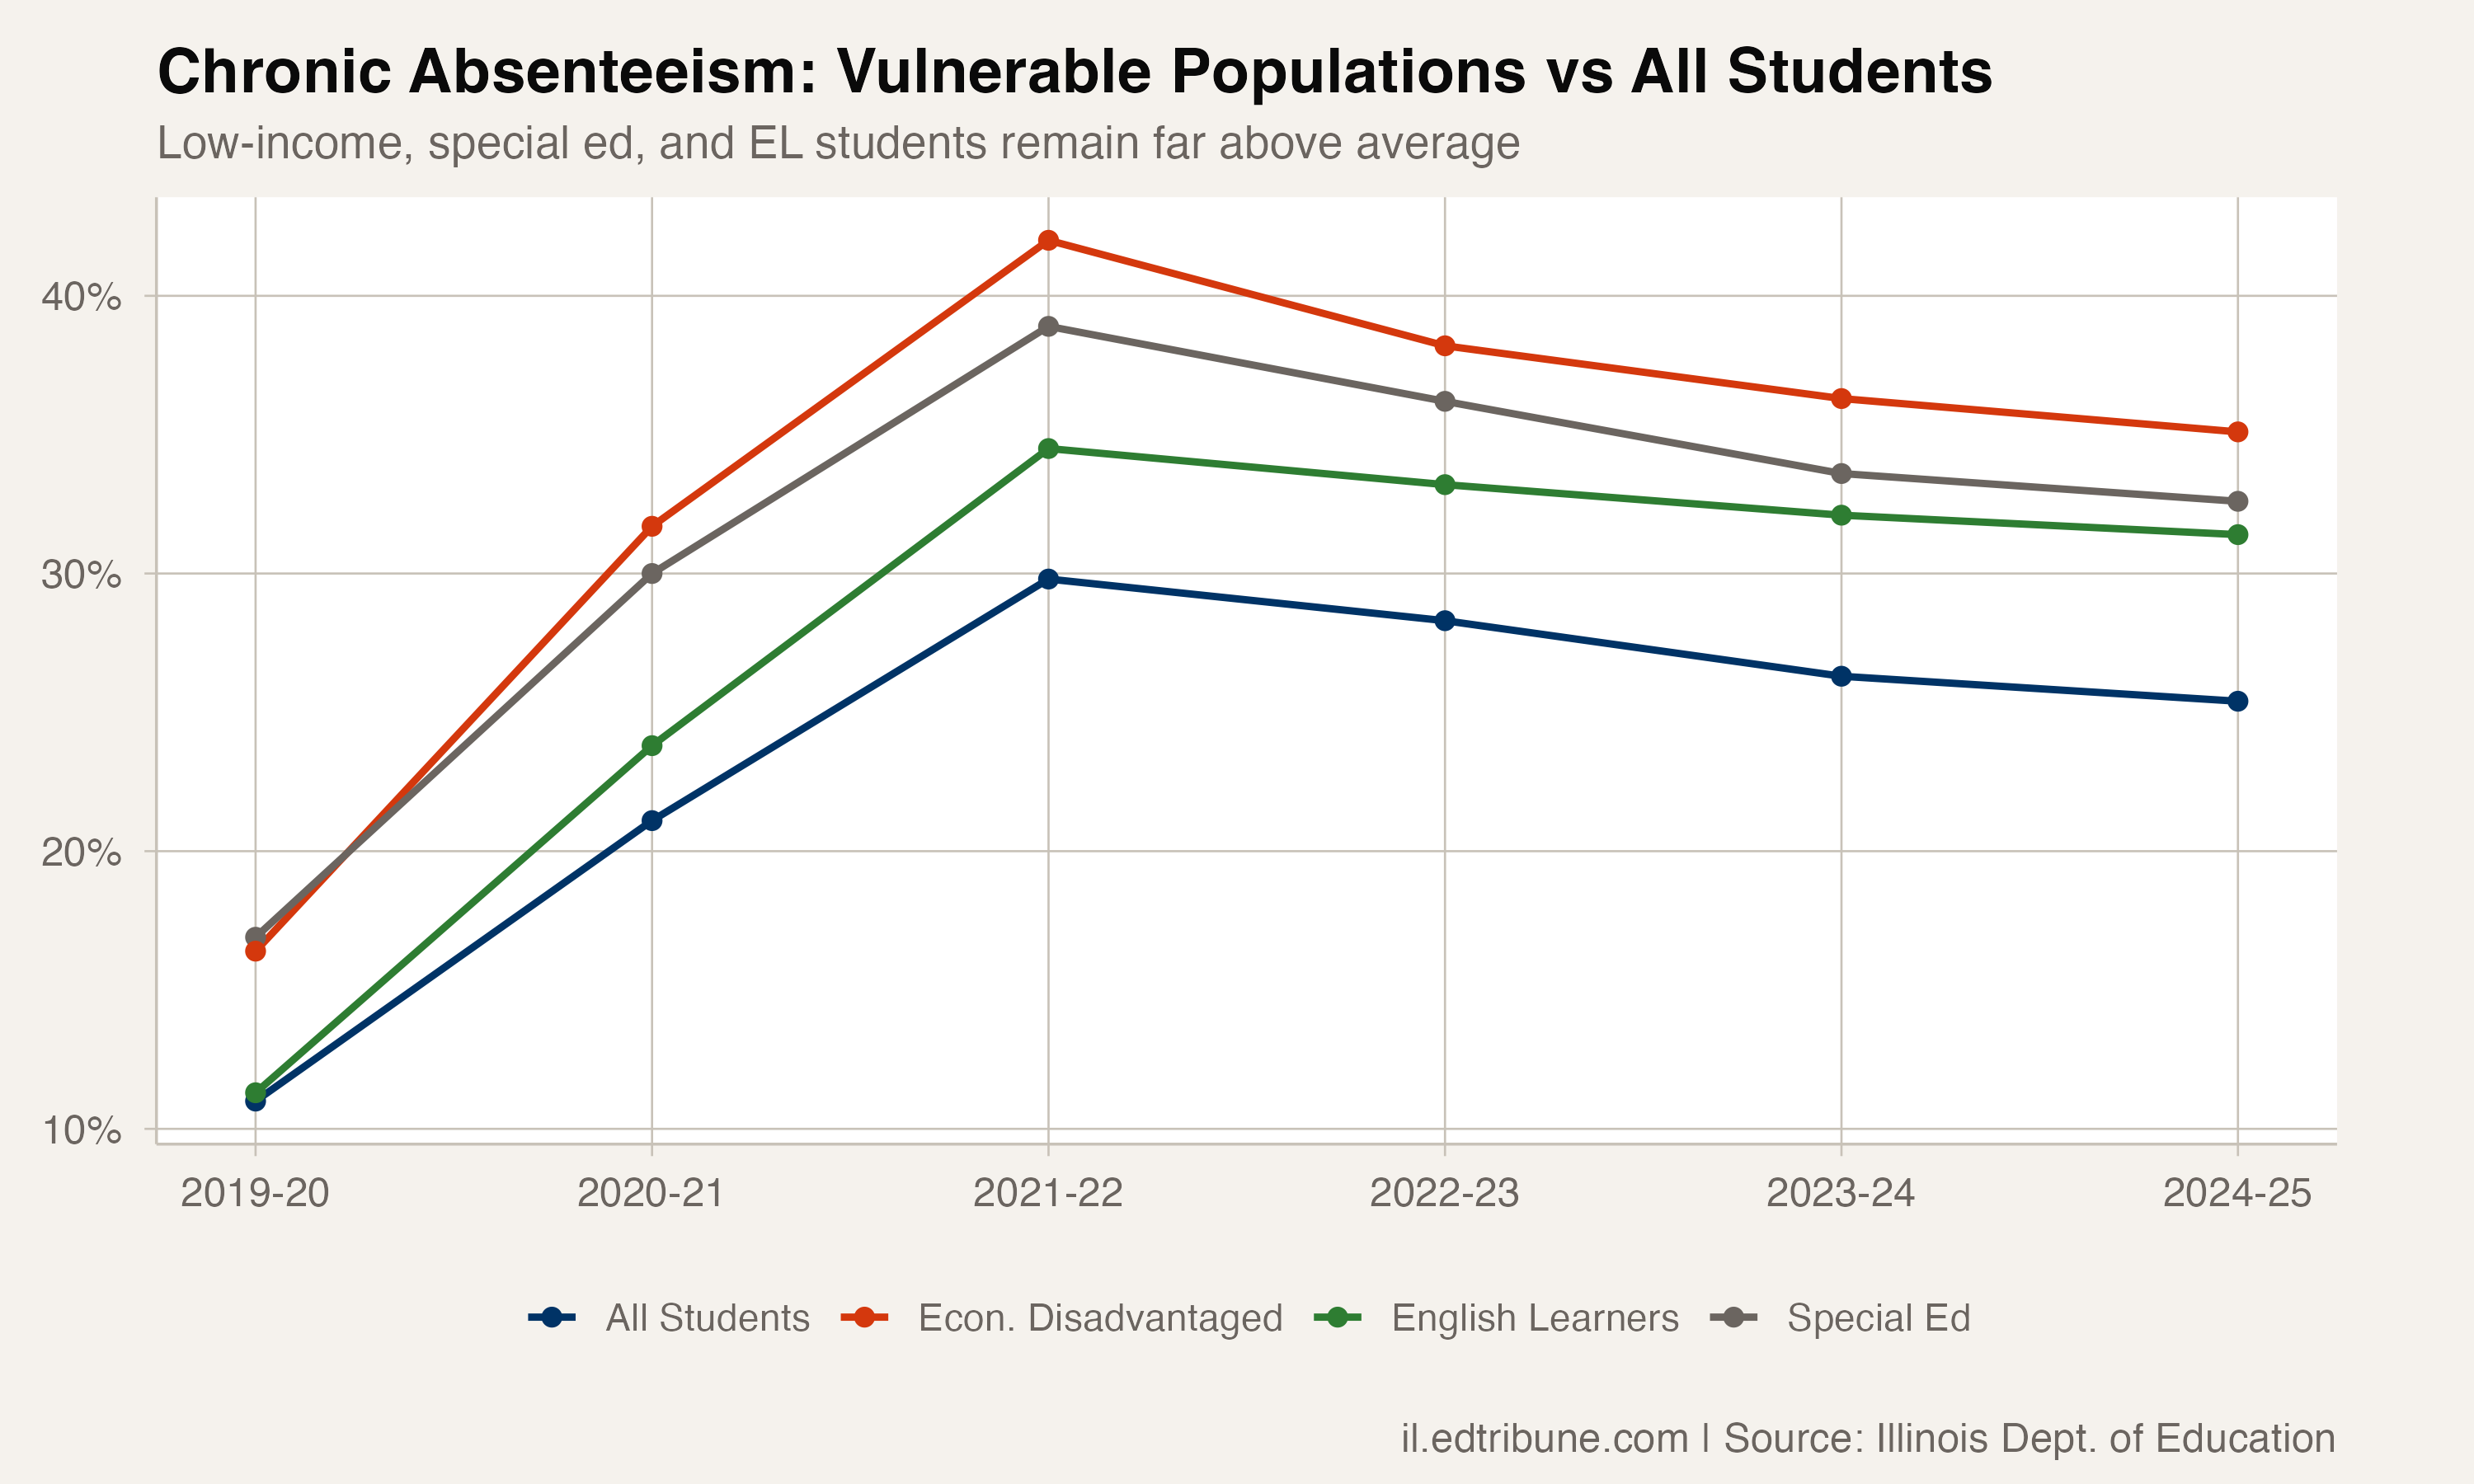
The link between family income and school attendance predates the pandemic, but COVID widened it considerably. In 2024-25, 35.1% of Illinois students who are economically disadvantaged were chronically absent. That is nearly 10 percentage points above the statewide average of 25.4%, and more than double the 16.4% rate recorded before COVID.
The pattern is not limited to students from low-income families. Students who receive special education services carry a chronic rate of 32.6%. Students who are English learners sit at 31.4%. Each of these populations faces distinct barriers to attendance, but the data shows a shared trajectory: all three groups rose sharply during COVID, and all three have recovered more slowly than the overall student population.
The widening gap
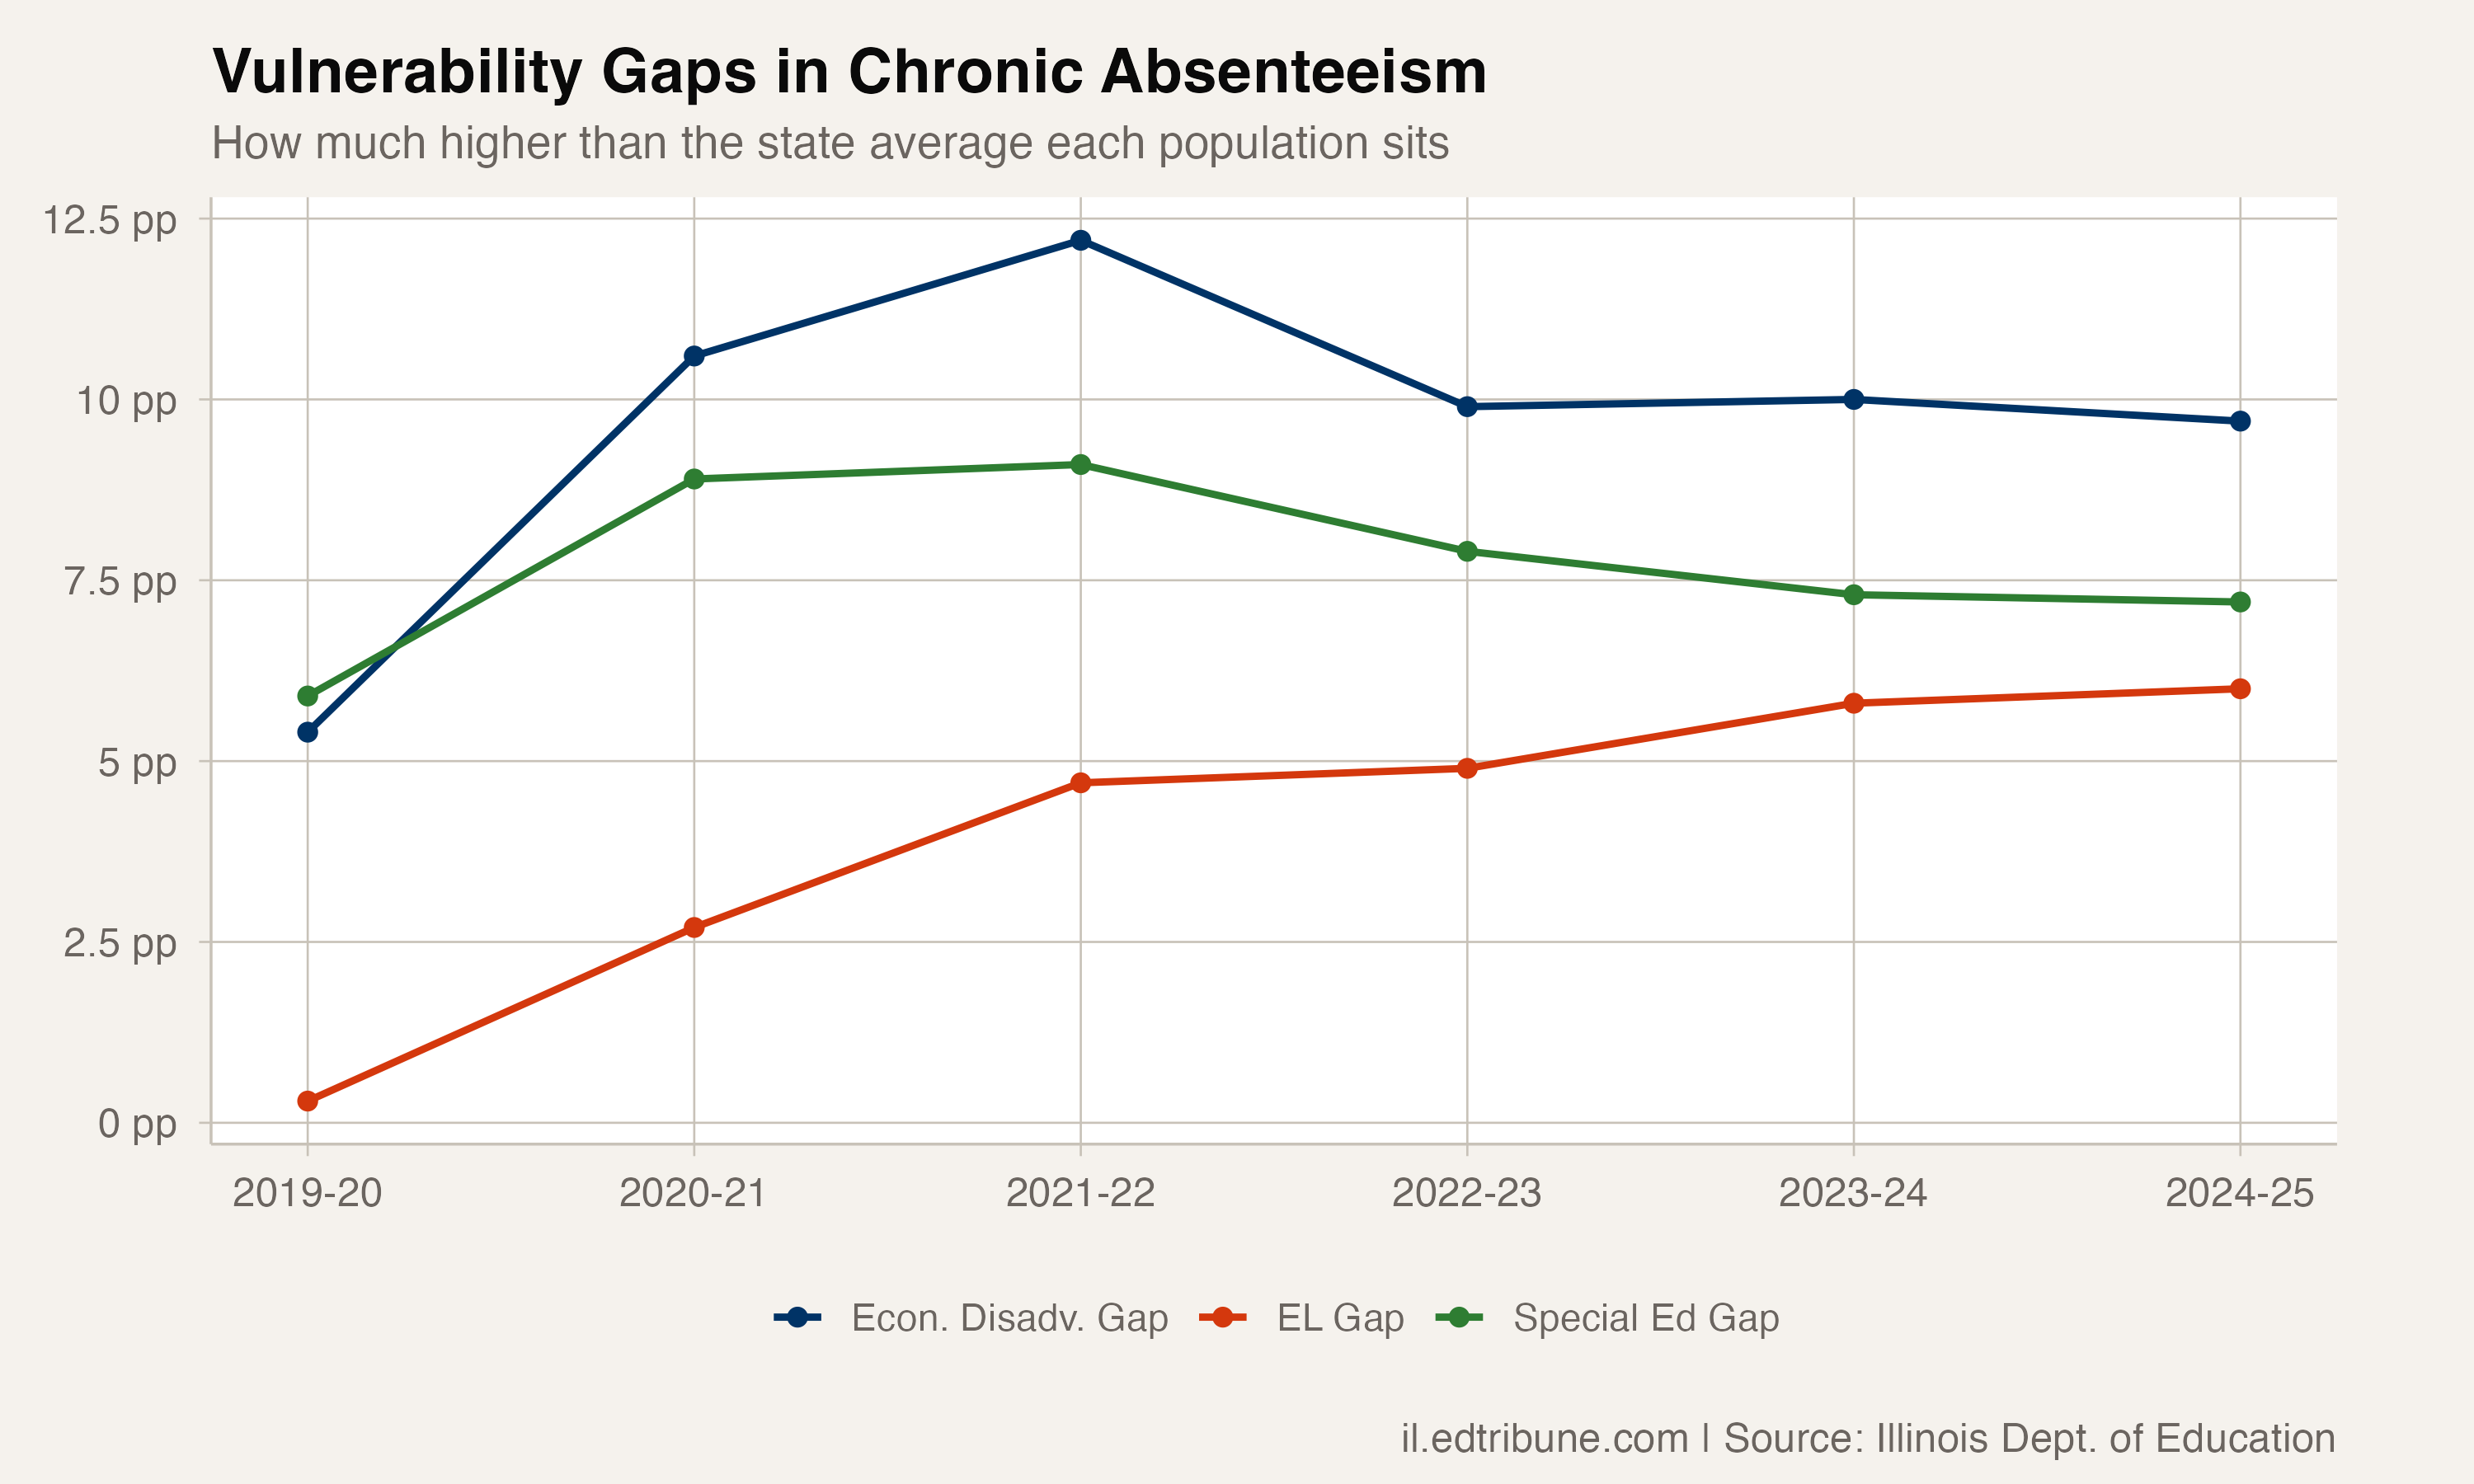
Before the pandemic, the poverty gap (the difference between the economically disadvantaged rate and the overall rate) was 5.4 percentage points. COVID pushed it to 12.2 points. It has since narrowed to 9.7 points, but that still translates to roughly 10 more chronically absent students per 100 among those who are economically disadvantaged compared to the statewide norm.
Students who receive special education services show a similar trajectory. Their pre-COVID rate of 16.9% more than doubled to 38.9% during the peak, and at 32.6% they remain well above their starting point. Students who are English learners went from 11.3% to 34.5% at peak and have settled at 31.4%, the slowest recovery of the three groups relative to its pre-COVID baseline.
Compound vulnerability
The subgroup data counts students individually, but many students belong to more than one category at once. A student who is economically disadvantaged, receives special education services, and is an English learner faces compounding barriers that the individual-subgroup data understates. In districts where these populations heavily overlap, chronic rates can climb above 40% or 50%.
For students who are economically disadvantaged, the barriers are concrete. Families may lack reliable transportation, may not be able to afford childcare for younger siblings, may face housing instability that disrupts school routines, or may need older children to work during school hours. The pandemic amplified all of these pressures and created new ones: long COVID symptoms, caregiving responsibilities for ill family members, and mental health needs that went untreated during school closures.
The excess that accumulates
The distance between these populations' current rates and their pre-COVID baselines represents years of compounded missed instruction. A student who is economically disadvantaged and has been chronically absent for four consecutive post-pandemic years has missed roughly 72 days of school, about a full semester. For students who receive special education services and often need more instructional time to make progress, the loss carries even more weight.
Illinois's attendance recovery will be measured by whether it reaches these populations specifically. A strategy that improves the overall rate by one point a year while leaving the poverty gap intact simply moves the goalposts for the students who can least afford to miss school.
Detailed code that reproduces the analysis and figures in this article is available exclusively to EdTribune subscribers.
Discussion
Sign in to join the discussion.
Loading comments...