Correction (July 21, 2026): The original article said Springfield hovered near 40% for nearly the full series even though it reached 57.6% in 2021-22. It also characterized Decatur's post-peak improvement as minimal despite a 12.8-point decline from its peak. This version corrects those trends, bounds Rockford's comparison to an explicit large-district panel, labels the absent-student count as an estimate, removes unsupported structural-floor and causal explanations, and rebuilds the claim ledger from fresh state-package output.
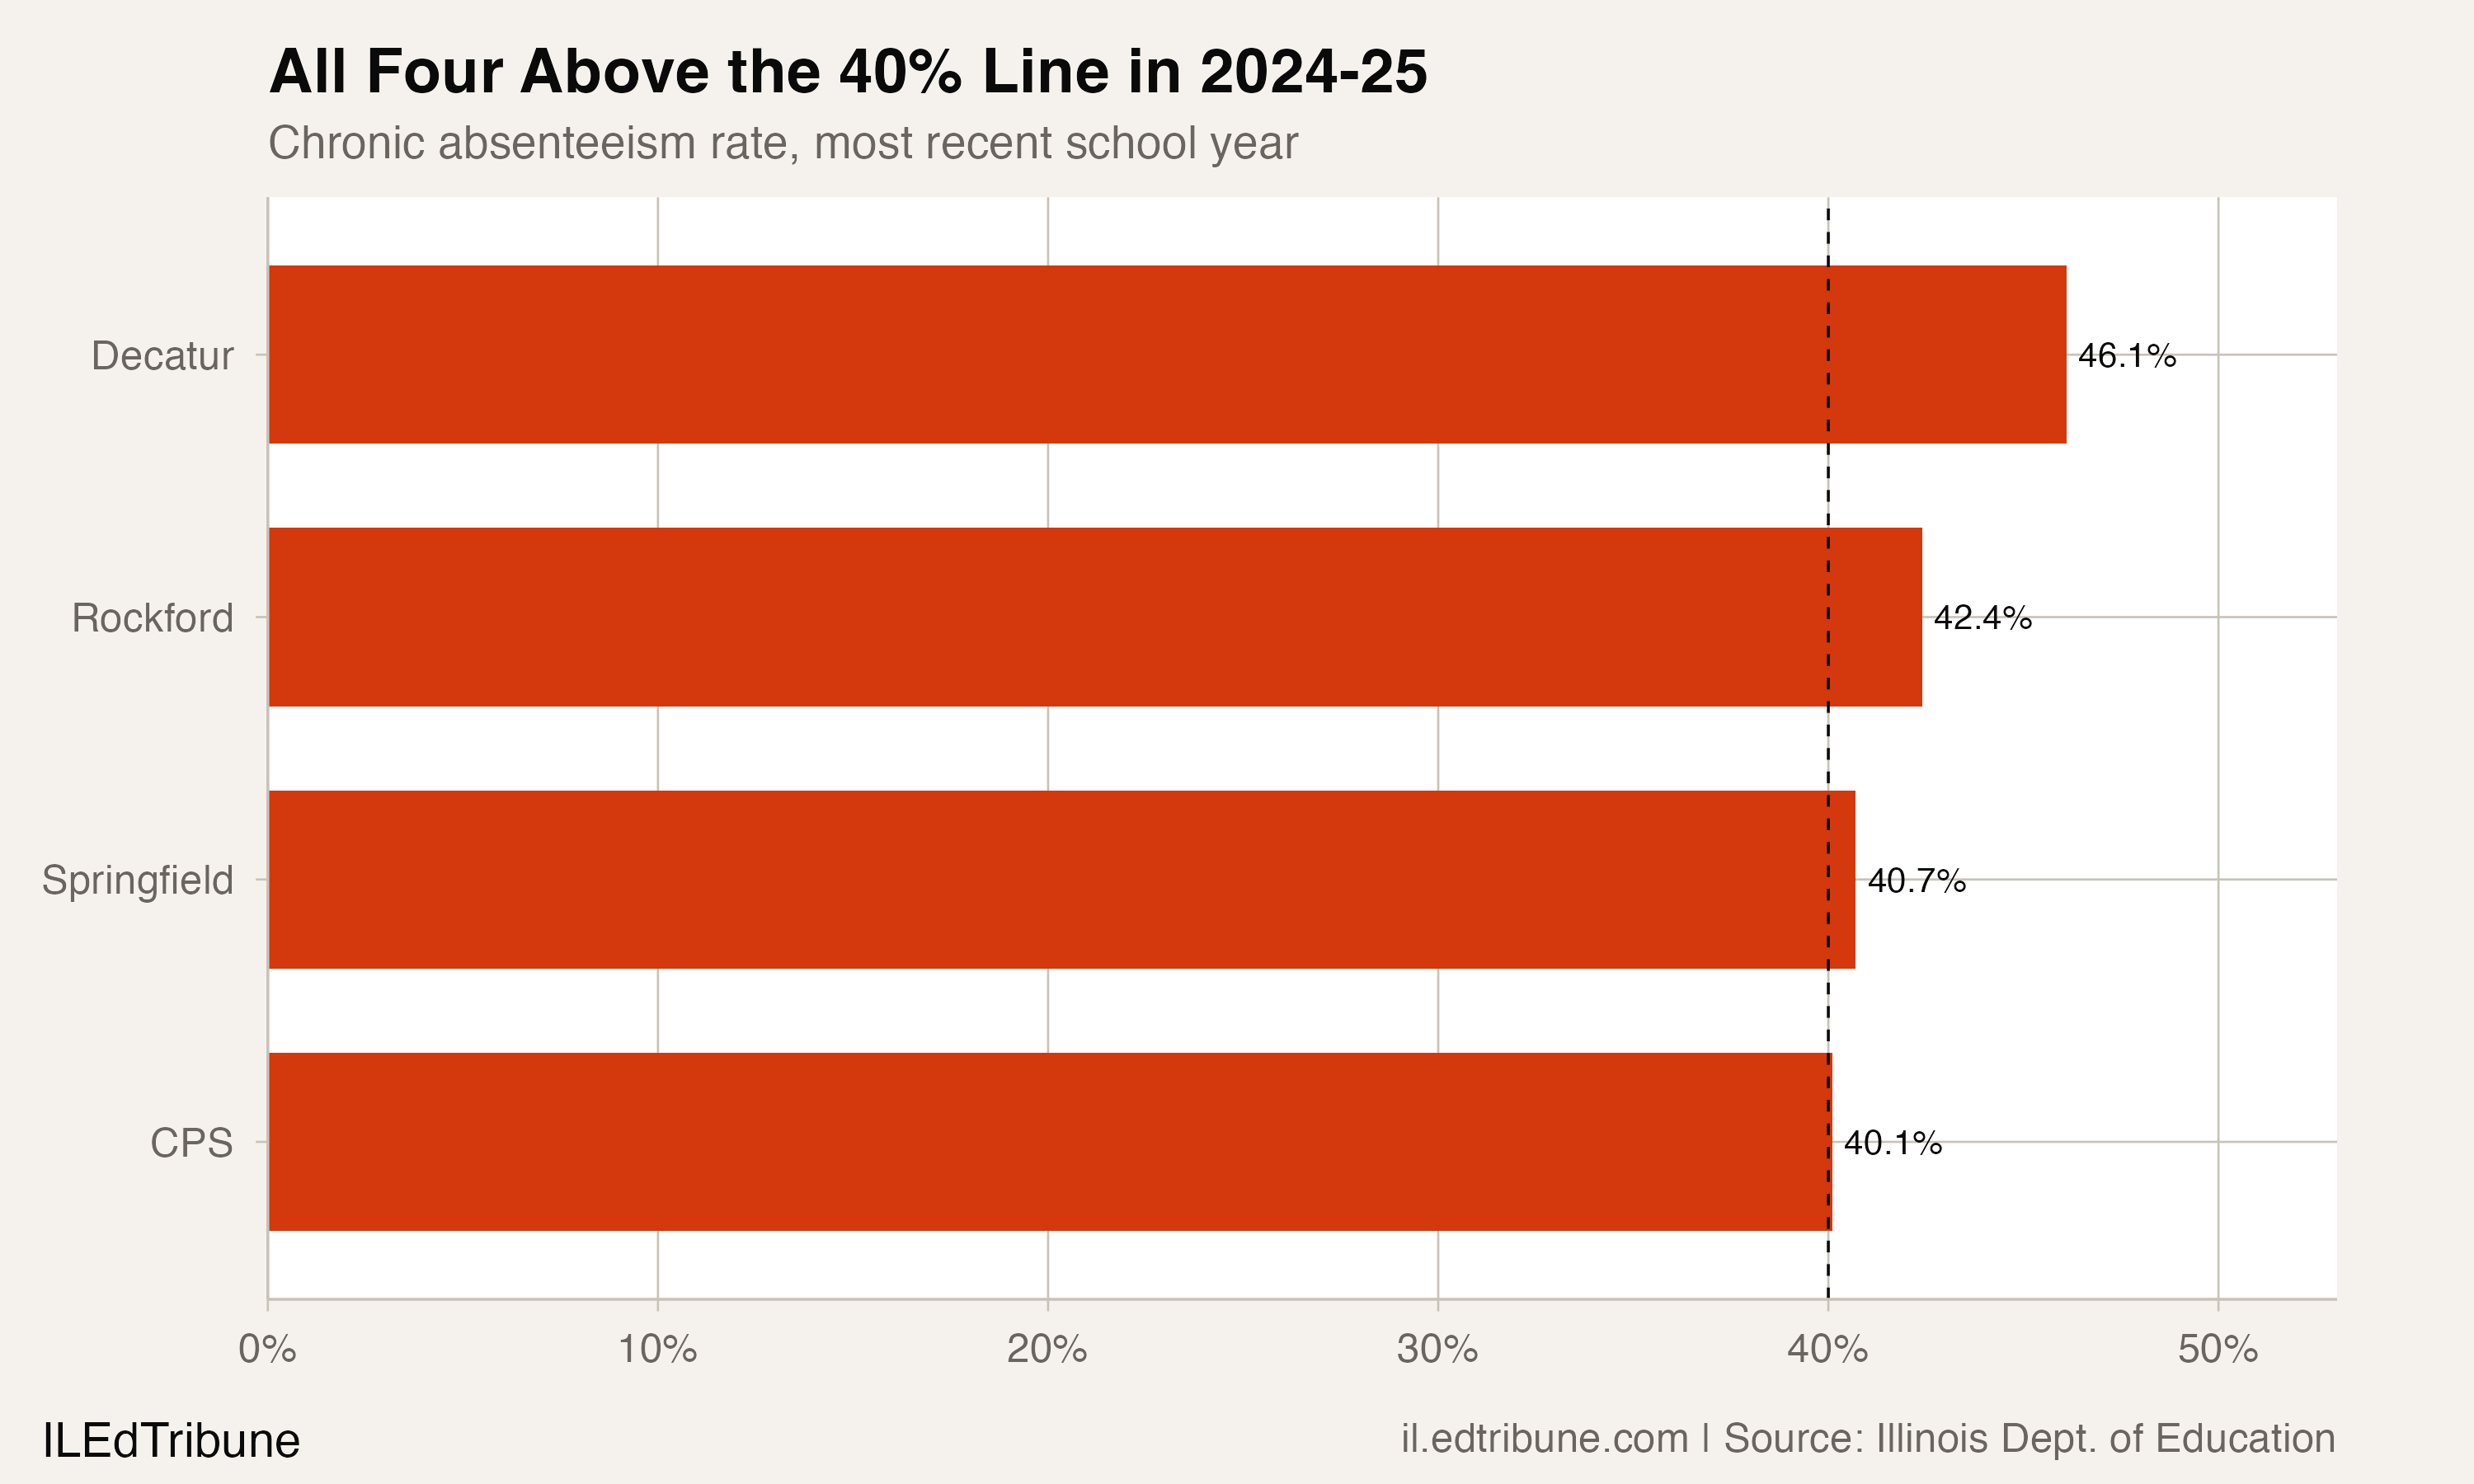
Four Illinois urban districts reported chronic absenteeism above 40% in 2024-25: Decatur↗ET SD 61 at 46.1%, Rockford↗ET SD 205 at 42.4%, Springfield↗ET SD 186 at 40.7% and CPS↗ET at 40.1%.
Their 2024-25 enrollment totaled 371,744 students. Multiplying each district's enrollment by its reported rate produces an estimated 150,258 chronically absent students. The absence file does not report district-level counts for these rows, so that figure is a rate-based estimate rather than an observed count.
Four Districts, Four Trajectories
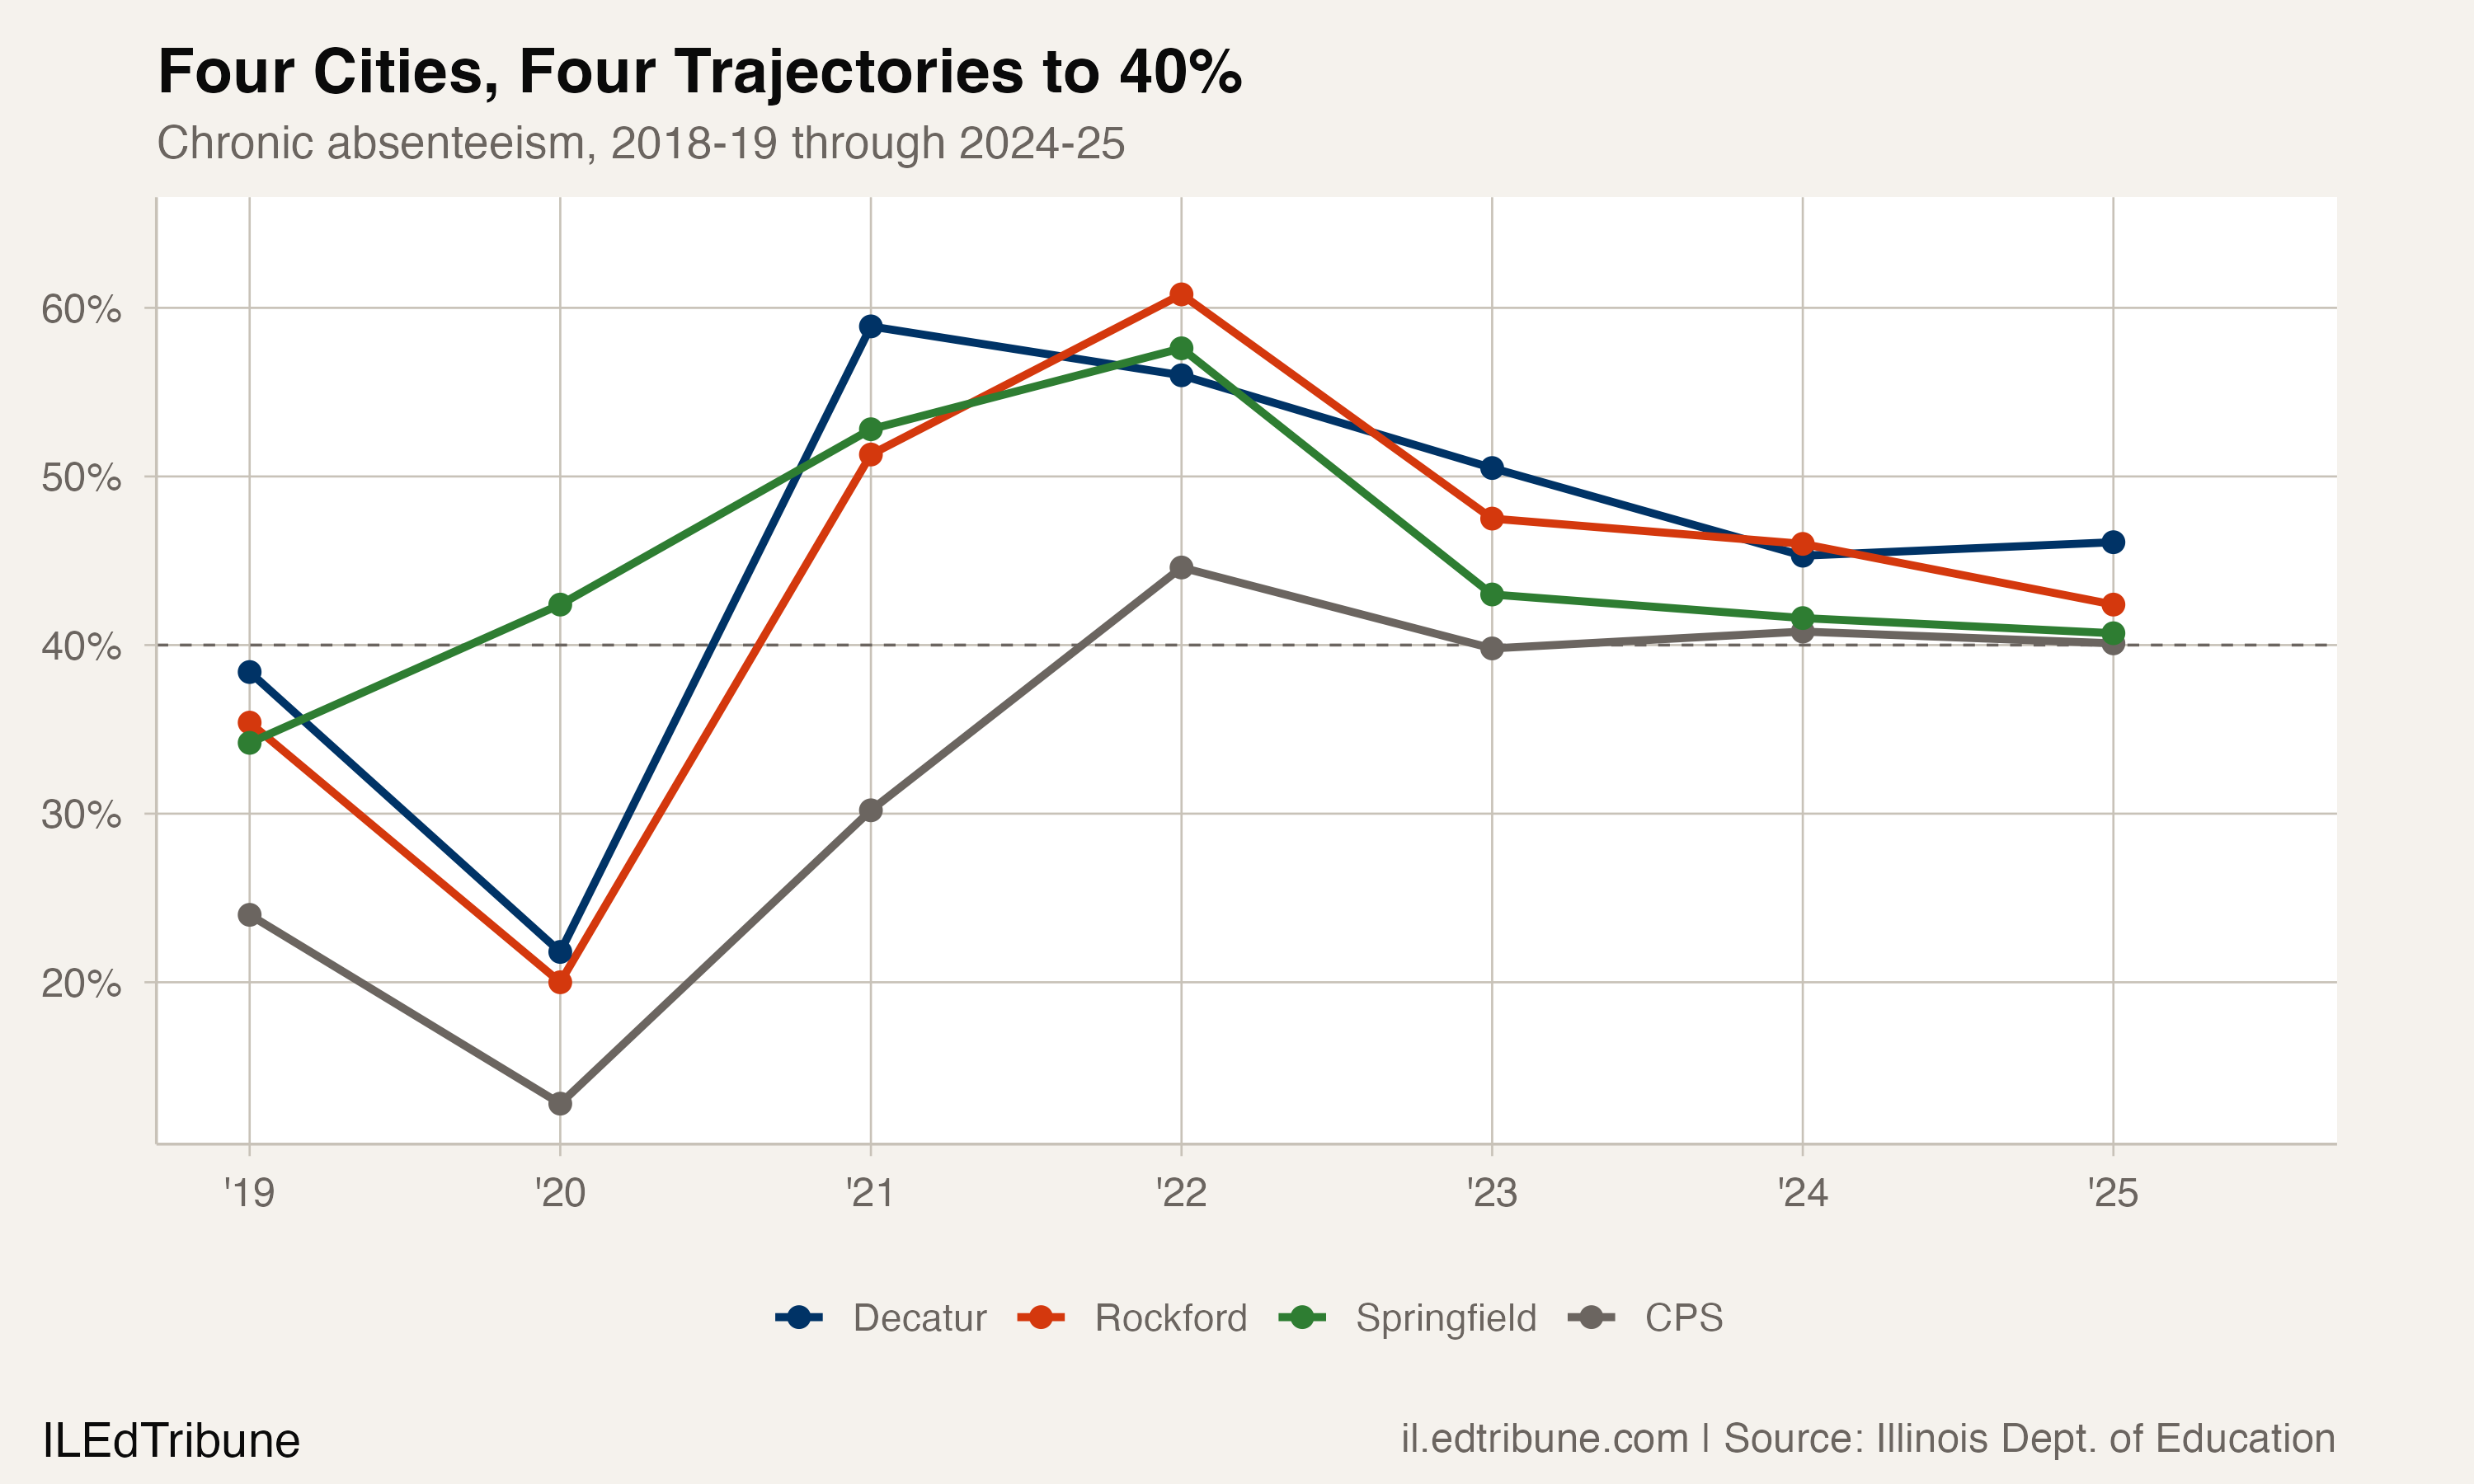
Rockford moved from 35.4% in 2018-19 to 20.0% in 2019-20, 51.3% in 2020-21 and a 60.8% peak in 2021-22. It then declined each year to 47.5%, 46.0% and 42.4%, an 18.4-point improvement from the peak. The 2021-22 rate was highest among the nine districts with 2024-25 enrollment of at least 15,000. Rockford's current rate was still 2.12 times its 2019-20 rate.
Springfield did not stay near 40% throughout the series. Its rates were 34.2% in 2018-19, 42.4% in 2019-20, 52.8% in 2020-21 and 57.6% in 2021-22. They then fell to 43.0%, 41.6% and 40.7%. The current rate was 1.7 points below the 2019-20 rate and 16.9 points below the peak.
CPS moved from 12.8% in 2019-20 to a 44.6% peak in 2021-22. Its last three rates were 39.8%, 40.8% and 40.1%, a 1.0-point range. The current rate was 3.13 times the 2019-20 rate. That arithmetic describes the aggregate series; it does not identify why the rate stabilized in that interval.
Decatur moved from 21.8% in 2019-20 to 58.9% in 2020-21. It then reported 56.0%, 50.5%, 45.3% and 46.1%. The current rate was 12.8 points below its peak but 24.3 points above its 2019-20 rate.
What the Comparison Does Not Establish
All four current rates exceeded 40%, but four selected districts cannot establish a natural urban floor. The package does not test whether poverty, transportation, health access, budgets, leadership or attendance programs caused the similarities or differences. It also does not support a forecast for the next reporting year.
Data source: chronic absenteeism rates and enrollment counts come from the Illinois State Board of Education. Rate trends cover reporting years 2019 through 2025. The large-district comparison uses 2024-25 enrollment of at least 15,000 as its explicit threshold.
Detailed code that reproduces the analysis and figures in this article is available exclusively to EdTribune subscribers.
Discussion
Sign in to join the discussion.
Loading comments...