Illinois's statewide chronic absenteeism rate improved for a third consecutive year in 2024-25, but the size of the improvement fell sharply. The rate declined by 0.9 percentage points, from 26.3% to 25.4%. The year before, it had declined by 2.0 points.
That makes the latest improvement 45% as large as the previous one. It is evidence that the pace slowed in the latest year. One annual change cannot establish that the recovery has permanently stalled.
Three years down from the peak
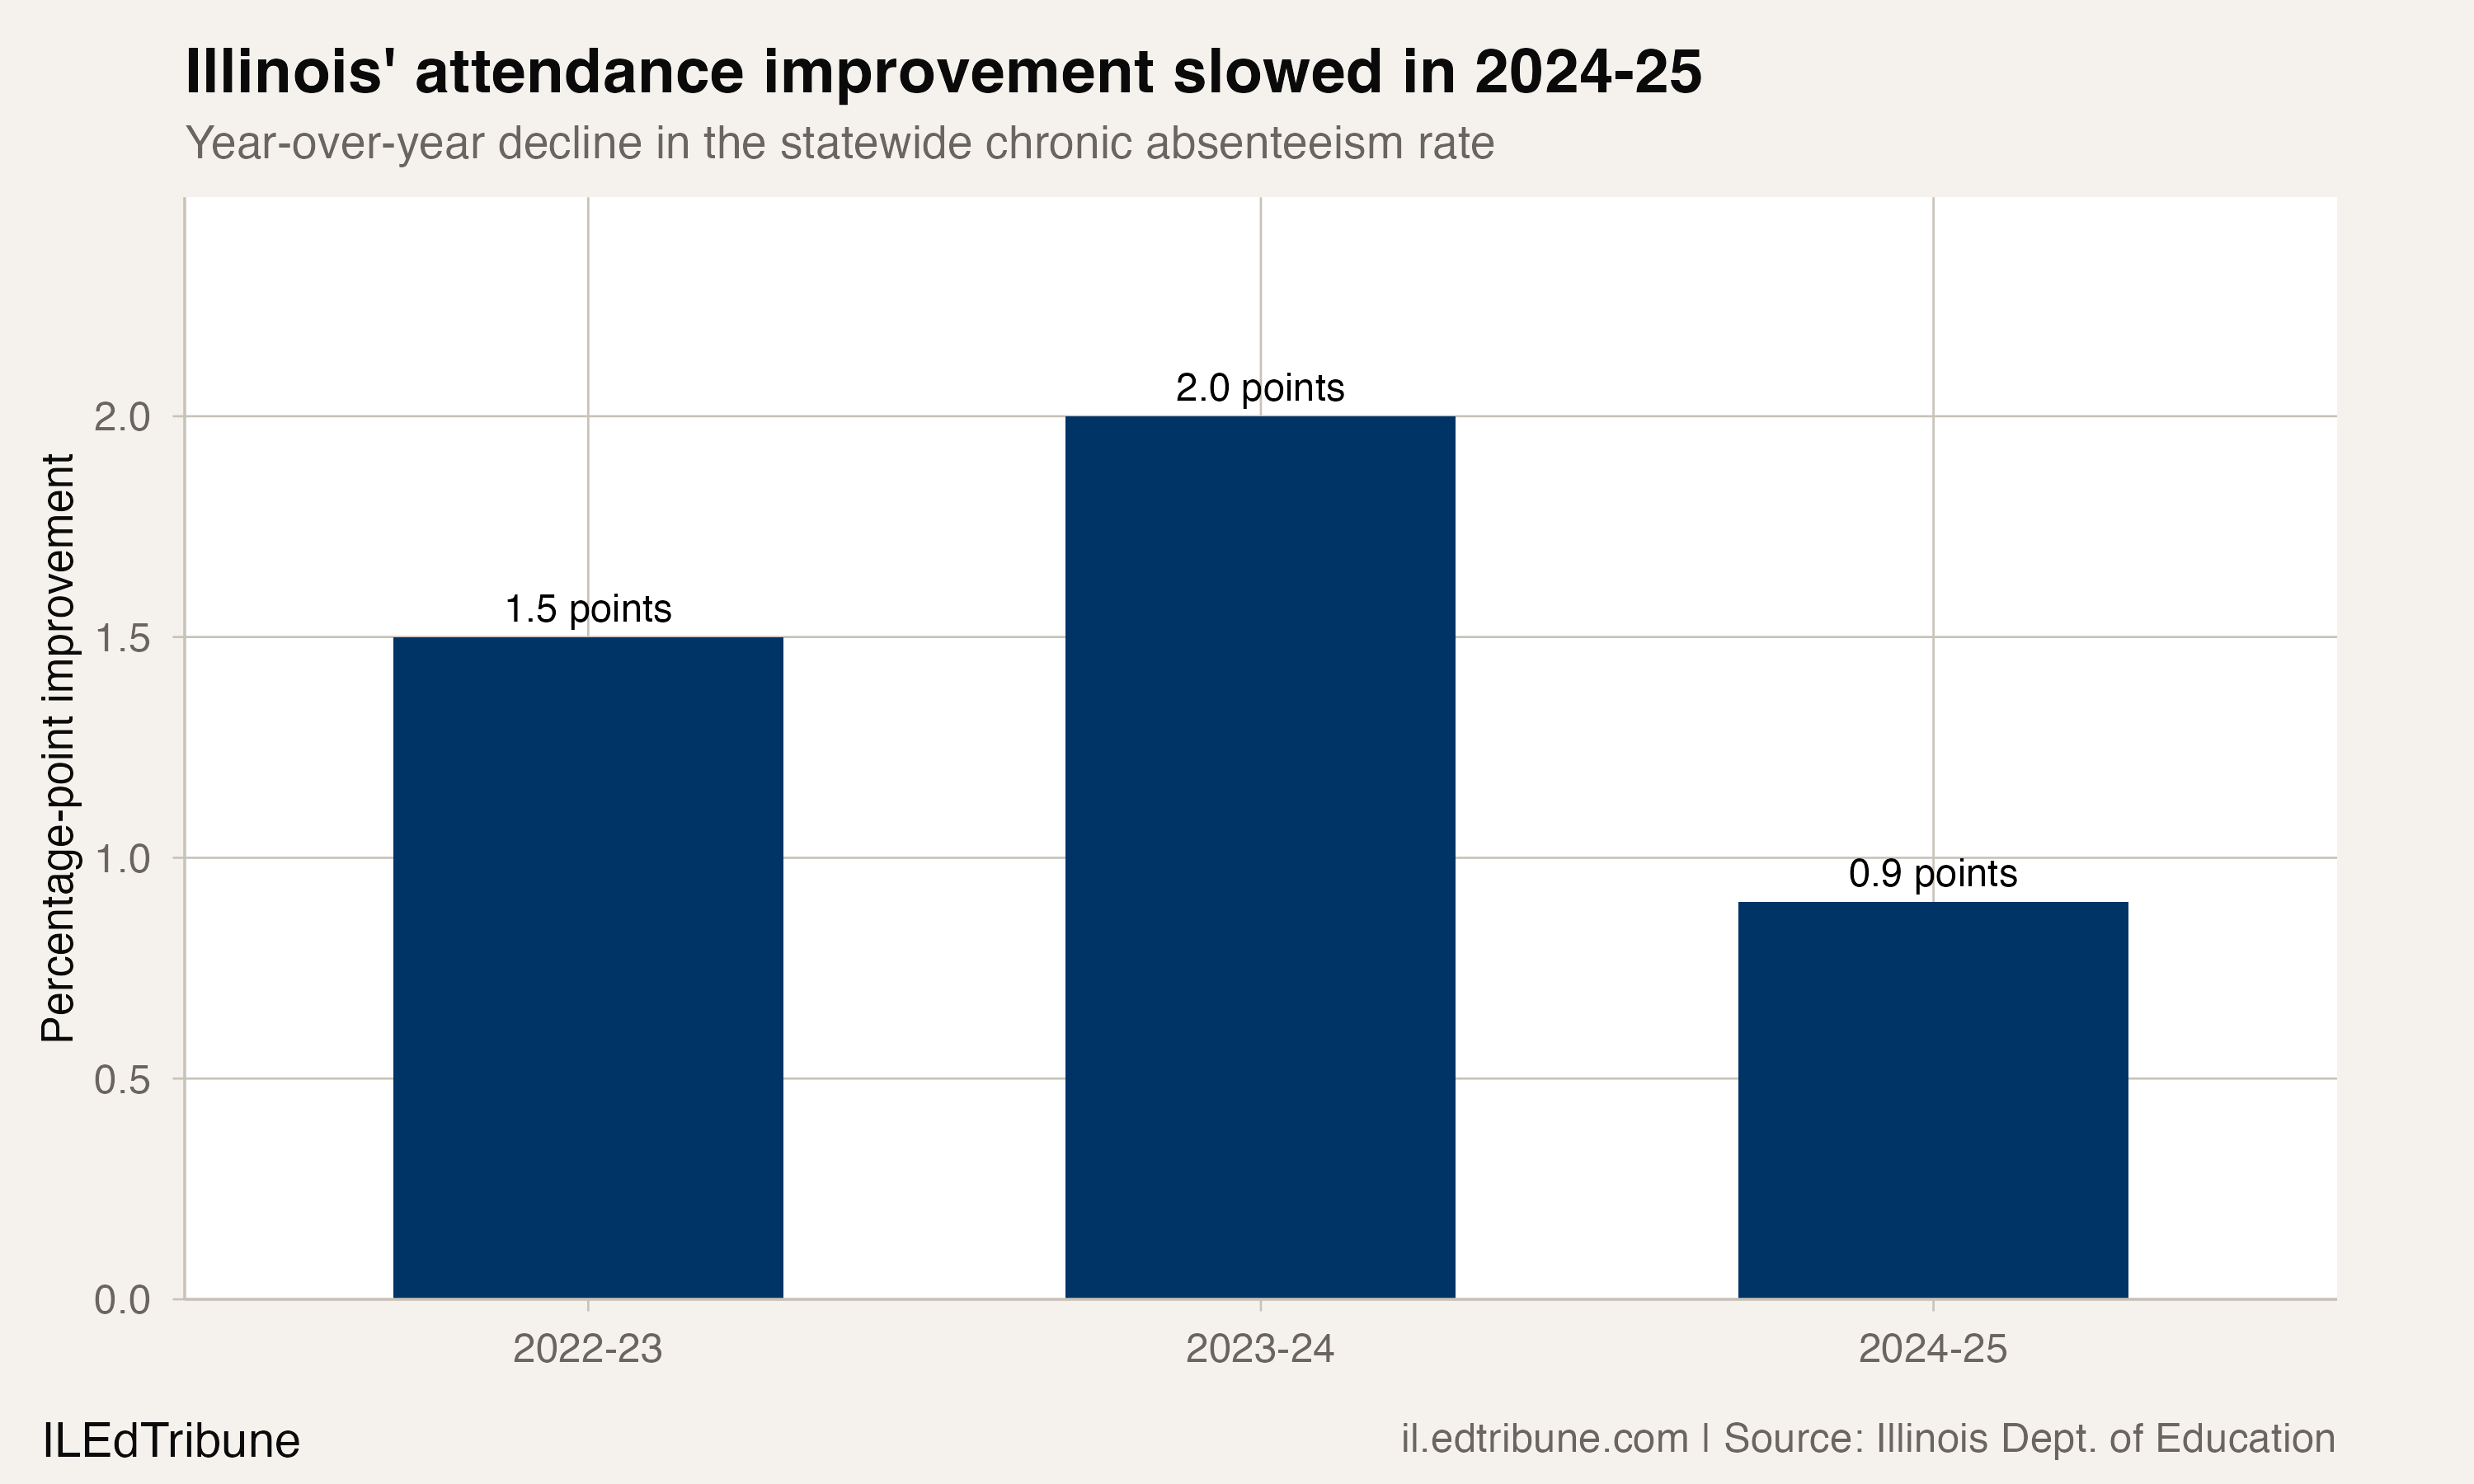
Illinois's published statewide rate rose from 11.0% in 2019-20 to 21.1% in 2020-21, then peaked at 29.8% in 2021-22. It fell to 28.3% in 2022-23, a 1.5-point improvement. The next decline was larger: 2.0 points, to 26.3% in 2023-24. The latest rate, 25.4%, extended the recovery while cutting the annual improvement to 0.9 points.
Across the three years since the peak, Illinois reduced the statewide rate by 4.4 percentage points. The state nevertheless remained 14.4 points above its 2019-20 rate.
The Illinois State Board of Education's definition includes absences with and without a valid excuse. The statewide percentages here come from the agency's official Report Card Public Data Set.
What a constant pace would imply
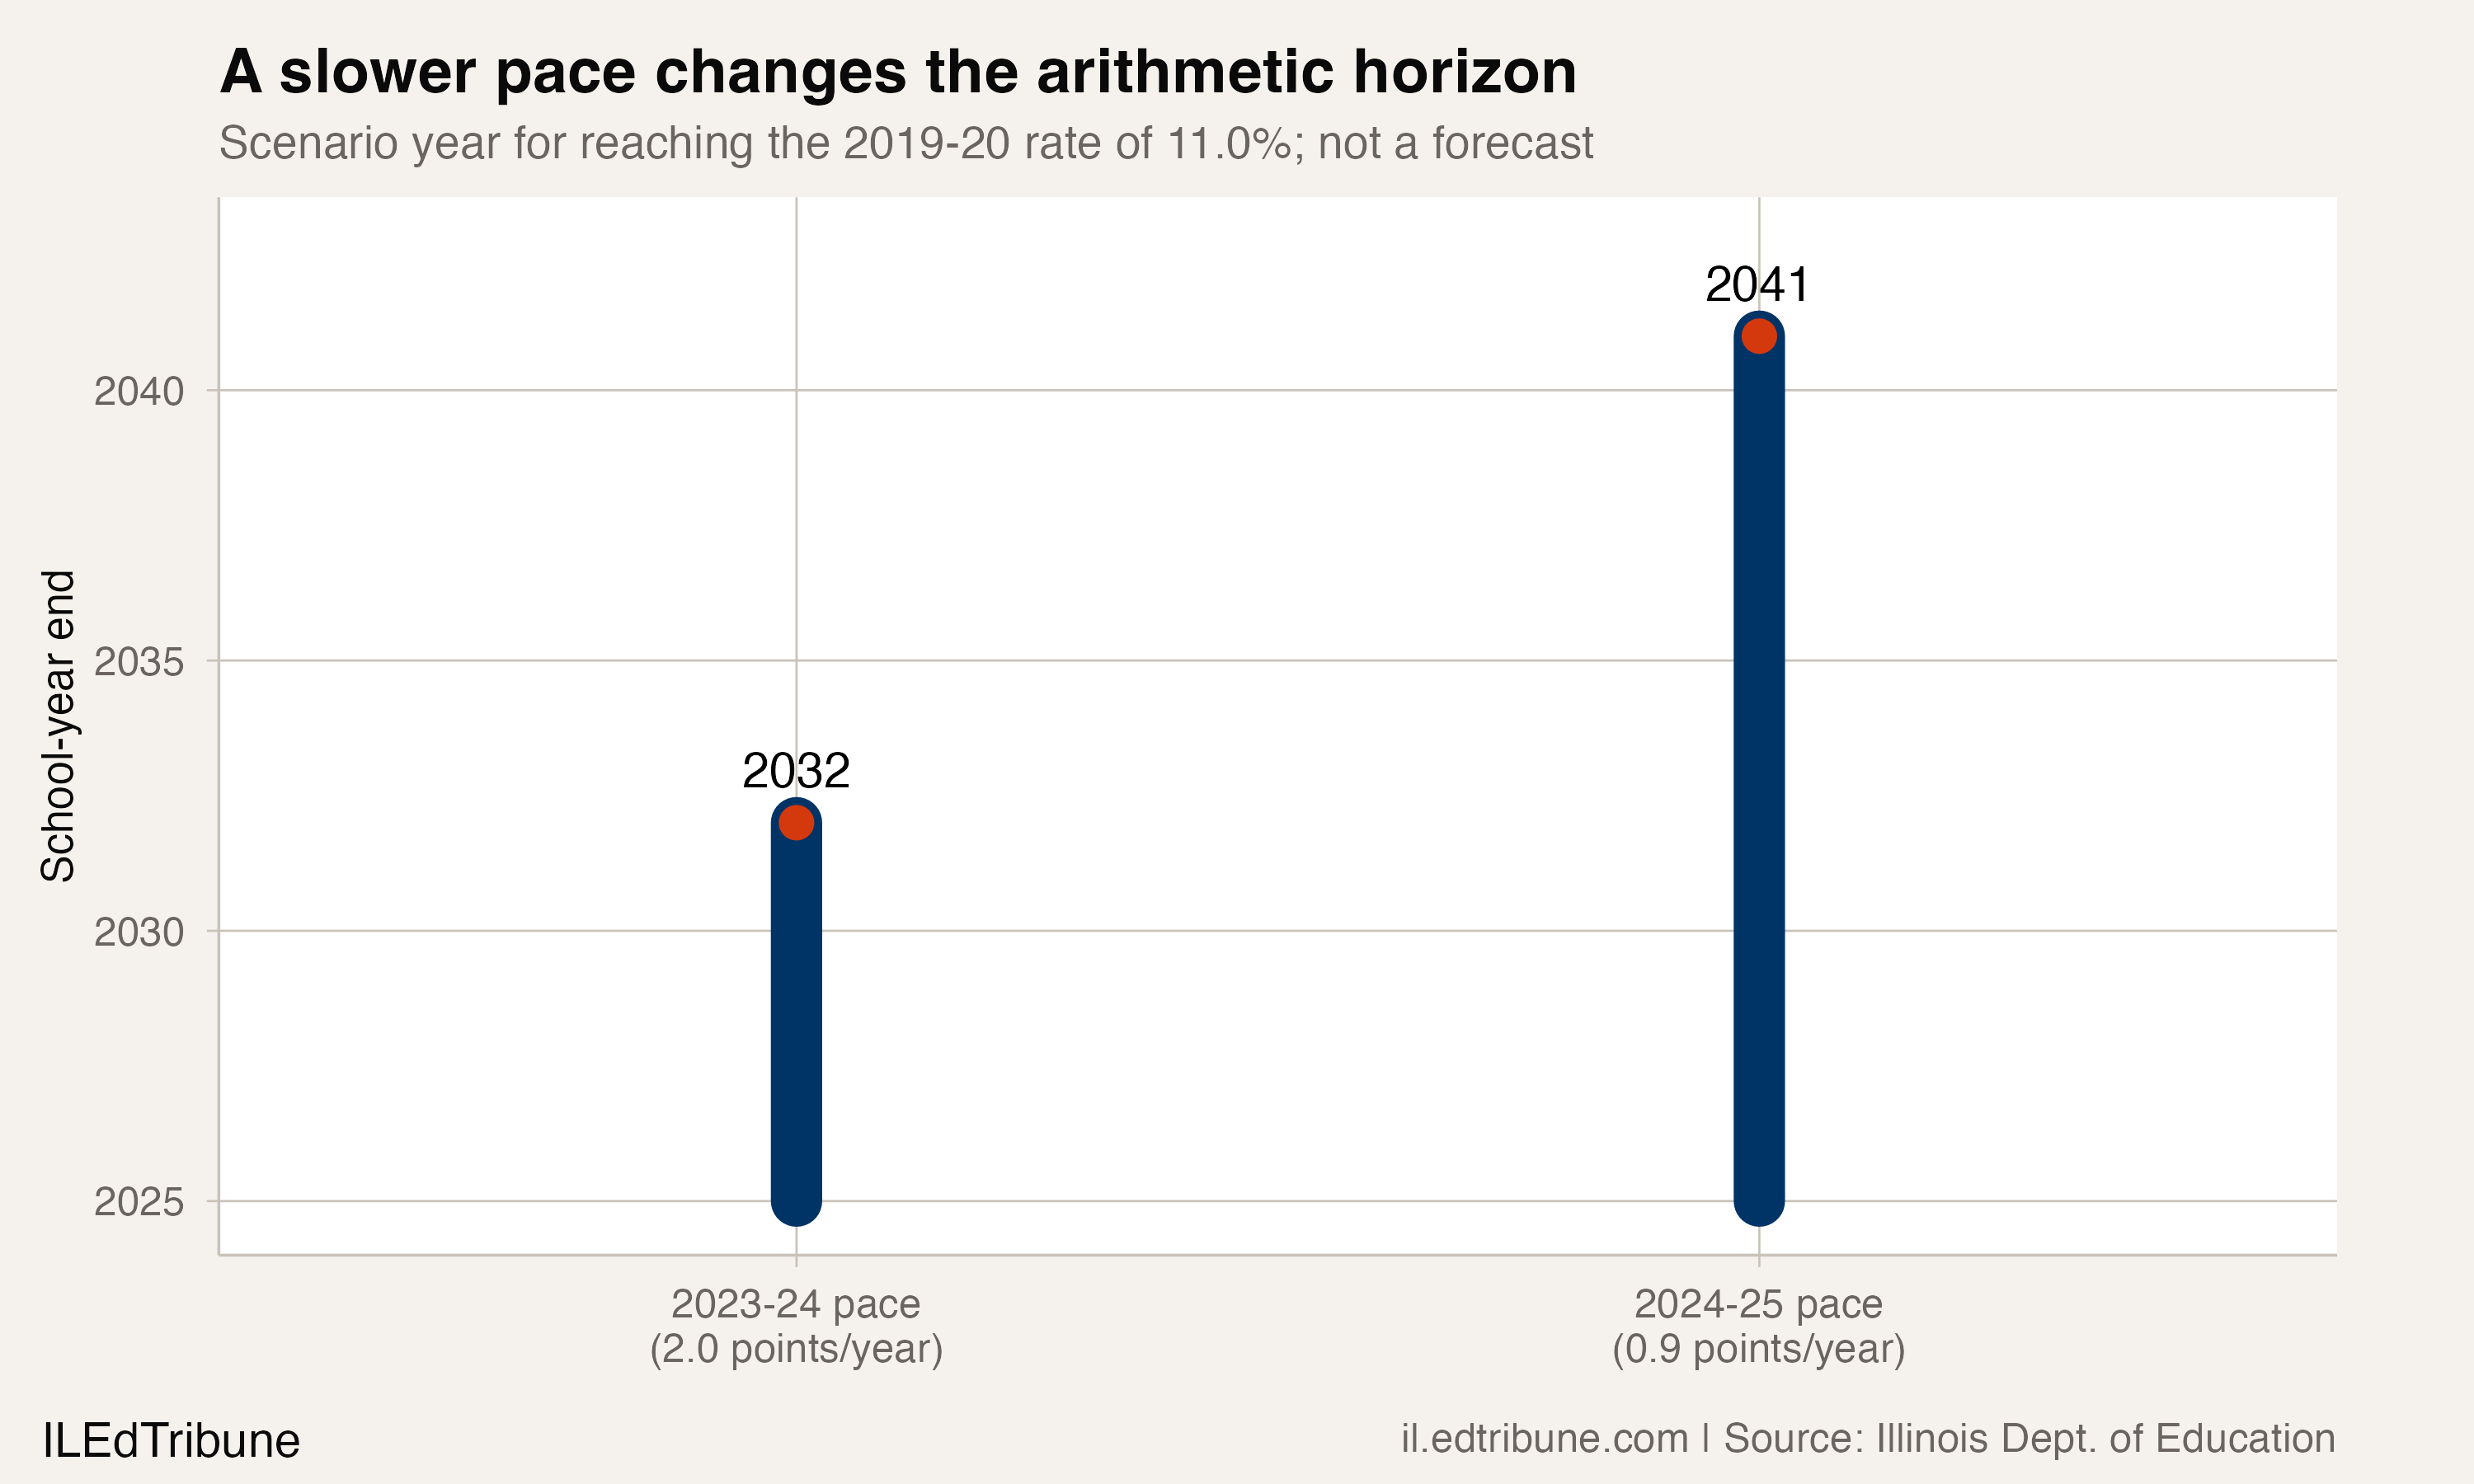
Holding the 2023-24 improvement of 2.0 points per year constant, it would take eight additional annual declines to reach or pass 11.0%, putting the arithmetic horizon at 2032. Holding the latest 0.9-point improvement constant, it would take 16 years, putting the horizon at 2041.
Those dates are scenarios, not forecasts. Chronic absenteeism does not have to change by a fixed amount each year, and the calculation does not model enrollment shifts, policy changes, district variation, or the composition of students still missing school.
The next observation matters
The state series supports a narrow conclusion: recovery continued in 2024-25, but at less than half the previous year's pace. It does not identify a cause. The Report Card file measures the outcome; it does not say whether transportation, health, housing, attendance programs, or other conditions explain the statewide change.
One more statewide observation would help distinguish a one-year interruption from the start of a flatter path. For now, “slowed” is supported by the data. “Stalled” would go beyond it.
Detailed code that reproduces the analysis and figures in this article is available exclusively to EdTribune subscribers.
Discussion
Sign in to join the discussion.
Loading comments...