Correction (September 30, 2026): An earlier version of this article, including its headline, said Winnebago's enrollment fell by nine students in 2025-26 and that enrollment from kindergarten through grade 12 rose by eight. Those figures compared two differently defined state counts. Measured on the same state count for both years, total enrollment fell by 44 students, from 1,267 to 1,223, and kindergarten through grade 12 fell by 27. The long-term trend and the comparison with the state are now stated through 2024-25 on a single count, and the district's statewide rank is 317th of 859 districts.

Michael Dugan's first day as interim superintendent of Winnebago CUSD 323↗ET was August 28, 2026. He supplied the date himself, in writing, along with a description of the job that puts a handoff at the end of it.
"As the interim superintendent, my mission is clear: to maintain the district's positive course, support our talented educators and staff, and keep our students’ success at the center of every decision," he wrote in answers to The ILEdTribune. "I am here to ensure stability, protect the strong foundation already in place, and prepare a smooth, strong pathway for Winnebago's next permanent leader."
The district he is holding has been getting smaller for as long as Illinois has published a comparable record of it. The useful part is how much the rate has changed, and what happened in the most recent year.
Winnebago CUSD 323 enrolled 1,223 students in 2025-26, the most recent school year in the state's published enrollment record. That figure comes from the state's fall count, which records each student under the home district responsible for them. The longer history comes from a second, differently defined state series, the report card count, which runs through 2024-25. On that count the district enrolled 1,446 students in 2014-15 and 1,232 in 2024-25, a loss of 214 students, or 14.8 percent, against a statewide decline of 10.0 percent over the same stretch. The two counts do not agree even for the same year (for 2024-25, 1,232 on the report card and 1,267 on the fall count), so the chart below draws them as separate lines and this article never subtracts one from the other.
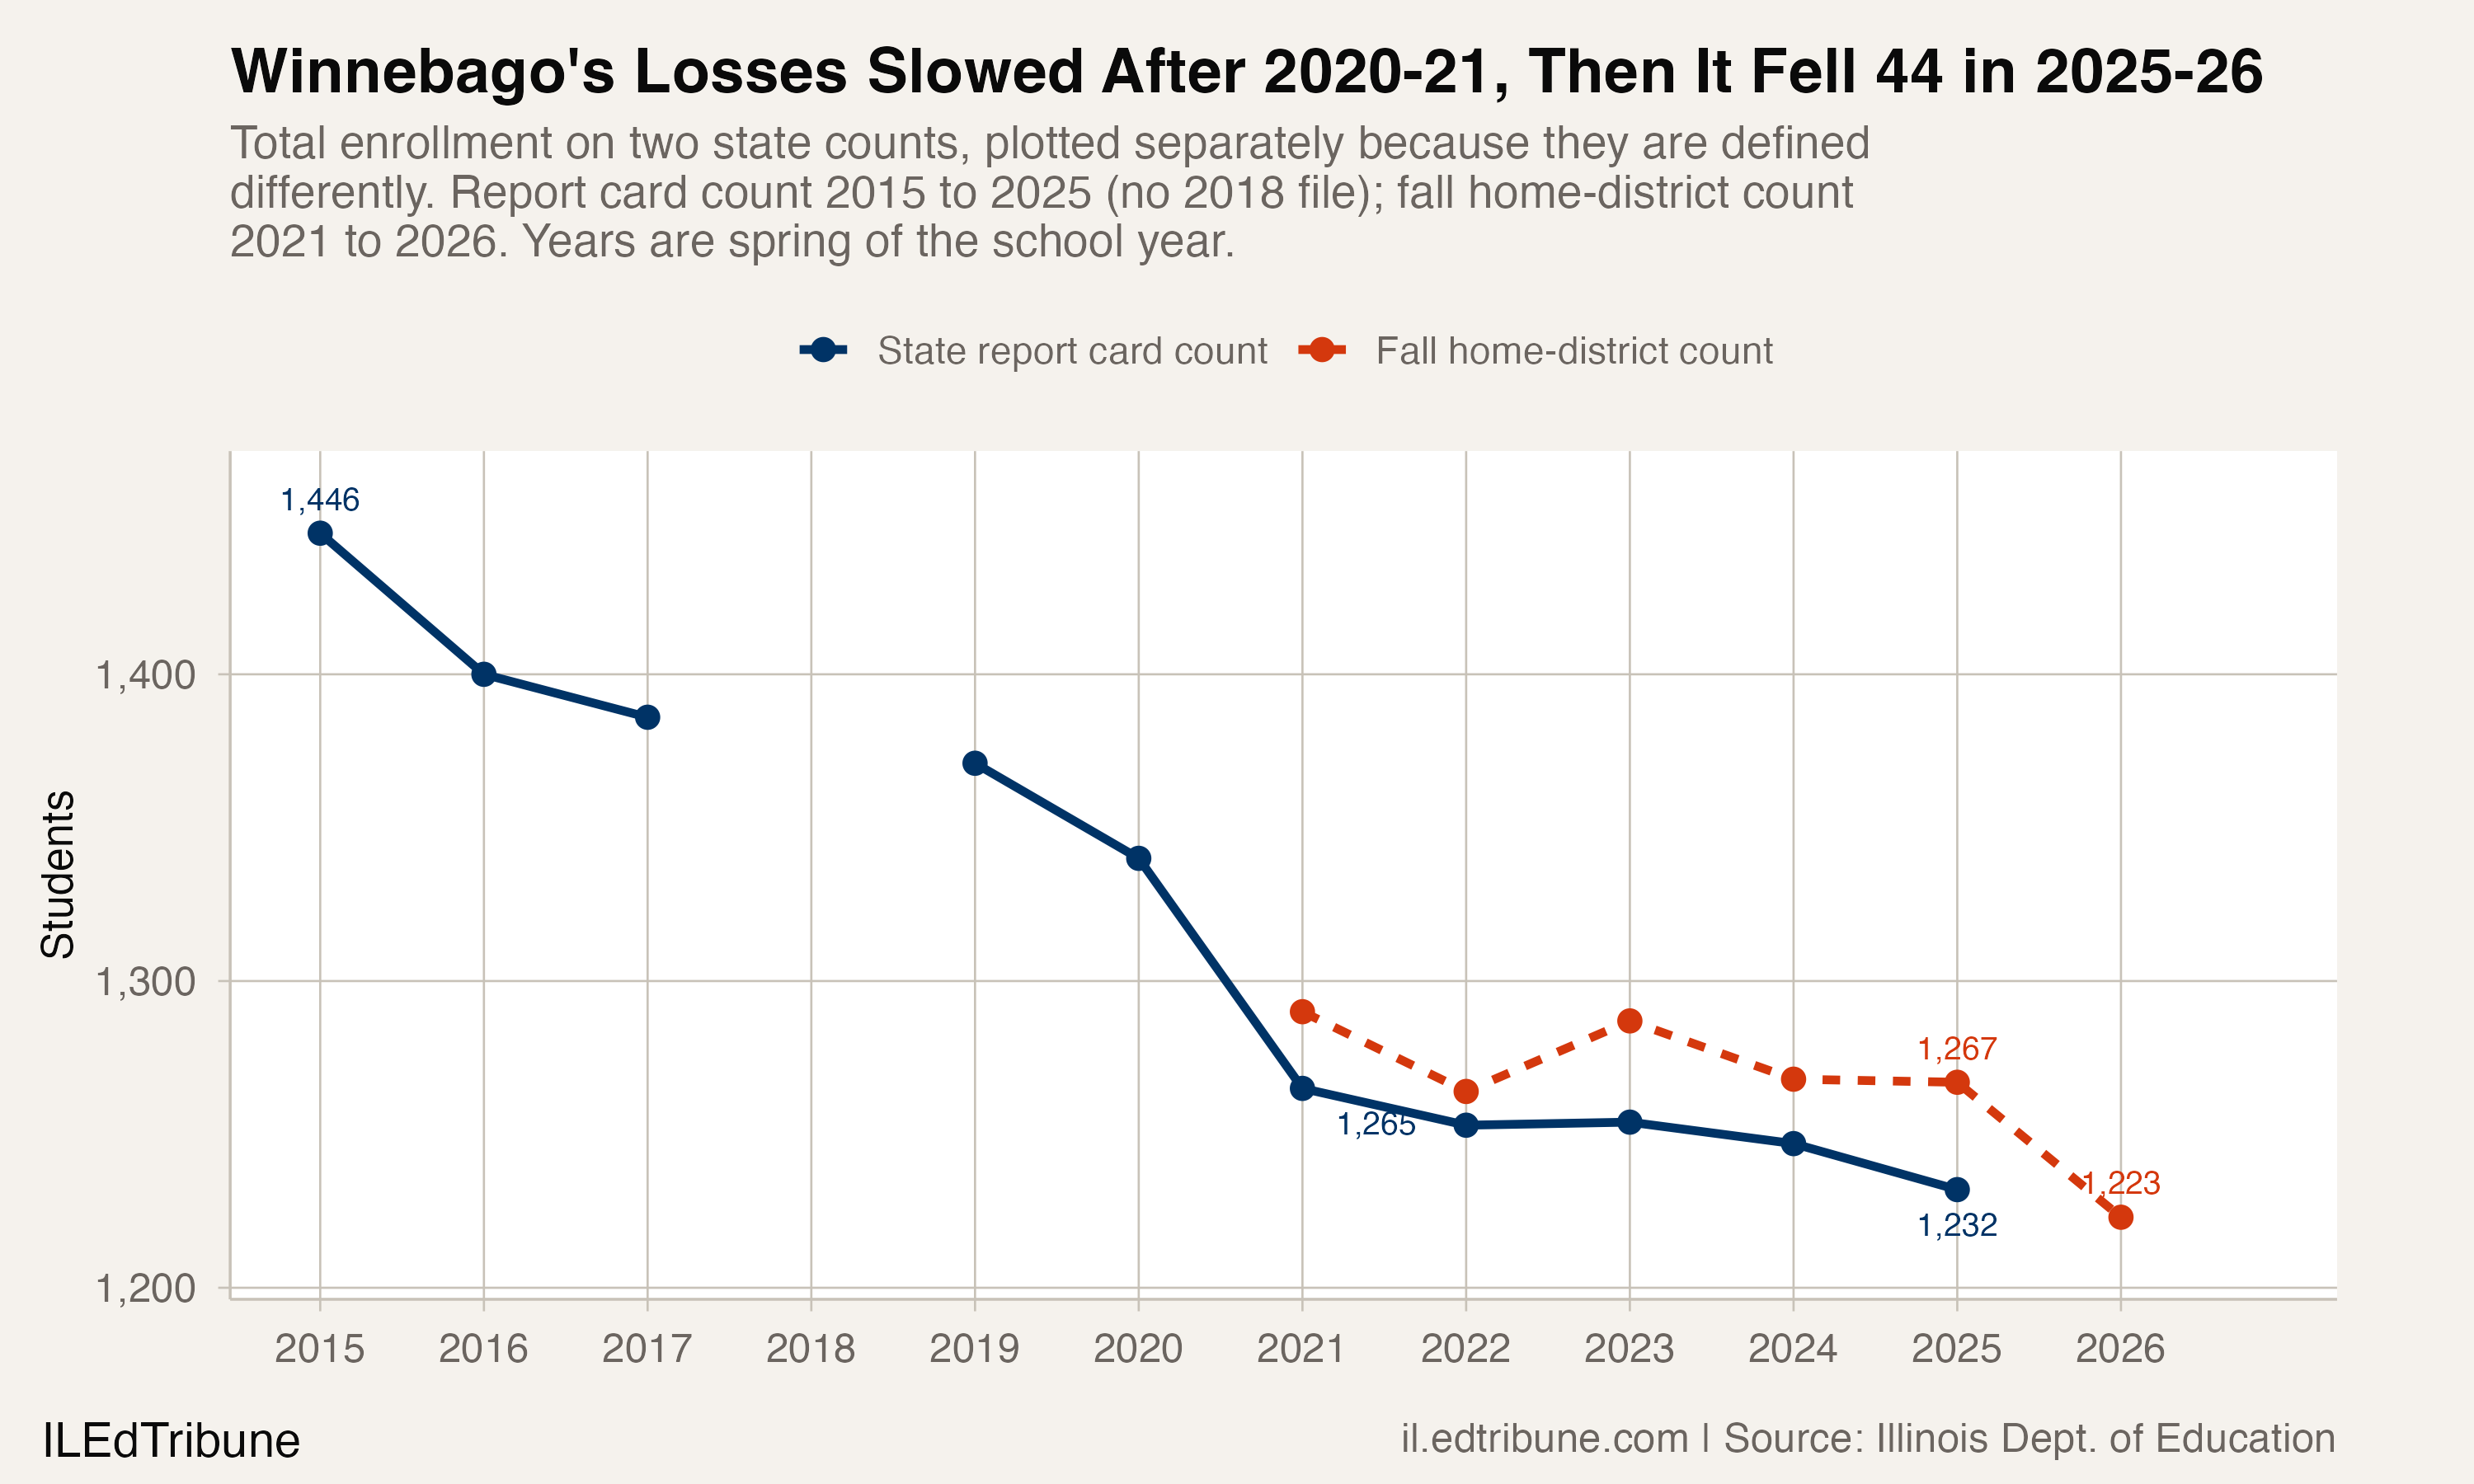
The loss is not spread evenly across those years. On the report card count, through 2020-21 the district gave up 181 students in six school years, an average of about 30 a year. In the four school years after that, through 2024-25, it gave up 33, an average of about eight.
Then the pace broke. On the fall count, the district fell from 1,267 students in 2024-25 to 1,223 in 2025-26, a drop of 44. That is the largest one-year drop in the fall count, which begins with 2020-21, and it leaves 2025-26 as the smallest year in that series.
The largest single-year drop in the report card record, 75 students, lands in 2020-21 and sits on the earlier side of the split. Even without that year, the earlier pace was faster: from 2014-15 through 2019-20 the district lost 106 students, about 21 a year, still more than twice the recent pace. The timing alone does not establish why the pace changed.
Where that leaves the district against the state
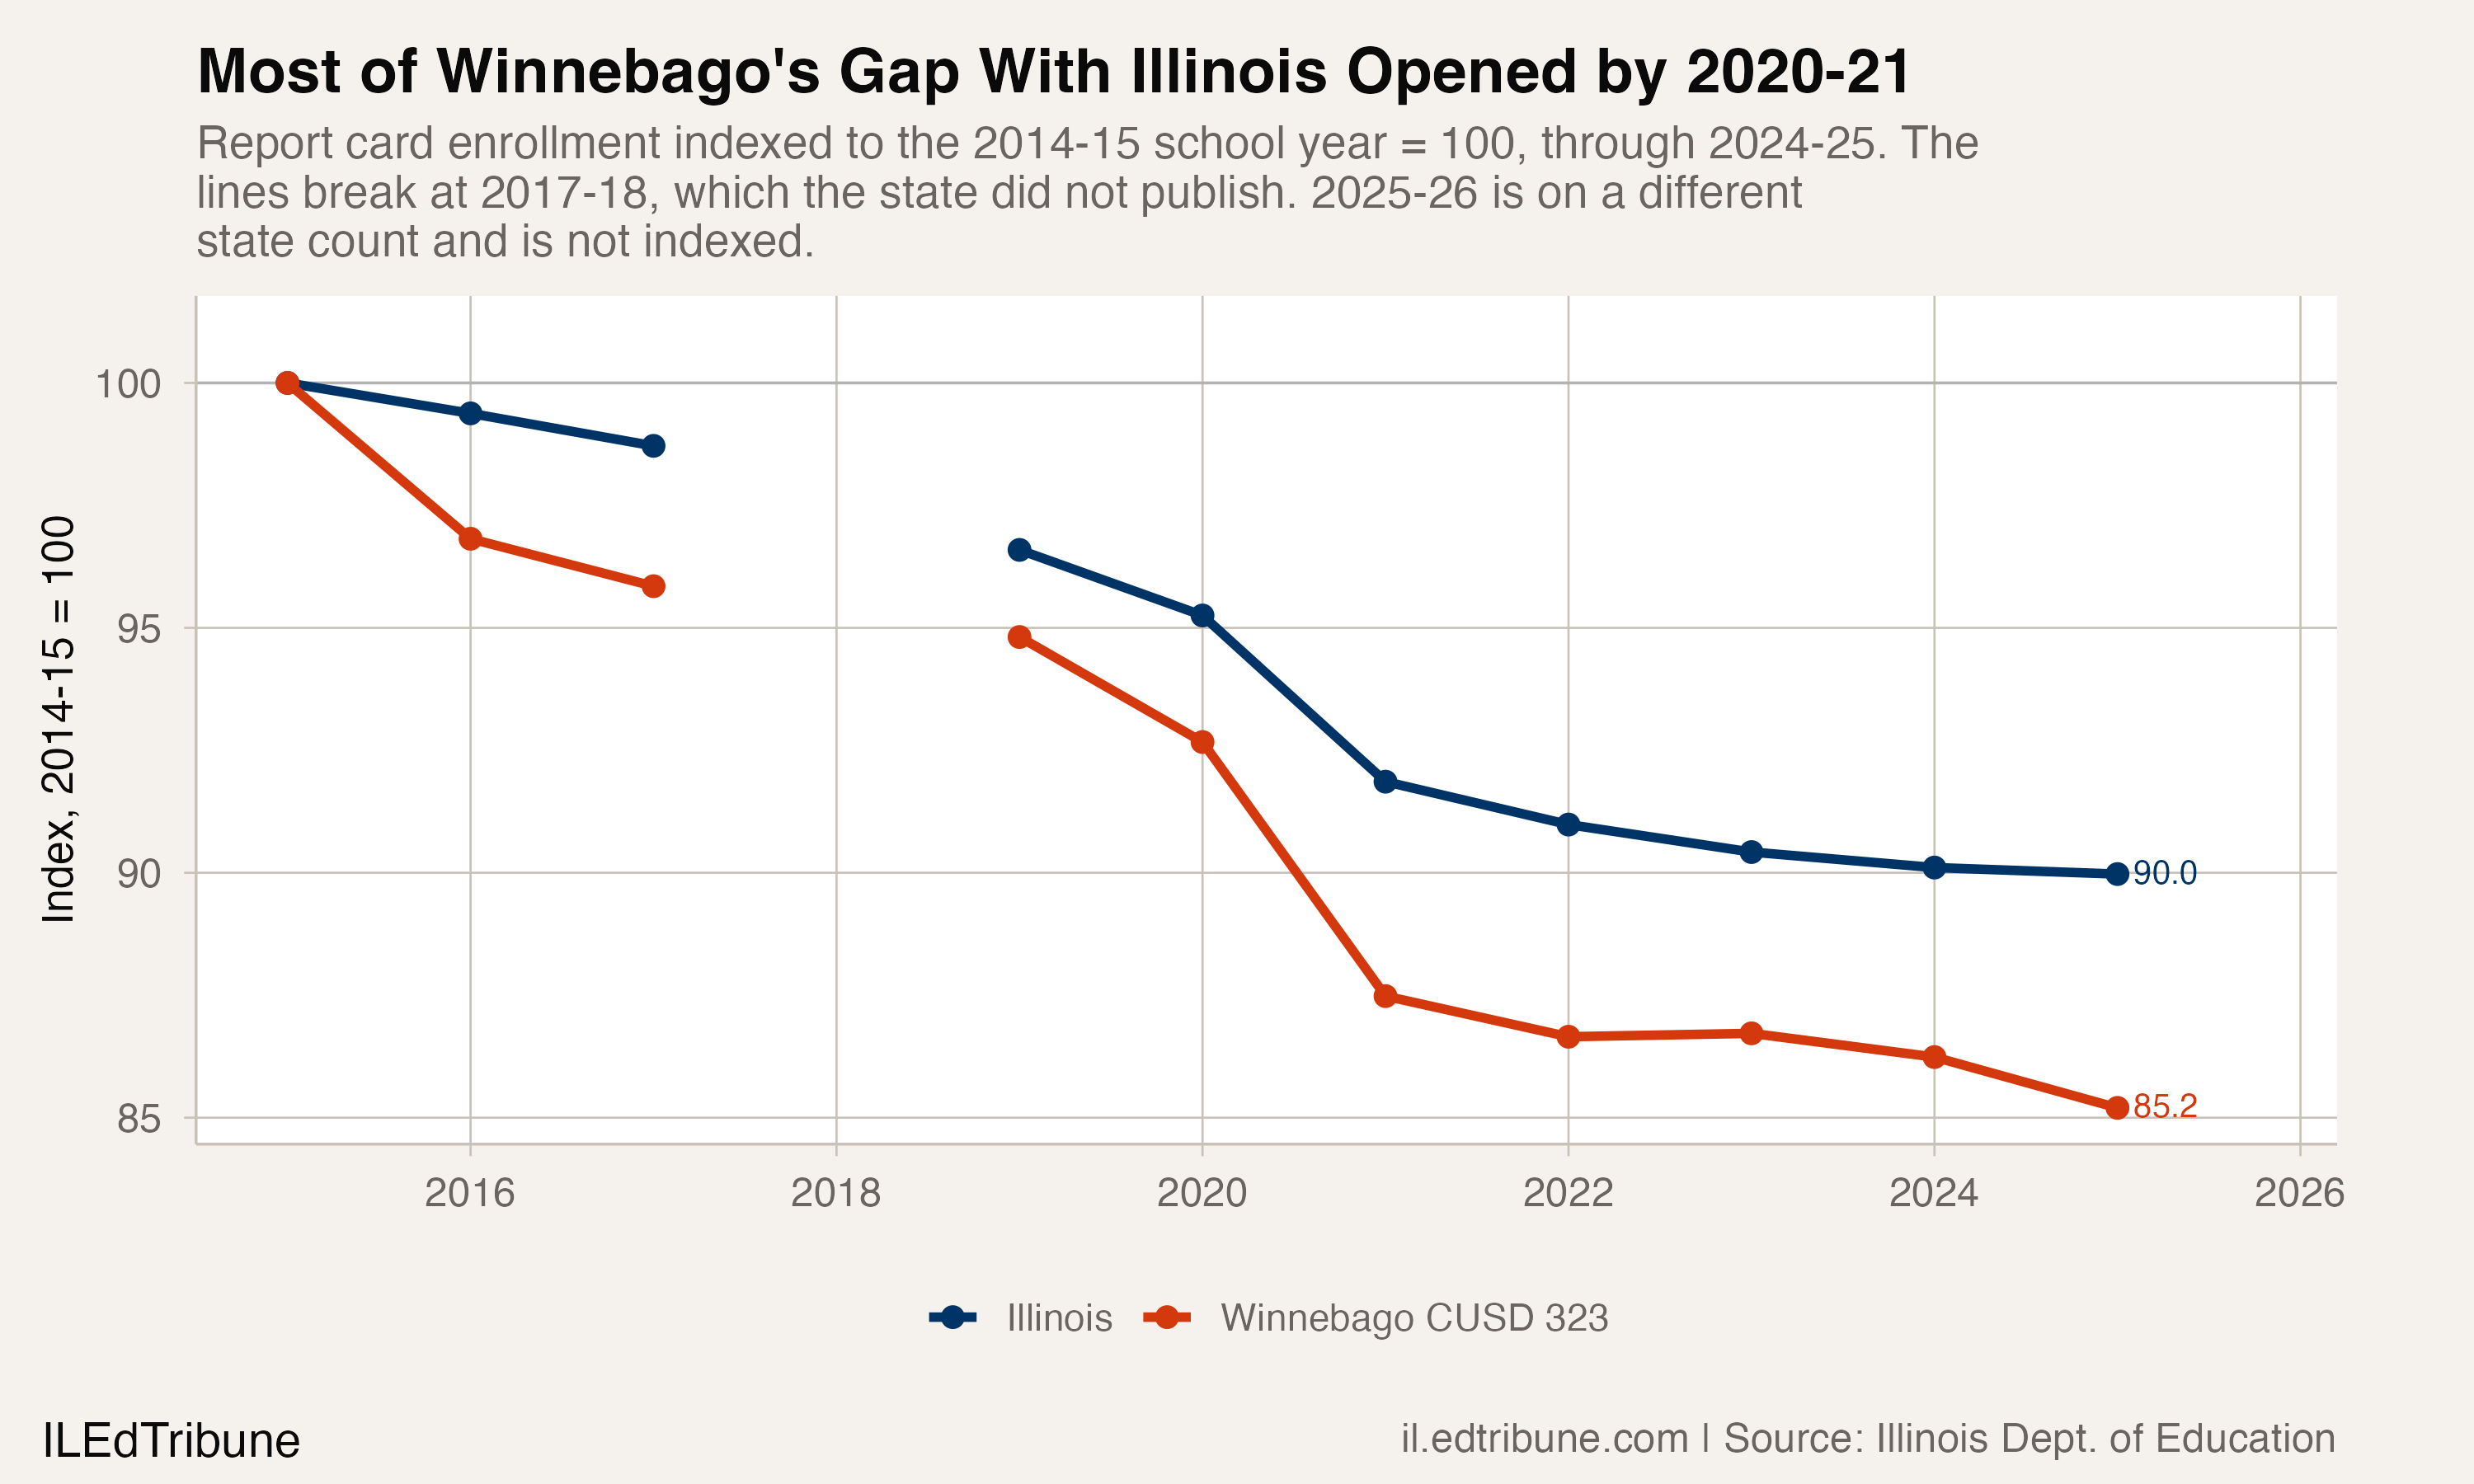
Put both lines on the same starting point, using the report card count, and most of the gap opened early. Indexed to 2014-15, Illinois stood at 90.0 in 2024-25 and Winnebago at 85.2. The distance between them was 4.4 points in 2020-21 and 4.8 points in 2024-25, so it kept widening after 2020-21, but slowly. From 2020-21 through 2024-25 the district lost 2.6 percent of its enrollment and the state lost 2.1 percent.
The comparison describes the pace of loss; it does not explain Dugan's statement about maintaining the district's positive course.
One number inside the most recent year is worth pulling apart. On the fall count, the district total fell by 44 students into 2025-26. Prekindergarten fell by 17, from 59 to 42. Enrollment from kindergarten through high school therefore fell by 27. Those are changes in reported enrollment, not a test of how Pre-K students later enter kindergarten. Dugan cautioned in a subsequent written note that Winnebago's Pre-K enrollment criteria affect that relationship; he found Pre-K a more reliable predictor in other districts. No regression or correlation test was performed for this article.
The grades an interim year has to look at
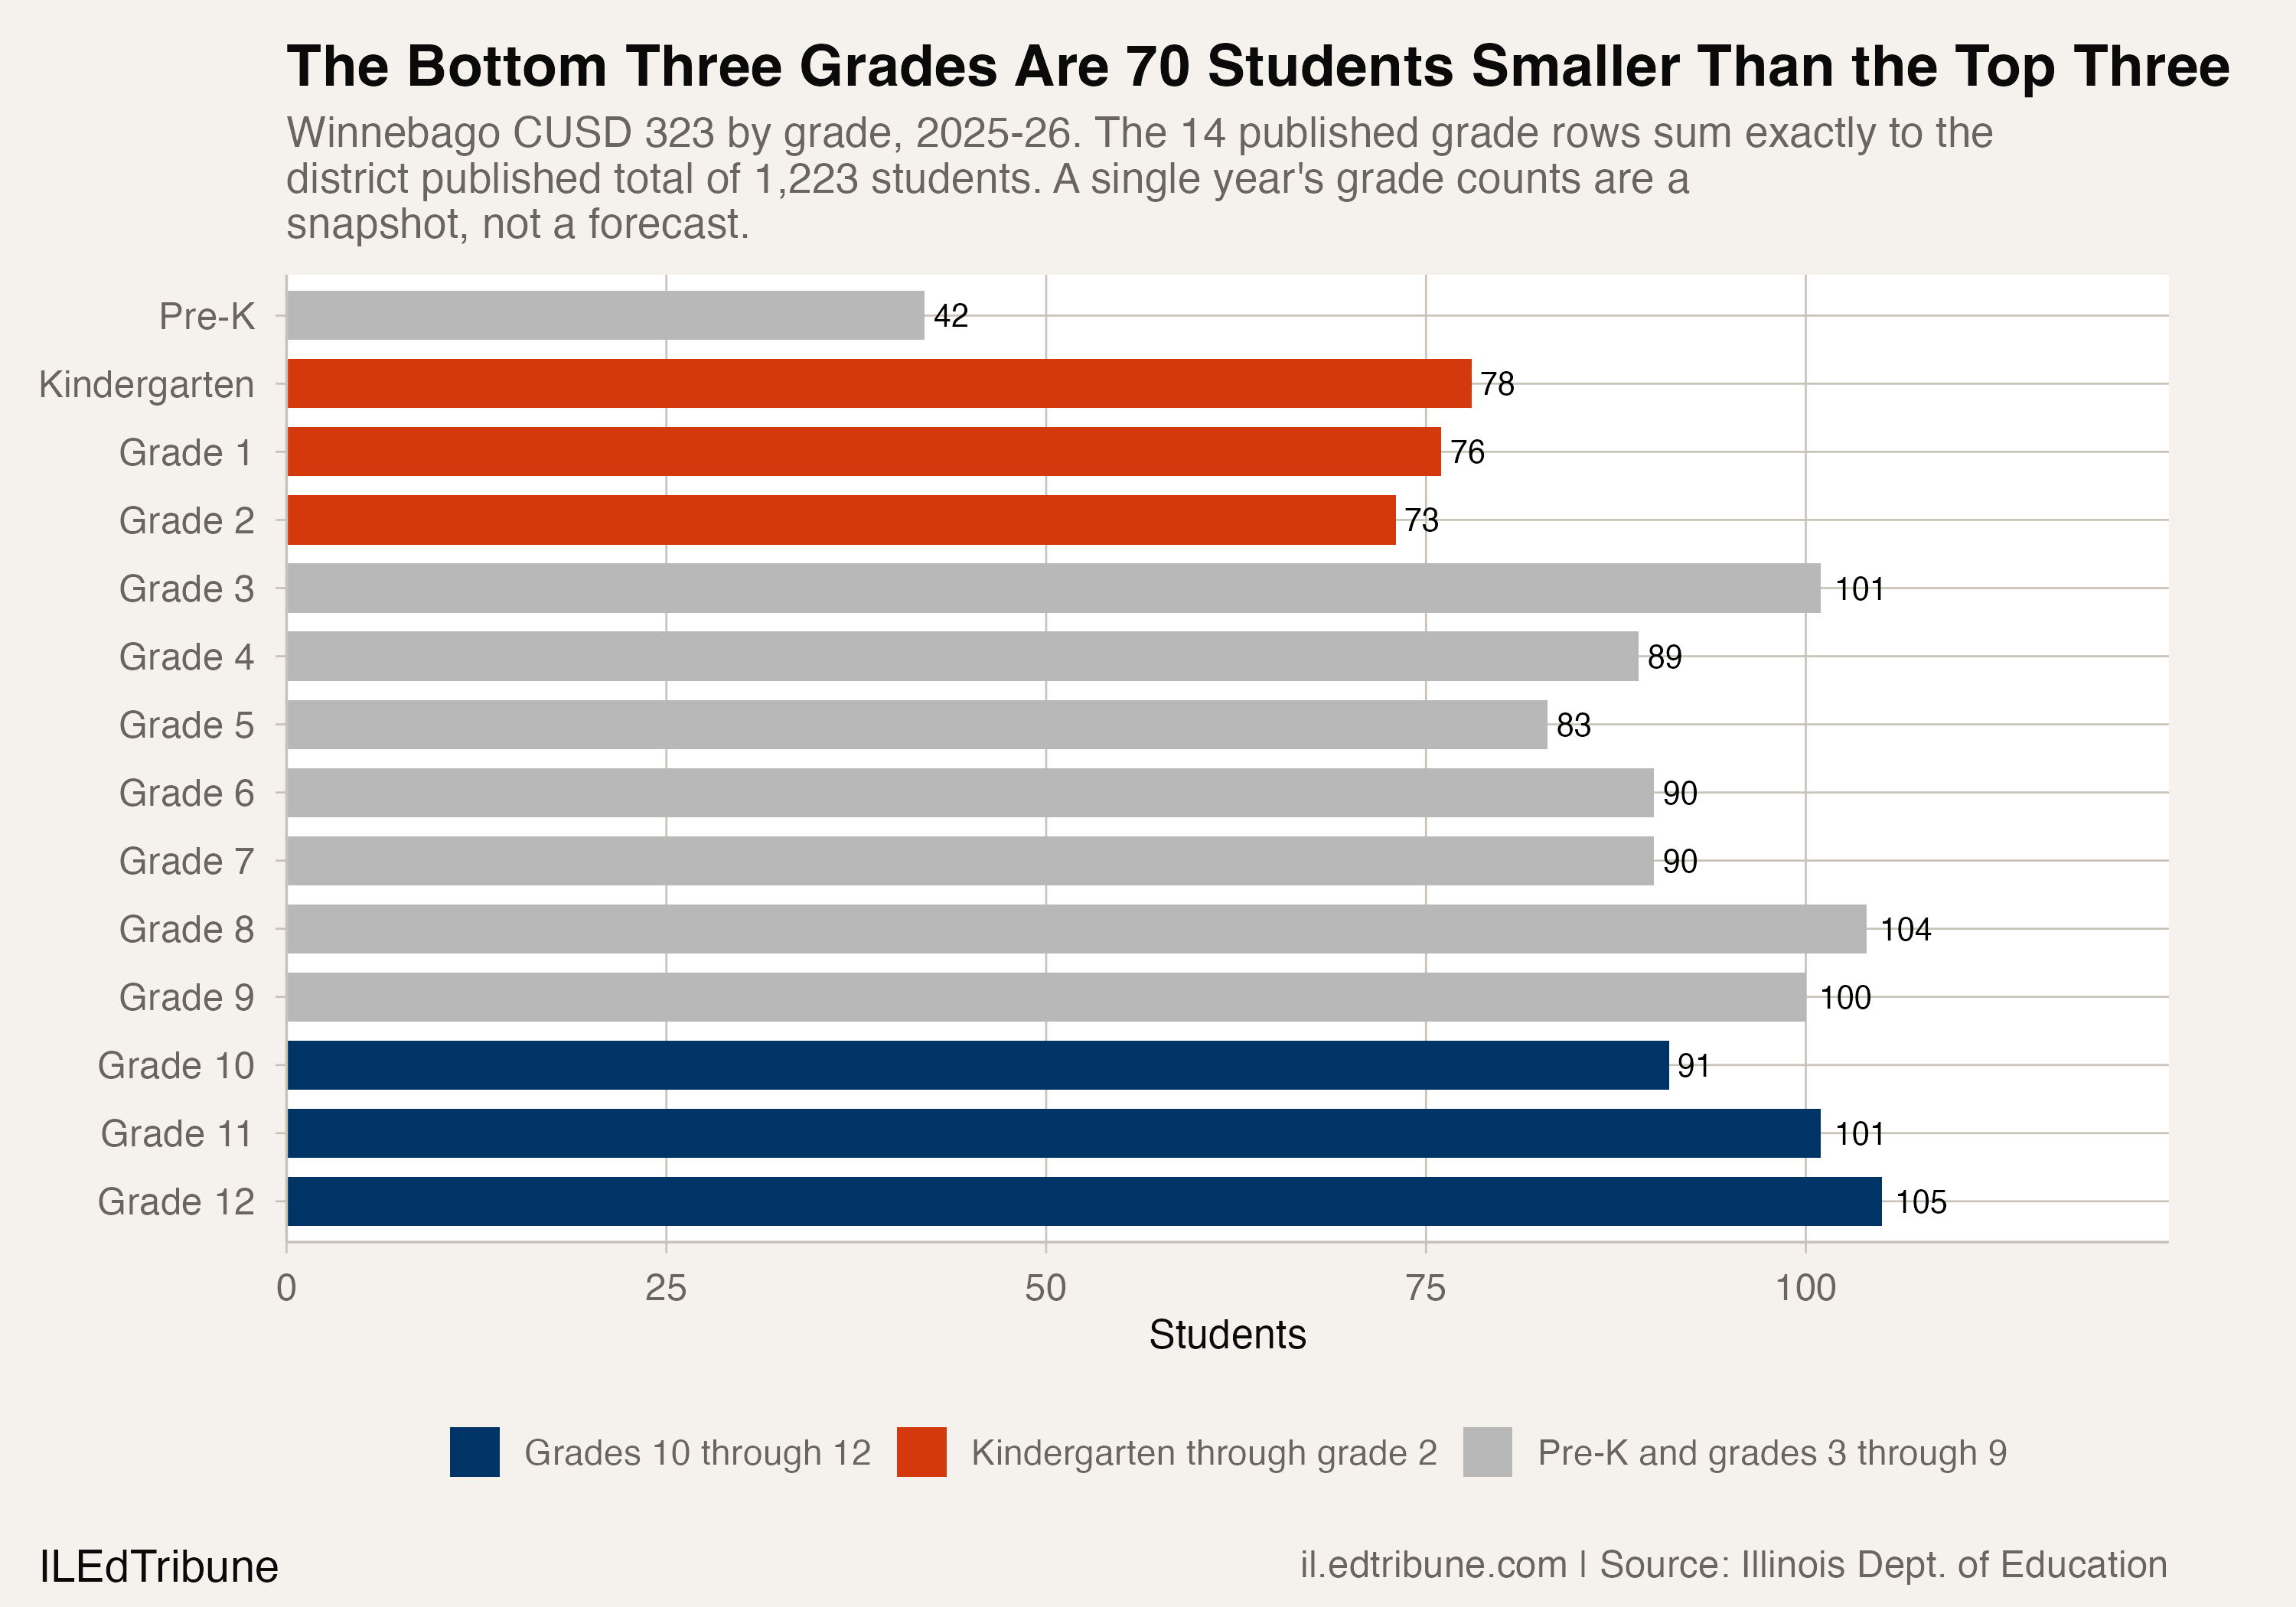
Winnebago enrolled 78 kindergartners in 2025-26 and 105 seniors. Kindergarten through grade 2 holds 227 students; grades 10 through 12 hold 297. That is a 70-student difference between the bottom of the system and the top, and the smallest single grade in the district outside prekindergarten is second grade, at 73.
A single year's grade counts are a snapshot, not a forecast, and this one is not a smooth ramp. A third grade of 101 sits directly above the three smallest classes in the district. These counts do not establish future class sizes or where students will enroll.
What comes after the interim year
Writing on September 12, Dugan described the state of play without going past it.
"The Board of Education is in discussions regarding the timeline. They have launched a survey to gain further input from the community," he wrote then.
The search has moved since. In a September 20 written response, Dugan said the survey is finished and the job is posted.
"Since our last communication the community survey regarding the next permanent superintendent was completed. The board has posted the vacancy for the superintendent position. The deadline for applications is October 19th. Anticipated date of candidate selection is winter of 2026. The start date is July 1, 2027," he wrote.
The date he gives for the permanent superintendent's first day, July 1, 2027, falls at the far end of the interim year he took on in August.
None of the counts above describe the classrooms Winnebago is running right now. Illinois has not published 2026-27 enrollment, and those figures will differ from these. What Dugan took over on August 28 is a district that ranked 317th of 859 Illinois districts by 2025-26 enrollment, that lost 14.8 percent of its students between 2014-15 and 2024-25, and whose slower losses of recent years gave way to a 44-student drop in 2025-26.
Dugan offered his view of what may be shaping enrollment, which the state enrollment file cannot test. In a follow-up written response, he described community feedback about Winnebago's schools, staff and leadership as strongly positive, while saying constrained single-family housing inventory, high prices and limited turnover make it harder for young families to move into the district. He said he intends to continue work with the village on that issue. Those are his account of local conditions and plans, not findings established by the state enrollment series.
Enrollment figures come from the Illinois State Board of Education: its report card count for 2014-15 through 2024-25 and its fall enrollment count for 2020-21 through 2025-26. The report card series has no figures for the school year ending in 2018, so the charts break across that gap. Dugan responded in writing on September 9, September 12 and September 20; quotations are reproduced as he wrote them, and he supplied the headshot used with this profile.
Detailed code that reproduces the analysis and figures in this article is available exclusively to EdTribune subscribers.
Discussion
Sign in to join the discussion.
Loading comments...