Correction (October 1, 2026): An earlier version, headlined "Smithton Gained 10 Students While Illinois Lost 11 Percent," compared Smithton's 2025-26 enrollment with a 2014-15 figure from a different state count. On the Report Card count, Smithton went from 534 students in 2014-15 to 535 in 2024-25, one more, while Illinois fell 10.0%, not 11.4%; the index chart now ends at 100.2 for Smithton and 90.0 for the state, not 101.9 and 88.6. On the state's fall count, used at both ends, Smithton added 3 students in 2025-26. Its rank is 553rd of 859 public districts, not 555th of 943 rows that included non-district entities. The 2025-26 total, grade and student-group figures are unchanged.

Smithton CCSD 130↗ET enrolled 544 students in 2025-26, the most recent school year in the state's published enrollment record. On the Illinois Report Card count, which runs through 2024-25, it enrolled 534 in 2014-15 and 535 a decade later. Illinois lost 10.0 percent of its students over the same stretch. Smithton ended up one student ahead.
Tom Springborn, who holds an Ed.D. and signs as superintendent, took the job on July 1. He came from the Monroe-Randolph Regional Office of Education, where he was director of services, and before that he was superintendent and principal at Prairie du Rocher. He succeeded Courtney Castelli.
That is an unusual route into a district office. Most superintendents arrive having seen one district closely. Springborn spent his last stretch looking at several from the outside.
"After serving as a superintendent, principal, and most recently working with school districts across Monroe, Randolph, and St. Clair counties through the ROE, I was excited for the opportunity to become part of a community where I could build long-term relationships," he wrote in answers to The ILEdTribune.
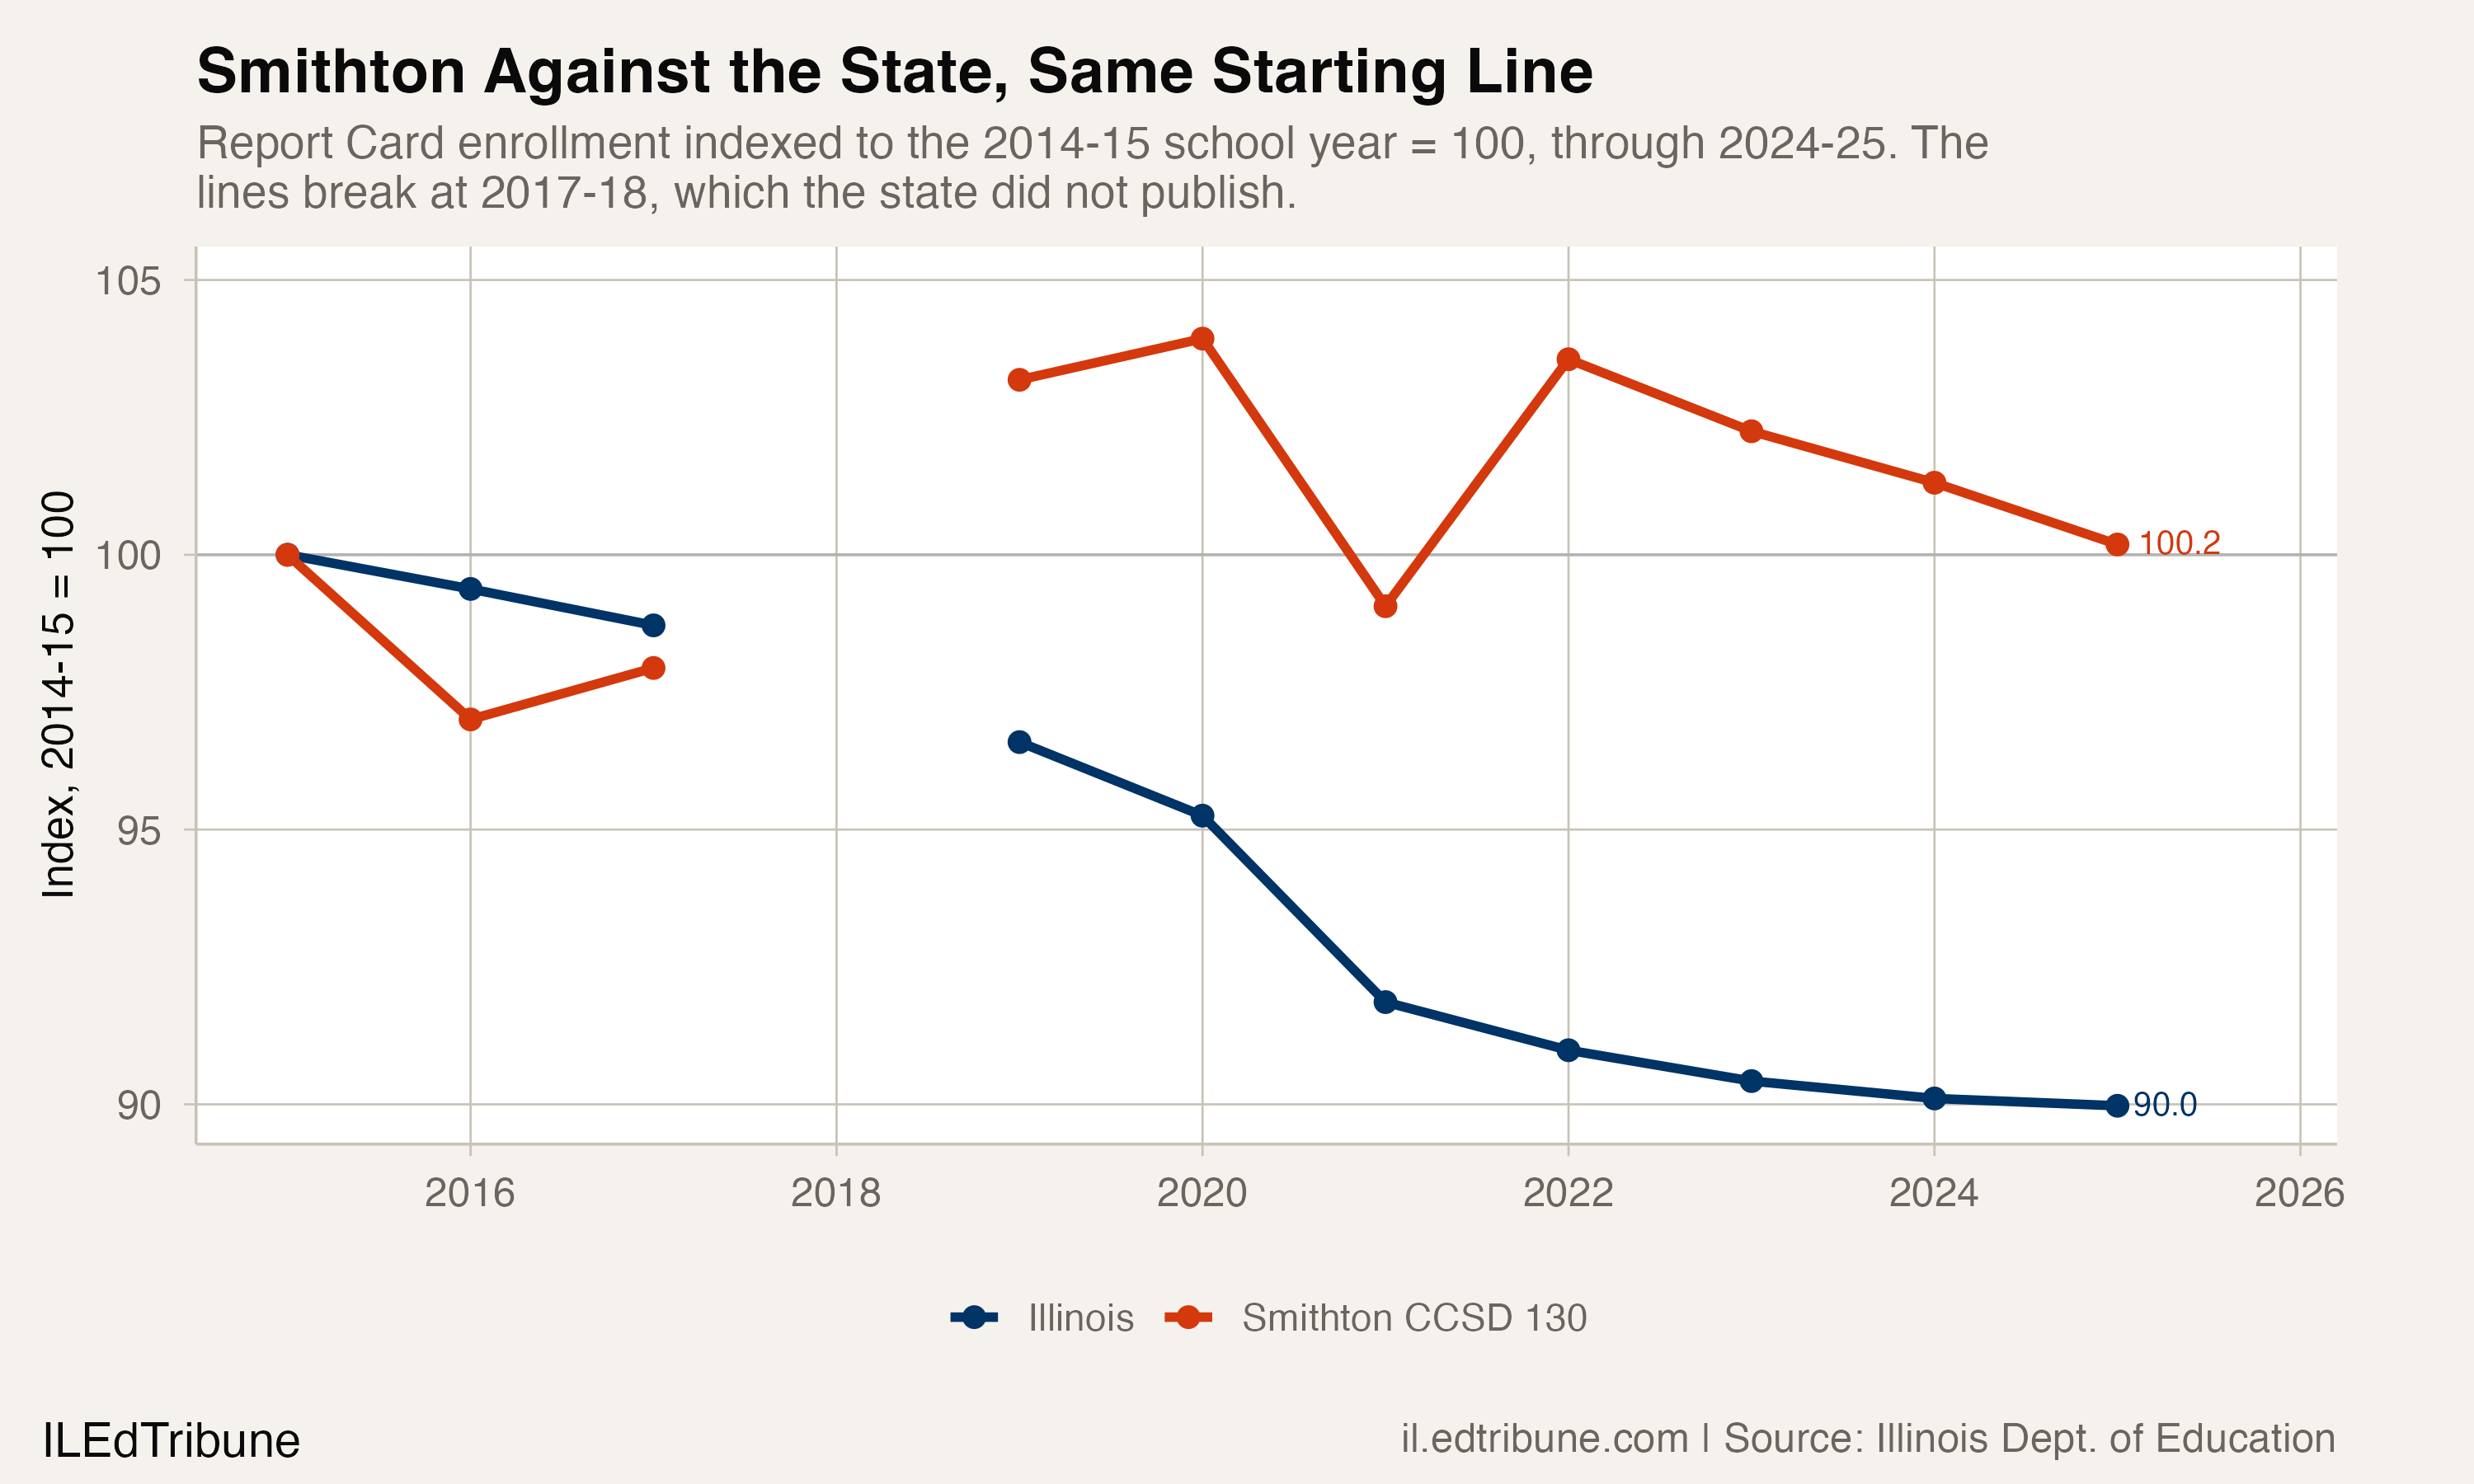
The gap in that chart is the whole finding. Start both lines together in 2014-15 and by 2024-25 the state finishes at 90.0 while Smithton finishes at 100.2. What separates them is not that Smithton grew. It is that Smithton did not shrink.
Springborn treats that as the operating condition rather than the accomplishment.
"Stable enrollment is a positive because it allows us to focus on providing a high-quality educational experience rather than reacting to large swings in student numbers," he wrote.
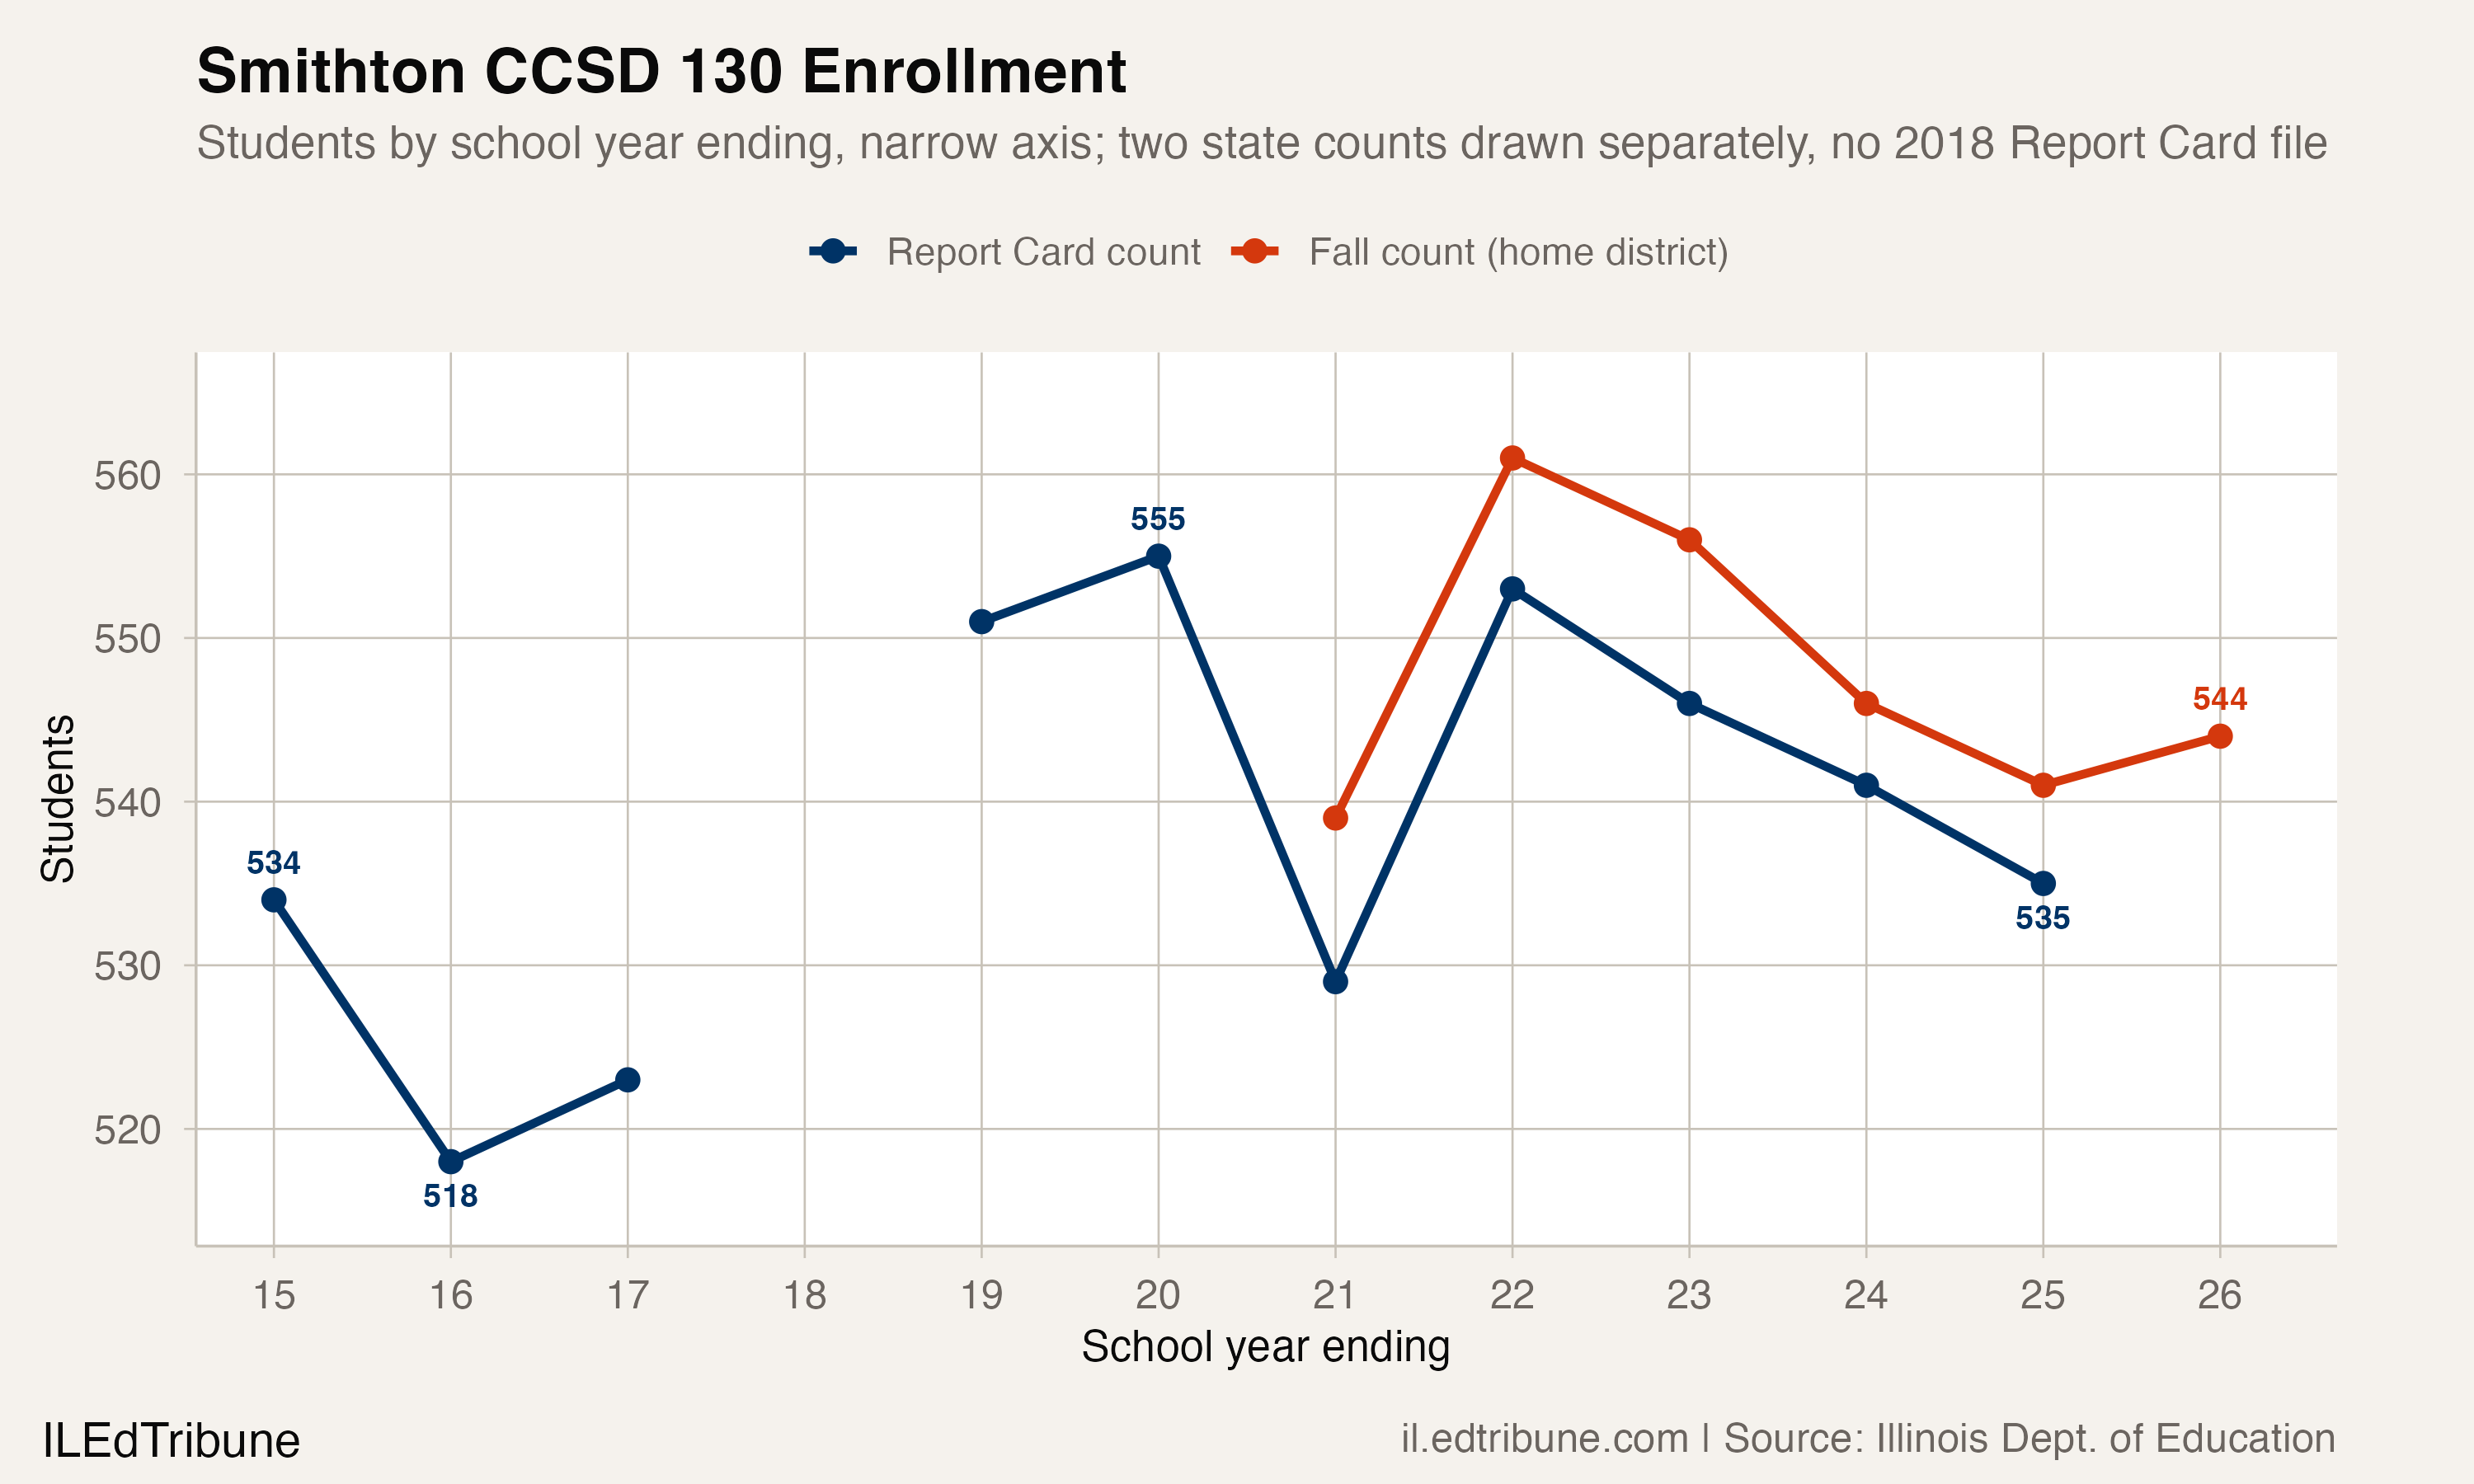
Year to year it is less placid than the decade comparison makes it sound, and the chart above is drawn on a narrow axis. On the Report Card count, Smithton's low was 518 in 2015-16 and its high was 555 in 2019-20, a range of 37 students. Nine changes between reported years run through that record, four up and five down, including a 26-student drop into 2020-21 and a 24-student recovery the following year. Its 2024-25 count of 535 sat 16 students below 2018-19, when it enrolled 551. The state published no district enrollment file for 2017-18, so the line breaks there rather than drawing across a year nobody counted. For 2025-26 the state has published only its fall count, which assigns each student to a home district; on that count Smithton added 3 students, from 541 to 544.
All 544 of those students are in one building. Smithton Elementary School, run by principal Josh Wemhoener, holds the entire district, pre-kindergarten through eighth grade. By total enrollment the district ranks 553rd among the 859 Illinois public districts that reported a positive count in 2025-26, which puts it almost exactly in the middle of the state and gives it the staffing math of a mid-sized elementary district with none of the spread.
Asked what a single-building PK-8 district changes about working with families, Springborn answered structurally.
"One of the biggest strengths of a PK-8 school is that families have one school and one team supporting their children from the very beginning through middle school," he wrote. "It creates opportunities to build lasting relationships and really know each child and family."
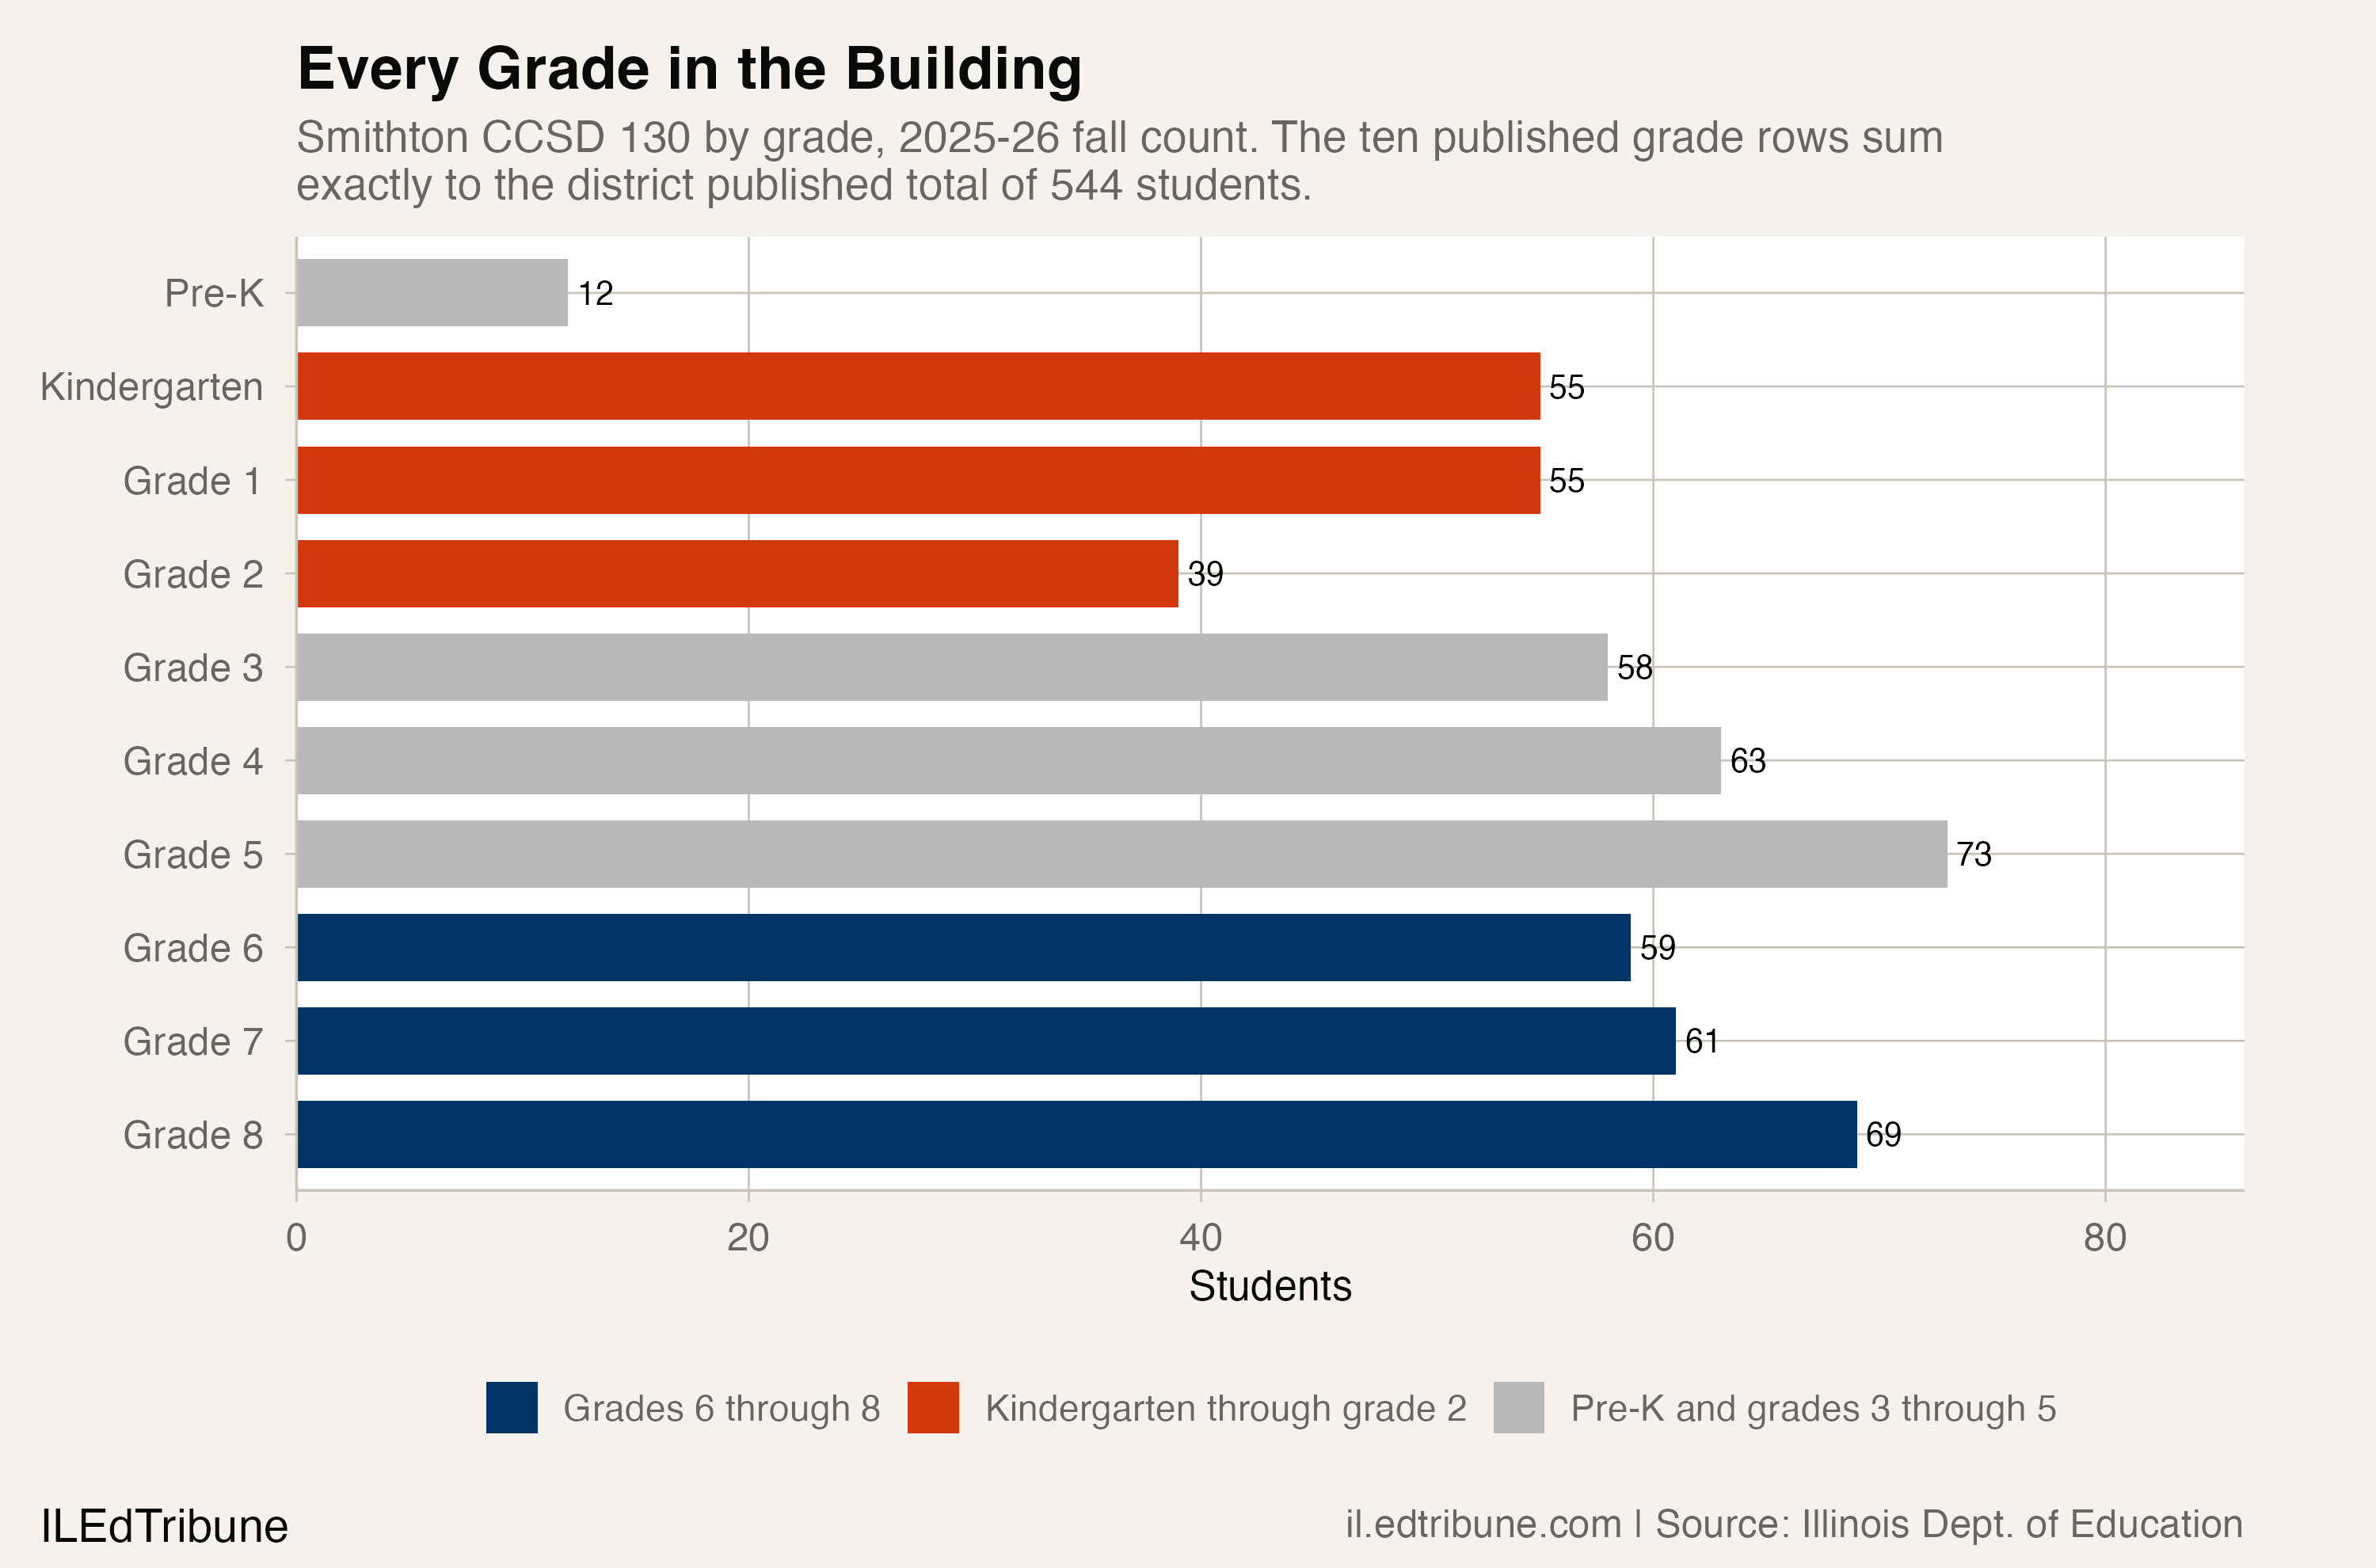
Inside the flat total, the grades are not evenly loaded. In 2025-26, kindergarten through second grade held 149 students and grades six through eight held 189, a gap of 40. Fifth grade was the largest single grade at 73. Second grade was the smallest at 39. Twelve children were in pre-kindergarten. The ten published grade rows add up to 544 with nothing left over, so this is the district's own accounting of itself rather than a reconstruction.
One year of grade counts is a planning signal, not a forecast, and this profile does not read a trend into it. What it does establish is where the pressure sits today. Springborn put the same emphasis on the younger end without being asked to.
"We will continue to watch enrollment trends closely, especially in the younger grades, to make thoughtful decisions about staffing, programming, and resources," he wrote.
In a one-building district those three words describe one master schedule. A 39-student second grade and a 69-student eighth grade are sectioning and assignment decisions that land on the same principal in the same hallway, and there is no second campus to move a teacher to. The upside is the one Springborn named: the team making those calls is the team that already knows the families.
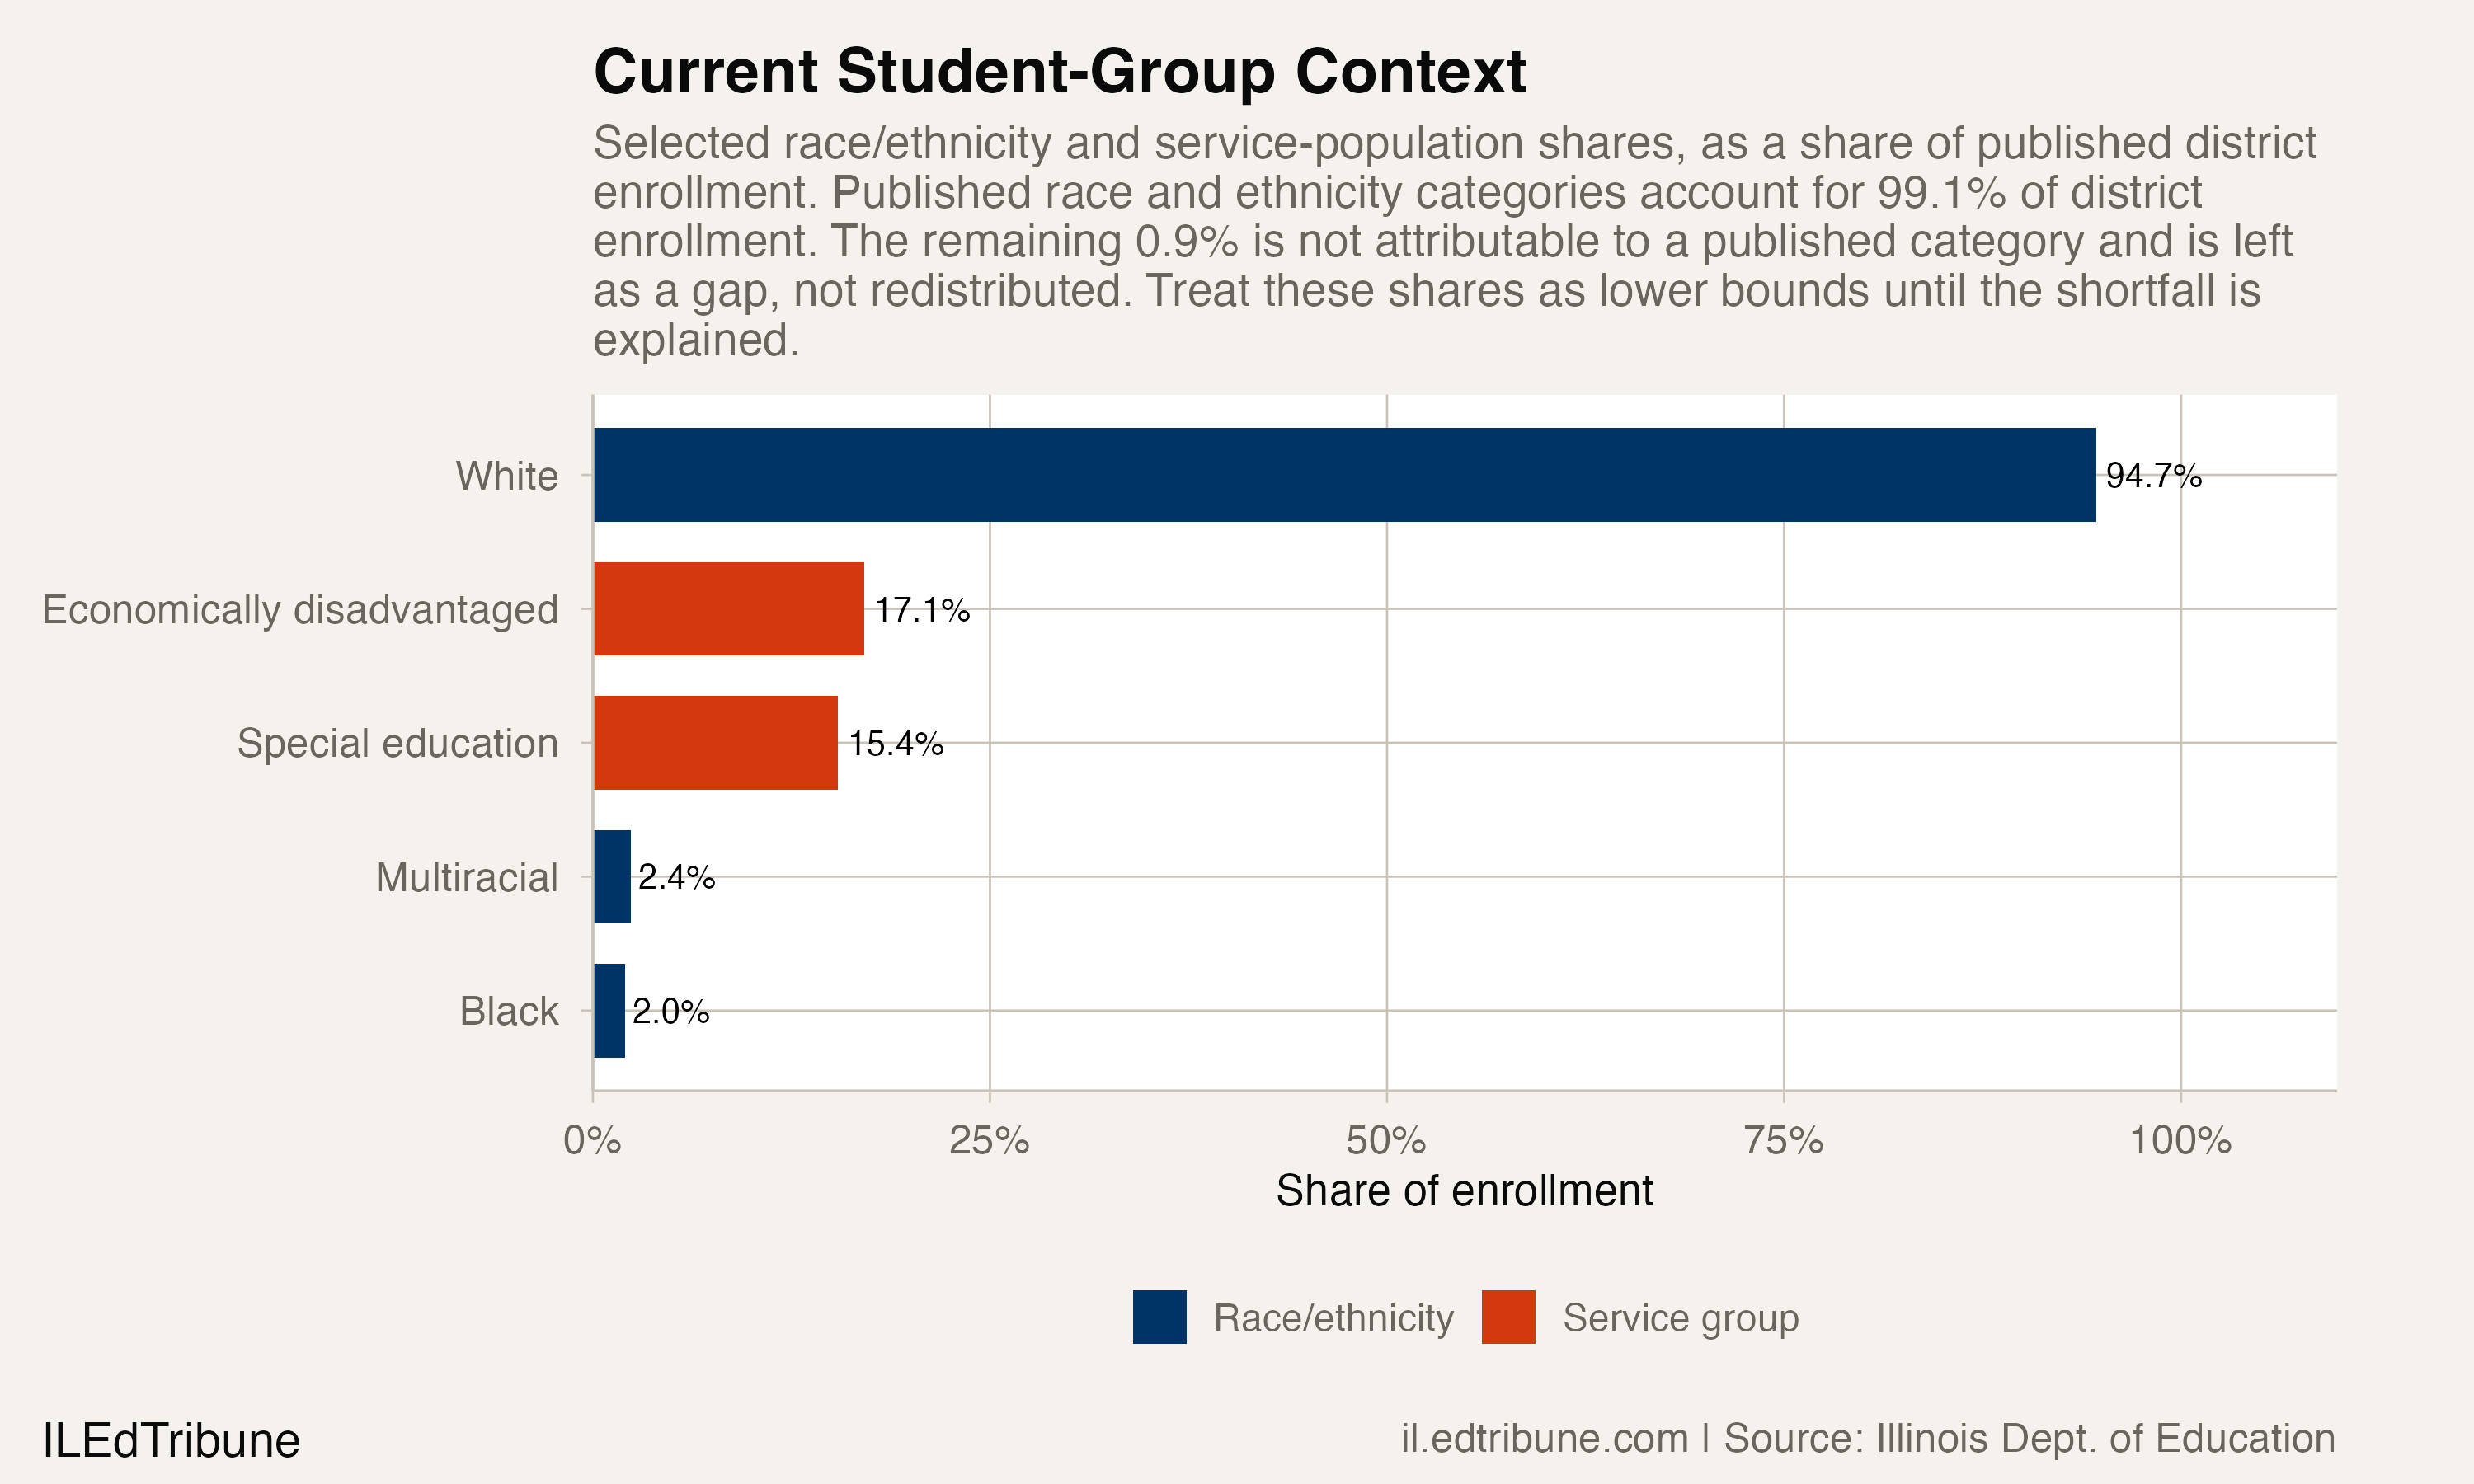
The students inside that building carry real service demand. In 2025-26, 93 Smithton students, 17.1 percent, were classified as economically disadvantaged, and 84 students, 15.4 percent, received special education services. Those two groups overlap with each other and with race, so they cannot be added together. By race and ethnicity the state published 515 white students, or 94.7 percent, along with 13 multiracial students and 11 Black students. Five further categories were withheld. The published categories cover 99.1 percent of enrollment, so those shares are lower bounds and the remainder stays a gap rather than being spread across the categories that were reported.
None of these figures describe the classrooms Smithton is running right now. The state's 2026-27 counts have not been published, and they will differ. What Springborn inherited is a district that has held its size through a decade in which most of Illinois did not, and a set of grade counts that puts more of its students at the top of the building than the bottom.
His stated approach to that is deliberately unhurried.
"My first priorities are simple: listen, learn, and be present," he wrote.
Enrollment figures come from the Illinois State Board of Education public enrollment record. Changes through 2024-25 use the Illinois Report Card count, which has no figure for the school year ending in 2018, so the charts break across that gap. The 2025-26 figures and the change into 2025-26 use the state's Fall Enrollment Report on both ends; the two counts are never subtracted from each other. Springborn responded in writing and supplied the answers and headshot used for this profile.
Detailed code that reproduces the analysis and figures in this article is available exclusively to EdTribune subscribers.
Discussion
Sign in to join the discussion.
Loading comments...